
7.6 KiB
Name
双重技术指标动量反转交易策略结合风险管理系统-Dual-Technical-Indicator-Momentum-Reversal-Trading-Strategy-with-Risk-Management-System
Author
ChaoZhang
Strategy Description
[trans]
概述
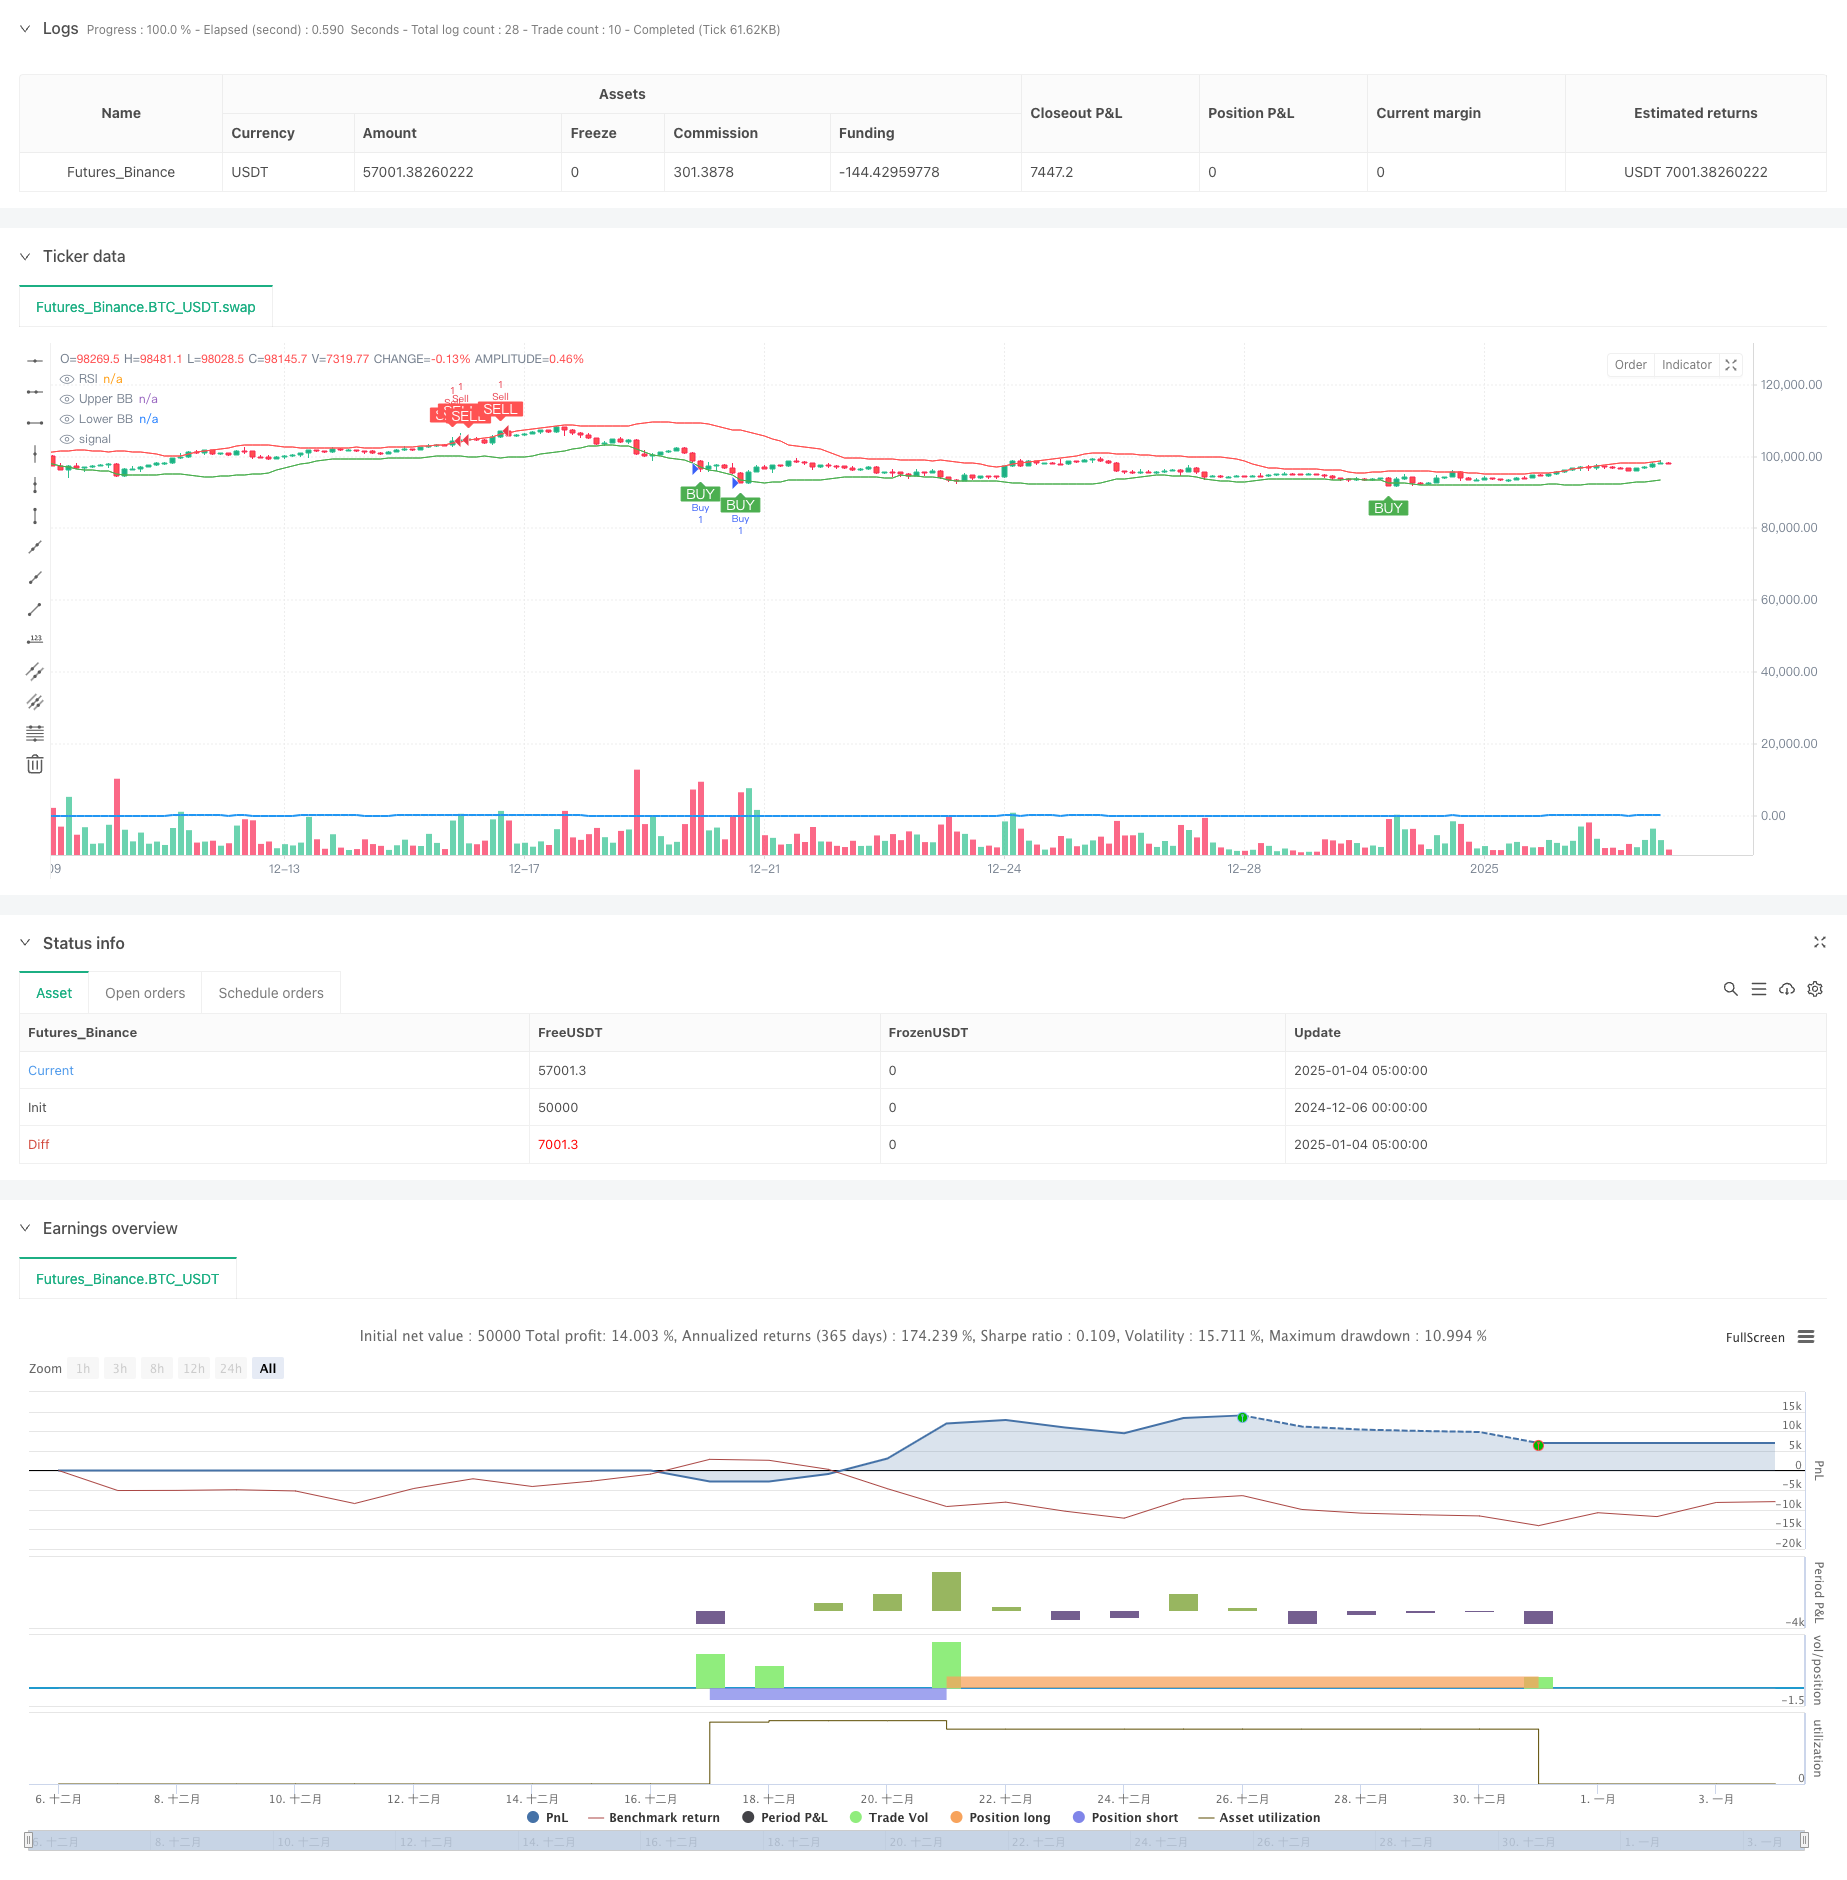
该策略是一个结合RSI和布林带双重技术指标的动量反转交易系统,通过识别超买超卖区域进行交易。策略采用了1:2的风险收益比,并结合了移动止损来进行风险控制。核心逻辑是在RSI和布林带同时出现超买或超卖信号时进行交易,通过严格的风险管理来保护资金。
策略原理
策略使用14周期RSI和20周期布林带作为主要指标。买入条件需同时满足:RSI低于30(超卖)且价格触及或低于布林带下轨。卖出条件需同时满足:RSI高于70(超买)且价格触及或高于布林带上轨。系统采用5根K线的最高/最低点作为移动止损,止盈位置为止损距离的2倍,严格执行1:2的风险收益比。
策略优势
- 双重技术指标过滤提高了信号质量,减少虚假信号
- 结合动量和波动率指标,提供更全面的市场视角
- 严格的风险控制机制,包括移动止损和固定风险收益比
- 系统完全自动化,消除人为情绪干扰
- 策略逻辑清晰,易于理解和维护
策略风险
- 在趋势市场中可能频繁止损
- 双重条件可能错过部分交易机会
- 固定的RSI和布林带参数可能不适用所有市场环境
- 移动止损可能在波动市场中过早退出
- 需要合理的资金管理以应对连续亏损
策略优化方向
- 引入自适应参数机制,根据市场波动度动态调整指标参数
- 增加趋势过滤器,在强趋势中暂停反转交易
- 开发动态风险收益比系统,根据市场状况调整
- 加入成交量确认机制,提高信号可靠性
- 实现更灵活的止损机制,如跟踪止损或时间止损
总结
这是一个结构完整的反转交易策略,通过双重技术指标提高准确性,并采用严格的风险管理。策略虽然简单直观,但包含了成熟的交易系统所需的关键要素。通过建议的优化方向,该策略还有进一步提升的空间。在实盘交易中,建议先进行充分的回测和参数优化。 ||
Overview
This strategy is a momentum reversal trading system combining RSI and Bollinger Bands indicators, designed to identify overbought and oversold areas. It implements a 1:2 risk-reward ratio with trailing stop loss for risk management. The core logic is to execute trades when both RSI and Bollinger Bands show oversold or overbought signals simultaneously, protecting capital through strict risk management.
Strategy Principles
The strategy utilizes a 14-period RSI and 20-period Bollinger Bands as primary indicators. Buy conditions require both: RSI below 30 (oversold) and price at or below the lower Bollinger Band. Sell conditions require both: RSI above 70 (overbought) and price at or above the upper Bollinger Band. The system uses 5-bar high/low points for trailing stops, with take profit set at twice the stop loss distance, strictly maintaining a 1:2 risk-reward ratio.
Strategy Advantages
- Dual indicator filtering improves signal quality and reduces false signals
- Combines momentum and volatility indicators for a comprehensive market perspective
- Strict risk control mechanisms including trailing stops and fixed risk-reward ratio
- Fully automated system eliminating emotional interference
- Clear strategy logic that is easy to understand and maintain
Strategy Risks
- May experience frequent stops in trending markets
- Dual conditions might miss some trading opportunities
- Fixed RSI and Bollinger Bands parameters may not suit all market conditions
- Trailing stops might exit positions too early in volatile markets
- Requires proper money management to handle consecutive losses
Optimization Directions
- Implement adaptive parameters mechanism to dynamically adjust indicator settings based on market volatility
- Add trend filter to pause reversal trading during strong trends
- Develop dynamic risk-reward ratio system adjusting to market conditions
- Incorporate volume confirmation to improve signal reliability
- Implement more flexible stop loss mechanisms like trailing stops or time-based exits
Summary
This is a well-structured reversal trading strategy that enhances accuracy through dual technical indicators and employs strict risk management. While simple and intuitive, it contains all key elements required for a mature trading system. Through the suggested optimization directions, the strategy has room for further improvement. For live trading, thorough backtesting and parameter optimization are recommended.[/trans]
Source (PineScript)
/*backtest
start: 2024-12-06 00:00:00
end: 2025-01-04 08:00:00
period: 3h
basePeriod: 3h
exchanges: [{"eid":"Futures_Binance","currency":"BTC_USDT"}]
*/

//@version=5
strategy("RSI + Bollinger Bands with 1:2 Risk/Reward", overlay=true)

// Define Inputs
length_rsi = input.int(14, title="RSI Period")
oversold_level = input.int(30, title="RSI Oversold Level")
overbought_level = input.int(70, title="RSI Overbought Level")
length_bb = input.int(20, title="Bollinger Bands Period")
src = close
risk_to_reward = input.float(2.0, title="Risk-to-Reward Ratio", minval=1.0, step=0.1)

// Calculate Indicators
rsi_value = ta.rsi(src, length_rsi)
basis = ta.sma(src, length_bb)
dev = ta.stdev(src, length_bb)
upper_band = basis + 2 * dev
lower_band = basis - 2 * dev

// Define Buy and Sell Conditions
rsi_buy_condition = rsi_value < oversold_level // RSI below 30 (buy signal)
bollinger_buy_condition = close <= lower_band // Price at or near lower Bollinger Band (buy signal)

rsi_sell_condition = rsi_value > overbought_level // RSI above 70 (sell signal)
bollinger_sell_condition = close >= upper_band // Price at or near upper Bollinger Band (sell signal)

// Combine Buy and Sell Conditions
buy_condition = rsi_buy_condition and bollinger_buy_condition
sell_condition = rsi_sell_condition and bollinger_sell_condition

// Plot Buy and Sell Signals with white text and green/red boxes
plotshape(series=buy_condition, location=location.belowbar, color=color.green, style=shape.labelup, title="Buy Signal", text="BUY", textcolor=color.white, size=size.small)
plotshape(series=sell_condition, location=location.abovebar, color=color.red, style=shape.labeldown, title="Sell Signal", text="SELL", textcolor=color.white, size=size.small)

// Calculate Swing Points (for Stop Loss)
swing_low = ta.lowest(low, 5)  // Last 5 bars' low
swing_high = ta.highest(high, 5) // Last 5 bars' high

// Calculate Risk (Distance from Entry to SL)
long_risk = close - swing_low
short_risk = swing_high - close

// Calculate Take Profit using 1:2 Risk-to-Reward Ratio
take_profit_long = close + 2 * long_risk
take_profit_short = close - 2 * short_risk

// Strategy Execution: Enter Buy/Sell Positions
if buy_condition
    strategy.entry("Buy", strategy.long)
    strategy.exit("Take Profit", "Buy", limit=take_profit_long, stop=swing_low)  // Set TP and SL for Buy

if sell_condition
    strategy.entry("Sell", strategy.short)
    strategy.exit("Take Profit", "Sell", limit=take_profit_short, stop=swing_high)  // Set TP and SL for Sell

// Plotting the Indicators for Visualization (Optional - comment out if not needed)
plot(rsi_value, color=color.blue, title="RSI", linewidth=2, display=display.none)
plot(upper_band, color=color.red, title="Upper BB", display=display.none)
plot(lower_band, color=color.green, title="Lower BB", display=display.none)
Detail
https://www.fmz.com/strategy/477609
Last Modified
2025-01-06 16:45:01