
14 KiB
Name
双重平滑海肯阿希趋势跟随策略Double-Smoothed-Heiken-Ashi-Trend-Following-Strategy
Author
ChaoZhang
Strategy Description
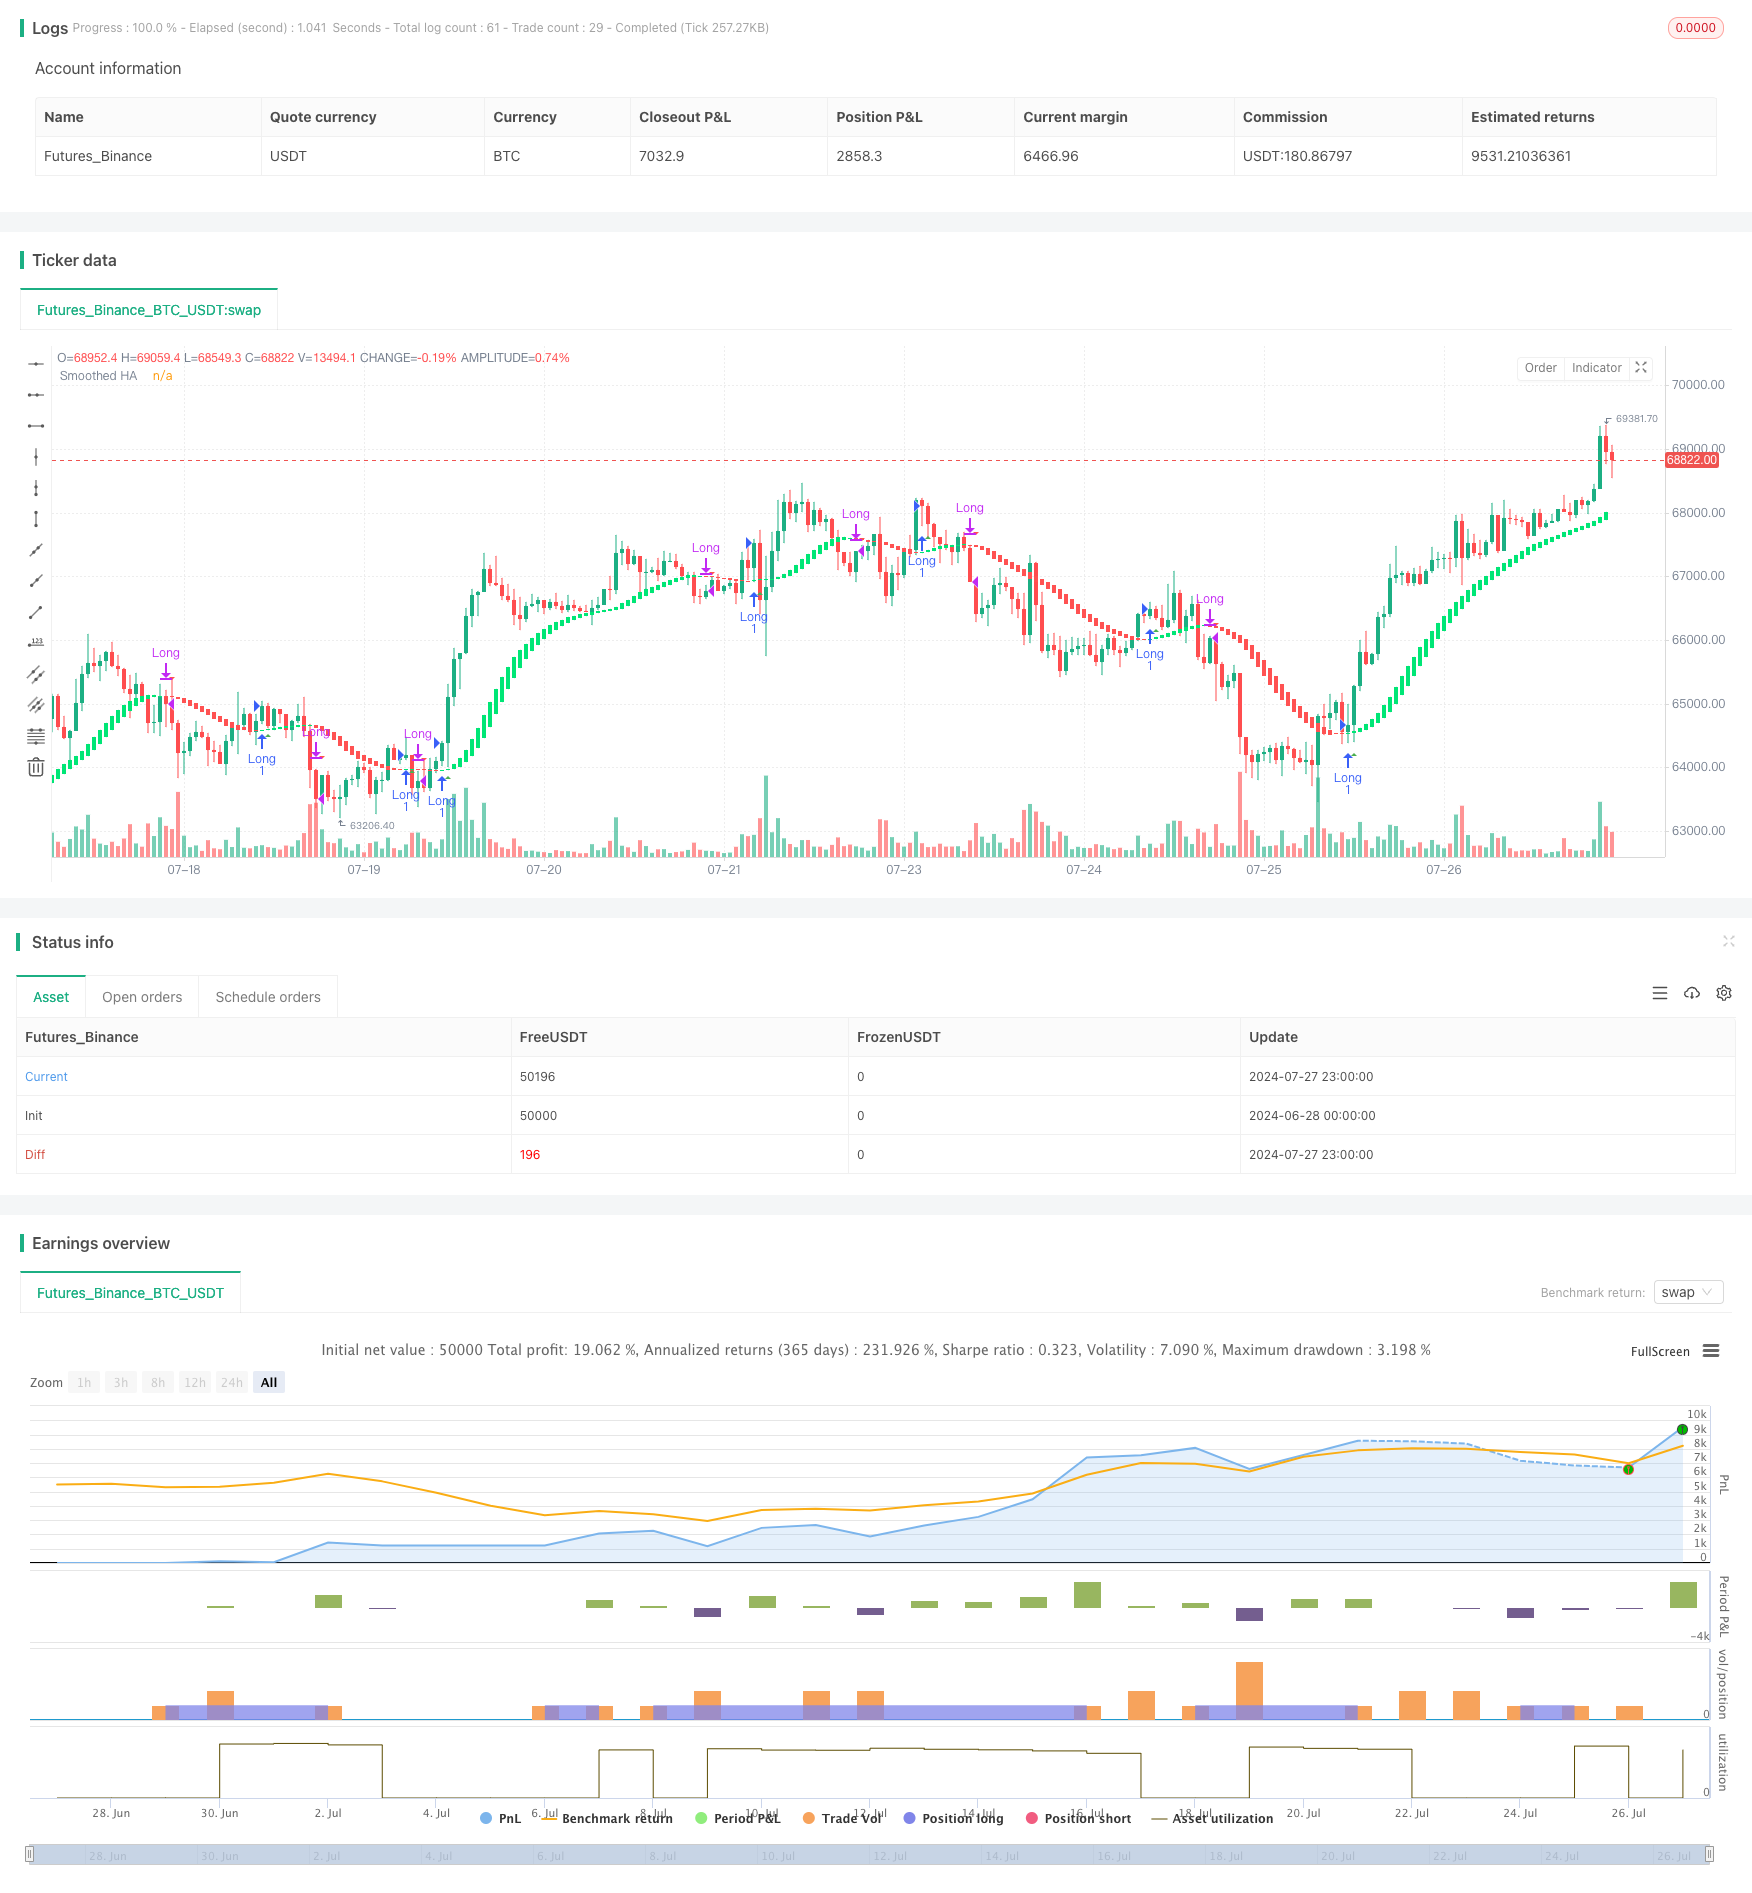
[trans]
概述
双重平滑海肯阿希趋势跟随策略是一种专注于捕捉市场上涨趋势的量化交易方法。该策略结合了改良版的海肯阿希蜡烛图技术和指数移动平均线(EMA)的双重平滑处理,旨在提供更清晰的趋势信号,同时减少市场噪音的影响。这种方法特别适用于具有持续性强劲趋势的市场环境,能够帮助交易者更好地把握长期上涨行情。
策略原理
-
海肯阿希改良: 策略首先计算海肯阿希蜡烛图,但与传统方法不同,它使用开盘价、最高价、最低价和收盘价的指数移动平均线(EMA)来构建改良版海肯阿希蜡烛。
-
双重平滑处理: 策略应用了两层平滑处理。第一层是在计算海肯阿希值时使用EMA,第二层是对海肯阿希的开盘价和收盘价再次应用EMA。这种双重平滑旨在进一步减少市场噪音,提供更清晰的趋势信号。
-
仅做多策略: 该策略专注于捕捉上涨趋势,只进行做多交易。在下跌趋势中,策略会平掉现有的多头头寸,而不会做空。
-
入场和出场条件:
- 入场(买入): 当平滑处理后的海肯阿希蜡烛图颜色从红色变为绿色时(表示潜在上涨趋势的开始)。
- 出场(卖出): 当平滑处理后的海肯阿希蜡烛图颜色从绿色变为红色时(表示潜在上涨趋势的结束)。
-
可视化辅助: 策略在图表上绘制修改后的海肯阿希蜡烛图,下跌趋势用红色表示,上涨趋势用绿色表示。同时,策略还会在图表上显示三角形标记,用于标示买入和卖出信号,这些标记会在蜡烛线收盘后出现,以确保信号的可靠性。
-
仓位管理: 策略采用基于账户权益百分比的仓位管理方法,默认每笔交易使用100%可用权益。
策略优势
-
趋势跟随能力强: 通过使用改良版海肯阿希蜡烛图和双重平滑处理,该策略能够有效识别和跟随强劲的市场趋势,特别适合于trending市场。
-
降低噪音影响: 双重平滑处理有助于过滤掉短期市场波动和假突破,使得趋势信号更加清晰可靠。
-
视觉直观: 策略提供了清晰的视觉指示,包括颜色编码的蜡烛图和买卖信号标记,使得交易者能够快速判断市场状态和潜在交易机会。
-
灵活性高: 策略允许用户调整EMA长度参数,可以根据不同的交易品种和时间周期进行优化。
-
风险管理: 通过仅做多策略和基于权益百分比的仓位管理,策略内置了一定的风险控制机制。
-
自动化交易: 策略可以轻松实现自动化交易,减少人为情绪干扰,提高执行效率。
策略风险
-
滞后性: 由于使用了双重平滑处理,策略可能在趋势转折点反应较慢,导致入场和出场时机略有滞后。
-
震荡市表现欠佳: 在横盘震荡或缺乏明确趋势的市场环境中,策略可能会产生频繁的假信号,导致过度交易和不必要的损失。
-
单一方向风险: 作为仅做多策略,在持续下跌的市场中可能会错过潜在的做空机会,影响整体收益。
-
过度依赖单一指标: 策略主要依赖海肯阿希蜡烛图和EMA,缺乏其他技术指标或基本面分析的补充,可能会忽视市场的其他重要信息。
-
参数敏感性: 策略性能可能对EMA长度参数的选择较为敏感,不同市场条件下可能需要频繁调整。
-
回撤风险: 在强劲上涨后的急剧回调中,策略可能无法及时止损,导致较大回撤。
策略优化方向
-
引入额外指标: 考虑增加其他技术指标,如相对强弱指数(RSI)或移动平均线收敛散度指标(MACD),以提供额外的趋势确认和潜在的超买超卖信号。
-
优化入场和出场逻辑: 可以尝试引入更复杂的条件,如要求连续几根蜡烛线确认趋势变化,或者结合成交量信息来增强信号的可靠性。
-
动态参数调整: 实现自适应EMA长度,根据市场波动性自动调整平滑参数,以适应不同的市场环境。
-
增加止损和止盈机制: 引入跟踪止损或基于波动率的动态止损,以更好地控制风险和锁定利润。
-
加入市场状态过滤: 开发一个市场状态识别模块,在震荡市中自动降低交易频率或暂停交易,以减少假信号。
-
多时间周期分析: 结合更长和更短的时间周期信息,以提高趋势判断的准确性和及时性。
-
整合基本面数据: 考虑引入相关的基本面指标或事件驱动因素,以增强策略的全面性。
-
优化仓位管理: 实现更灵活的仓位管理策略,如基于风险值的头寸规模调整或分批建仓技术。
总结
双重平滑海肯阿希趋势跟随策略是一种创新的量化交易方法,通过结合改良版海肯阿希蜡烛图技术和双重EMA平滑处理,为交易者提供了一种独特的趋势跟随工具。该策略的主要优势在于其强大的趋势捕捉能力和降噪效果,特别适合于具有明确趋势的市场环境。
然而,策略也存在一些固有的风险和局限性,如信号滞后、在震荡市中表现欠佳等。为了充分发挥策略的潜力并管理相关风险,交易者应该考虑进一步优化和完善策略,如引入额外的技术指标、优化入场出场逻辑、实现动态参数调整等。
总的来说,双重平滑海肯阿希趋势跟随策略为量化交易领域提供了一个有价值的研究方向。通过不断的回测、优化和实盘验证,该策略有潜力成为一个可靠的交易系统组件。然而,交易者在使用该策略时,仍需谨慎考虑市场条件、个人风险承受能力,并将其与其他分析工具和风险管理技术结合使用,以构建一个全面、稳健的交易策略。
||
Overview
The Double-Smoothed Heiken Ashi Trend Following Strategy is a quantitative trading approach focused on capturing upward market trends. This strategy combines a modified version of Heiken Ashi candlestick technique with double smoothing using Exponential Moving Averages (EMAs), aiming to provide clearer trend signals while reducing market noise. This method is particularly suitable for market environments with strong, sustained trends, helping traders better capture long-term bullish movements.
Strategy Principles
-
Heiken Ashi Modification: The strategy begins by calculating Heiken Ashi candlesticks, but unlike the traditional method, it uses Exponential Moving Averages (EMAs) of open, high, low, and close prices to construct the modified Heiken Ashi candles.
-
Double Smoothing Process: The strategy applies two layers of smoothing. The first layer uses EMAs in calculating Heiken Ashi values, and the second layer applies another EMA to the Heiken Ashi open and close prices. This double smoothing aims to further reduce market noise and provide clearer trend signals.
-
Long-Only Strategy: The strategy focuses on capturing upward trends, only engaging in long trades. During downward trends, the strategy closes existing long positions rather than taking short positions.
-
Entry and Exit Conditions:
- Entry (Buy): When the color of the smoothed Heiken Ashi candlestick changes from red to green (indicating the potential start of an uptrend).
- Exit (Sell): When the color of the smoothed Heiken Ashi candlestick changes from green to red (indicating the potential end of an uptrend).
-
Visual Aids: The strategy plots modified Heiken Ashi candlesticks on the chart, with red representing downtrends and green representing uptrends. Additionally, the strategy displays triangle-shaped markers on the chart to indicate buy and sell signals, appearing after the candle closes to ensure signal reliability.
-
Position Management: The strategy employs a position sizing method based on account equity percentage, defaulting to 100% of available equity per trade.
Strategy Advantages
-
Strong Trend Following Capability: By using modified Heiken Ashi candlesticks and double smoothing, the strategy can effectively identify and follow strong market trends, especially suitable for trending markets.
-
Reduced Noise Impact: The double smoothing process helps filter out short-term market fluctuations and false breakouts, making trend signals clearer and more reliable.
-
Visual Intuitiveness: The strategy provides clear visual indications, including color-coded candlesticks and buy/sell signal markers, allowing traders to quickly assess market conditions and potential trading opportunities.
-
High Flexibility: The strategy allows users to adjust EMA length parameters, enabling optimization for different trading instruments and time frames.
-
Risk Management: Through its long-only approach and equity percentage-based position sizing, the strategy incorporates certain risk control mechanisms.
-
Automated Trading: The strategy can be easily implemented for automated trading, reducing emotional interference and improving execution efficiency.
Strategy Risks
-
Lag: Due to the use of double smoothing, the strategy may react slowly at trend reversal points, leading to slightly delayed entries and exits.
-
Poor Performance in Ranging Markets: In sideways or trendless market environments, the strategy may generate frequent false signals, resulting in overtrading and unnecessary losses.
-
Single Direction Risk: As a long-only strategy, it may miss potential short-selling opportunities in consistently declining markets, affecting overall returns.
-
Over-reliance on Single Indicator: The strategy primarily relies on Heiken Ashi candlesticks and EMAs, lacking supplementary technical indicators or fundamental analysis, which may overlook other important market information.
-
Parameter Sensitivity: Strategy performance may be sensitive to the choice of EMA length parameters, potentially requiring frequent adjustments under different market conditions.
-
Drawdown Risk: In sharp corrections following strong uptrends, the strategy may not be able to cut losses in time, leading to significant drawdowns.
Strategy Optimization Directions
-
Introduce Additional Indicators: Consider adding other technical indicators such as Relative Strength Index (RSI) or Moving Average Convergence Divergence (MACD) to provide additional trend confirmation and potential overbought/oversold signals.
-
Optimize Entry and Exit Logic: Experiment with more complex conditions, such as requiring several consecutive candles to confirm trend changes, or incorporating volume information to enhance signal reliability.
-
Dynamic Parameter Adjustment: Implement adaptive EMA lengths that automatically adjust smoothing parameters based on market volatility to adapt to different market environments.
-
Add Stop Loss and Take Profit Mechanisms: Introduce trailing stops or volatility-based dynamic stop losses to better control risk and lock in profits.
-
Incorporate Market State Filtering: Develop a market state identification module to automatically reduce trading frequency or pause trading in ranging markets to minimize false signals.
-
Multi-Timeframe Analysis: Combine information from longer and shorter time frames to improve the accuracy and timeliness of trend judgments.
-
Integrate Fundamental Data: Consider incorporating relevant fundamental indicators or event-driven factors to enhance the strategy's comprehensiveness.
-
Optimize Position Management: Implement more flexible position management strategies, such as risk-based position sizing adjustments or scaling-in techniques.
Conclusion
The Double-Smoothed Heiken Ashi Trend Following Strategy is an innovative quantitative trading method that provides traders with a unique trend-following tool by combining modified Heiken Ashi candlestick technique with double EMA smoothing. The strategy's main advantages lie in its powerful trend capture capability and noise reduction effect, particularly suitable for market environments with clear trends.
However, the strategy also has inherent risks and limitations, such as signal lag and poor performance in ranging markets. To fully leverage the strategy's potential and manage associated risks, traders should consider further optimizing and refining the strategy, such as introducing additional technical indicators, optimizing entry and exit logic, and implementing dynamic parameter adjustments.
Overall, the Double-Smoothed Heiken Ashi Trend Following Strategy offers a valuable research direction in the field of quantitative trading. Through continuous backtesting, optimization, and live trading verification, this strategy has the potential to become a reliable component of a trading system. However, when using this strategy, traders should still carefully consider market conditions, personal risk tolerance, and combine it with other analytical tools and risk management techniques to build a comprehensive and robust trading strategy.
[/trans]
Source (PineScript)
/*backtest
start: 2024-06-28 00:00:00
end: 2024-07-28 00:00:00
period: 1h
basePeriod: 15m
exchanges: [{"eid":"Futures_Binance","currency":"BTC_USDT"}]
*/

//@version=5
strategy("Smoothed Heiken Ashi Strategy Long Only", overlay=true)

len = input.int(10, title="EMA Length")
len2 = input.int(10, title="Smoothing Length")

o = ta.ema(open, len)
c = ta.ema(close, len)
h = ta.ema(high, len)
l = ta.ema(low, len)
haclose = (o + h + l + c) / 4

var float haopen = 0.0
haopen := na(haopen[1]) ? (o + c) / 2 : (haopen[1] + haclose[1]) / 2
hahigh = math.max(h, math.max(haopen, haclose))
halow = math.min(l, math.min(haopen, haclose))

o2 = ta.ema(haopen, len2)
c2 = ta.ema(haclose, len2)
col = o2 > c2 ? 0 : 1 // 0 for red, 1 for lime

// Plotting candles without wicks
plotcandle(o2, o2, c2, c2, title="Smoothed HA", color=col == 0 ? color.red : color.lime)

// Strategy logic
longEntryCondition = col == 1 and col[1] == 0
longExitCondition = col == 0 and col[1] == 1

if (longEntryCondition)
    strategy.entry("Long", strategy.long)

if (longExitCondition)
    strategy.close("Long")

// Plotting signals after the close of the candle
plotshape(longEntryCondition, title="Buy Signal", location=location.belowbar, color=color.green, style=shape.triangleup, size=size.small, offset=1)
plotshape(longExitCondition, title="Sell Signal", location=location.abovebar, color=color.red, style=shape.triangledown, size=size.small, offset=1)
Detail
https://www.fmz.com/strategy/458058
Last Modified
2024-07-29 16:02:27