
9.8 KiB
Name
双重均线反转和三重最低闪现的组合交易策略Dual-Moving-Average-Reversal-and-Triple-Bottom-Flash-Combo-Trading-Strategy
Author
ChaoZhang
Strategy Description
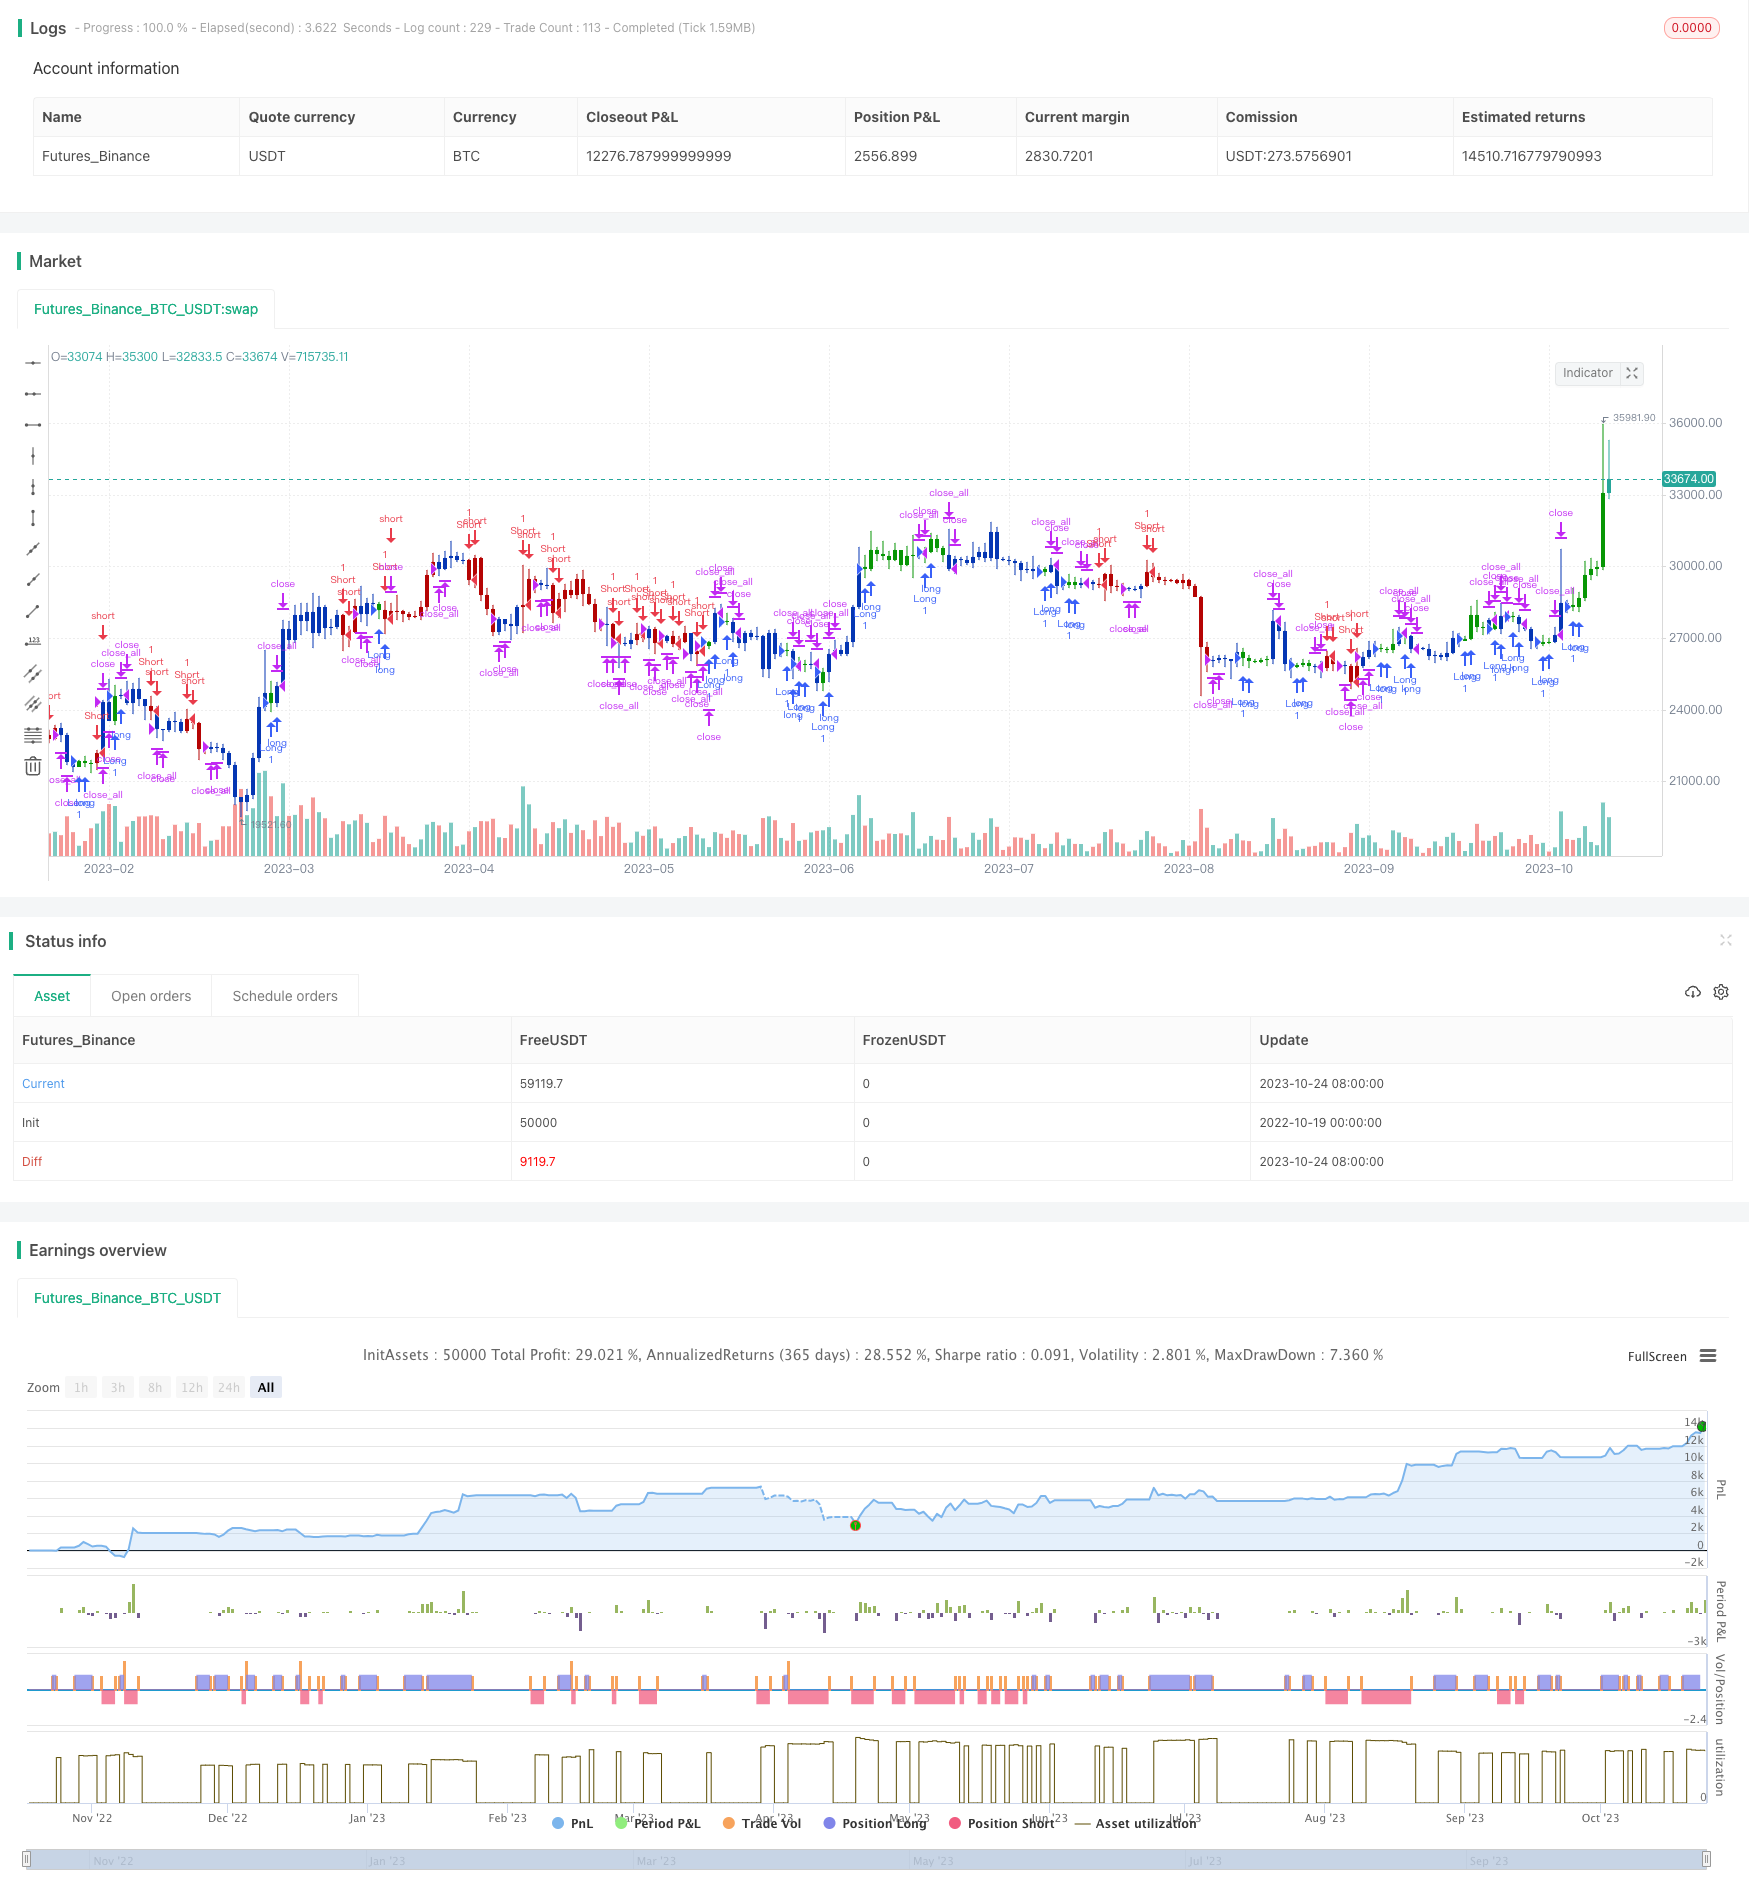
[trans]
概述
该交易策略充分利用均线反转和三日最低闪现两种技术指标的优势,进行组合运用,在追踪趋势的同时及时捕捉反转机会,过滤掉一些假突破信号,可以有效提高交易系统的胜率。
策略原理
该策略由两部分组成:
-
2日均线和20日均线的组合。当2日均线和20日均线产生背离时,出现买卖信号。
-
三日最低闪现形态。该形态出现是短期反转的信号。形成的条件是:中间一日最低,比前一日和后一日都要低,而后一日收盘价高于前一日最高价。
当2日均线和20日均线同时显示反转信号,且与三日最低闪现形态的信号方向一致时,采取买入或卖出操作。
代码中,首先计算出2日均线和20日均线。当2日均线上穿或下穿20日均线时,产生买入/卖出信号。
然后检测到三日最低闪现形态时,设置形态方向信号为1或-1。读取前一日的形态信号,与当前均线信号进行组合,产生最终入场信号。
这样,通过均线和形态的组合筛选,可以过滤掉一些假信号,使交易策略更为可靠。
策略优势
-
组合多个技术指标,可以起到互补和验证的作用,提高信号的可靠性。
-
均线反转可以及时捕捉趋势反转点,利用反转的机会。三日最低闪现可以进一步确认反转形成。
-
20日均线追踪中长期趋势,2日均线用于捕捉短期调整后的入场时点。多时间范围的组合可以全面把握趋势。
-
该策略对参数不敏感,容易实现和优化。
策略风险
-
反转形态容易形成误判,需要积累经验判断其可靠性。
-
反转信号可能出现滞后,需要观察形态特征,适当调整持仓。
-
需要对交易品种进行测试优化,部分品种参数设置可能需要调整。
-
回撤控制需要引入止损机制,避免错过重要反转点。
策略优化
-
测试不同均线组合,选取对品种作用最好的均线参数。
-
引入其他辅助指标,如成交量,布林带等,进行多指标验证。
-
加入止损模块,以控制回撤和风险。
-
优化入场时机,避免出现过早或过晚的问题。
-
针对特定品种进行参数优化,提高适应性。
总结
该策略充分利用均线反转和短期形态的优势,实现两者的有效组合,可以提高交易系统的稳定性和胜率。但需要注意风险控制,并进行参数测试和优化,以适应不同品种的特点。总体来说,该策略结构简单清晰,易于实现,是一种实用性强的趋势反转交易策略。
||
Overview
This trading strategy makes full use of the advantages of moving average reversal and triple bottom flash technical indicators for combo application. It captures reversal opportunities while tracking the trend, filtering out some false breakout signals, and can effectively improve the win rate of trading systems.
Strategy Principles
The strategy consists of two parts:
-
Combination of 2-day and 20-day moving averages. Buy and sell signals are generated when the 2-day moving average diverges from the 20-day moving average.
-
Triple bottom flash pattern. The emergence of this pattern is a signal for short-term reversal. The forming condition is: the lowest of the middle day is lower than the previous and the next day, and the closing price of the next day is higher than the highest of the previous day.
When the 2-day and 20-day moving averages simultaneously show reversal signals, and are consistent with the direction of the triple bottom flash pattern signal, take buy or sell actions.
In the code, the 2-day and 20-day moving averages are calculated first. When the 2-day moving average breaks through the 20-day moving average up or down, buy/sell signals are generated.
When the triple bottom flash pattern is detected, the pattern direction signal is set to 1 or -1. Read the pattern signal of the previous day, combine it with the current moving average signal, and generate the final entry signal.
Thus, by filtering with the combination of moving averages and patterns, some false signals can be filtered out, making the trading strategy more reliable.
Advantages
-
The combination of multiple technical indicators can complement and verify each other and improve signal reliability.
-
Moving average reversal can capture reversal points of trends in a timely manner and take advantage of reversals. The triple bottom flash can further confirm the reversal formation.
-
The 20-day moving average tracks the medium and long term trends, and the 2-day moving average captures entry points after short-term adjustments. The combination of multiple time frames can fully grasp the trend.
-
The strategy is not sensitive to parameters and is easy to implement and optimize.
Risks
-
Reversal patterns are prone to misjudgment and experience is needed to judge their reliability.
-
Reversal signals may lag, requiring observation of pattern features and appropriate position adjustment.
-
Testing and optimization are needed for different trading varieties, and some parameters may need to be adjusted.
-
Loss control needs to introduce a stop loss mechanism to avoid missing important reversal points.
Optimization
-
Test different moving average combinations to select the best parameters for the variety.
-
Introduce other auxiliary indicators such as volume, Bollinger Bands, etc. for multi-indicator verification.
-
Add a stop loss module to control drawdowns and risks.
-
Optimize entry timing to avoid premature or late problems.
-
Perform parameter optimization for specific varieties to improve adaptability.
Summary
The strategy makes full use of the advantages of moving average reversal and short-term patterns to achieve effective combination of both, which can improve the stability and win rate of trading systems. But risk control, parameter testing and optimization are needed to adapt to the characteristics of different varieties. Overall, the strategy has a simple and clear structure that is easy to implement and is a practical trend reversal trading strategy.
[/trans]
Strategy Arguments
| Argument | Default | Description |
|---|---|---|
| v_input_1 | 14 | (?●═════ 2/20 EMA ═════●)Length |
| v_input_2 | false | (?●═════ MISC ═════●)Trade reverse |
| v_input_3 | true | (?●═════ Time Start ═════●)From Day |
| v_input_4 | true | From Month |
| v_input_5 | 2005 | From Year |
Source (PineScript)
/*backtest
start: 2022-10-19 00:00:00
end: 2023-10-25 00:00:00
period: 1d
basePeriod: 1h
exchanges: [{"eid":"Futures_Binance","currency":"BTC_USDT"}]
*/

//@version=4
////////////////////////////////////////////////////////////
//  Copyright by HPotter v1.0 25/12/2021
// This is combo strategies for get a cumulative signal.
//
// First strategy
// This indicator plots 2/20 exponential moving average. For the Mov
// Avg X 2/20 Indicator, the EMA bar will be painted when the Alert criteria is met.
//
// Second strategy
// This startegy based on 3-day pattern reversal described in "Are Three-Bar
// Patterns Reliable For Stocks" article by Thomas Bulkowski, presented in
// January,2000 issue of Stocks&Commodities magazine.
// That pattern conforms to the following rules:
// - It uses daily prices, not intraday or weekly prices;
// - The middle day of the three-day pattern has the lowest low of the three days, with no ties allowed;
// - The last day must have a close above the prior day's high, with no ties allowed;
// - Each day must have a nonzero trading range.
//
// WARNING:
// - For purpose educate only
// - This script to change bars colors.
////////////////////////////////////////////////////////////
EMA20(Length ) =>
    pos = 0.0
    xPrice = close
    xXA = ema(xPrice, Length)
    nHH = max(high, high[1])
    nLL = min(low, low[1])
    nXS = iff((nLL > xXA)or(nHH < xXA), nLL, nHH)
    pos := iff(nXS > close[1] , -1, iff(nXS < close[1] , 1, nz(pos[1], 0)))
	pos

BarR()=>
    pos = 0.0
    pos :=	iff(open[2] > close[2] and high[1] < high[2] and low[1] < low[2] and low[0] > low[1] and high[0] > high[1], 1,
    	     iff(open[2] < close[2] and high[1] > high[2] and low[1] > low[2] and high[0] < high[1] and low[0] < low[1], -1, nz(pos[1], 0)))
    pos

strategy(title="Combo 2/20 EMA & 3 Day Pattern", shorttitle="Combo", overlay = true)
var I1  = "●═════ 2/20 EMA ═════●"
Length = input(14, minval=1, group = I1)
//var I2  = "●═════ 3-Bar-Reversal-Pattern ═════●"
var misc  = "●═════ MISC ═════●"
reverse = input(false, title="Trade reverse", group = misc)
var timePeriodHeader  = "●═════ Time Start ═════●"
d = input(1, title="From Day", minval=1, maxval=31, group=timePeriodHeader)
m = input(1, title="From Month", minval=1, maxval=12, group=timePeriodHeader)
y = input(2005, title="From Year", minval=0, group=timePeriodHeader)

StartTrade = true
prePos3Bar = BarR()

posEMA20 = EMA20(Length)
pos3BarR = security(syminfo.tickerid, "D", prePos3Bar[1], barmerge.gaps_off, barmerge.lookahead_on)
pos = iff(posEMA20 == 1 and pos3BarR == 1 and StartTrade , 1,
	   iff(posEMA20 == -1 and pos3BarR == -1 and StartTrade, -1, 0))
possig = iff(reverse and pos == 1, -1,
          iff(reverse and pos == -1 , 1, pos))
if (possig == 1 )
    strategy.entry("Long", strategy.long)
if (possig == -1 )
    strategy.entry("Short", strategy.short)
if (possig == 0)
    strategy.close_all()
barcolor(possig == -1 ? #b50404: possig == 1 ? #079605 : #0536b3 )
Detail
https://www.fmz.com/strategy/430264
Last Modified
2023-10-26 16:26:24