
12 KiB
Name
双重均线偏差配合ATR指标的趋势跟随策略Dual-Moving-Average-Deviation-Combined-with-ATR-Indicator-Trend-Following-Strategy
Author
ChaoZhang
Strategy Description
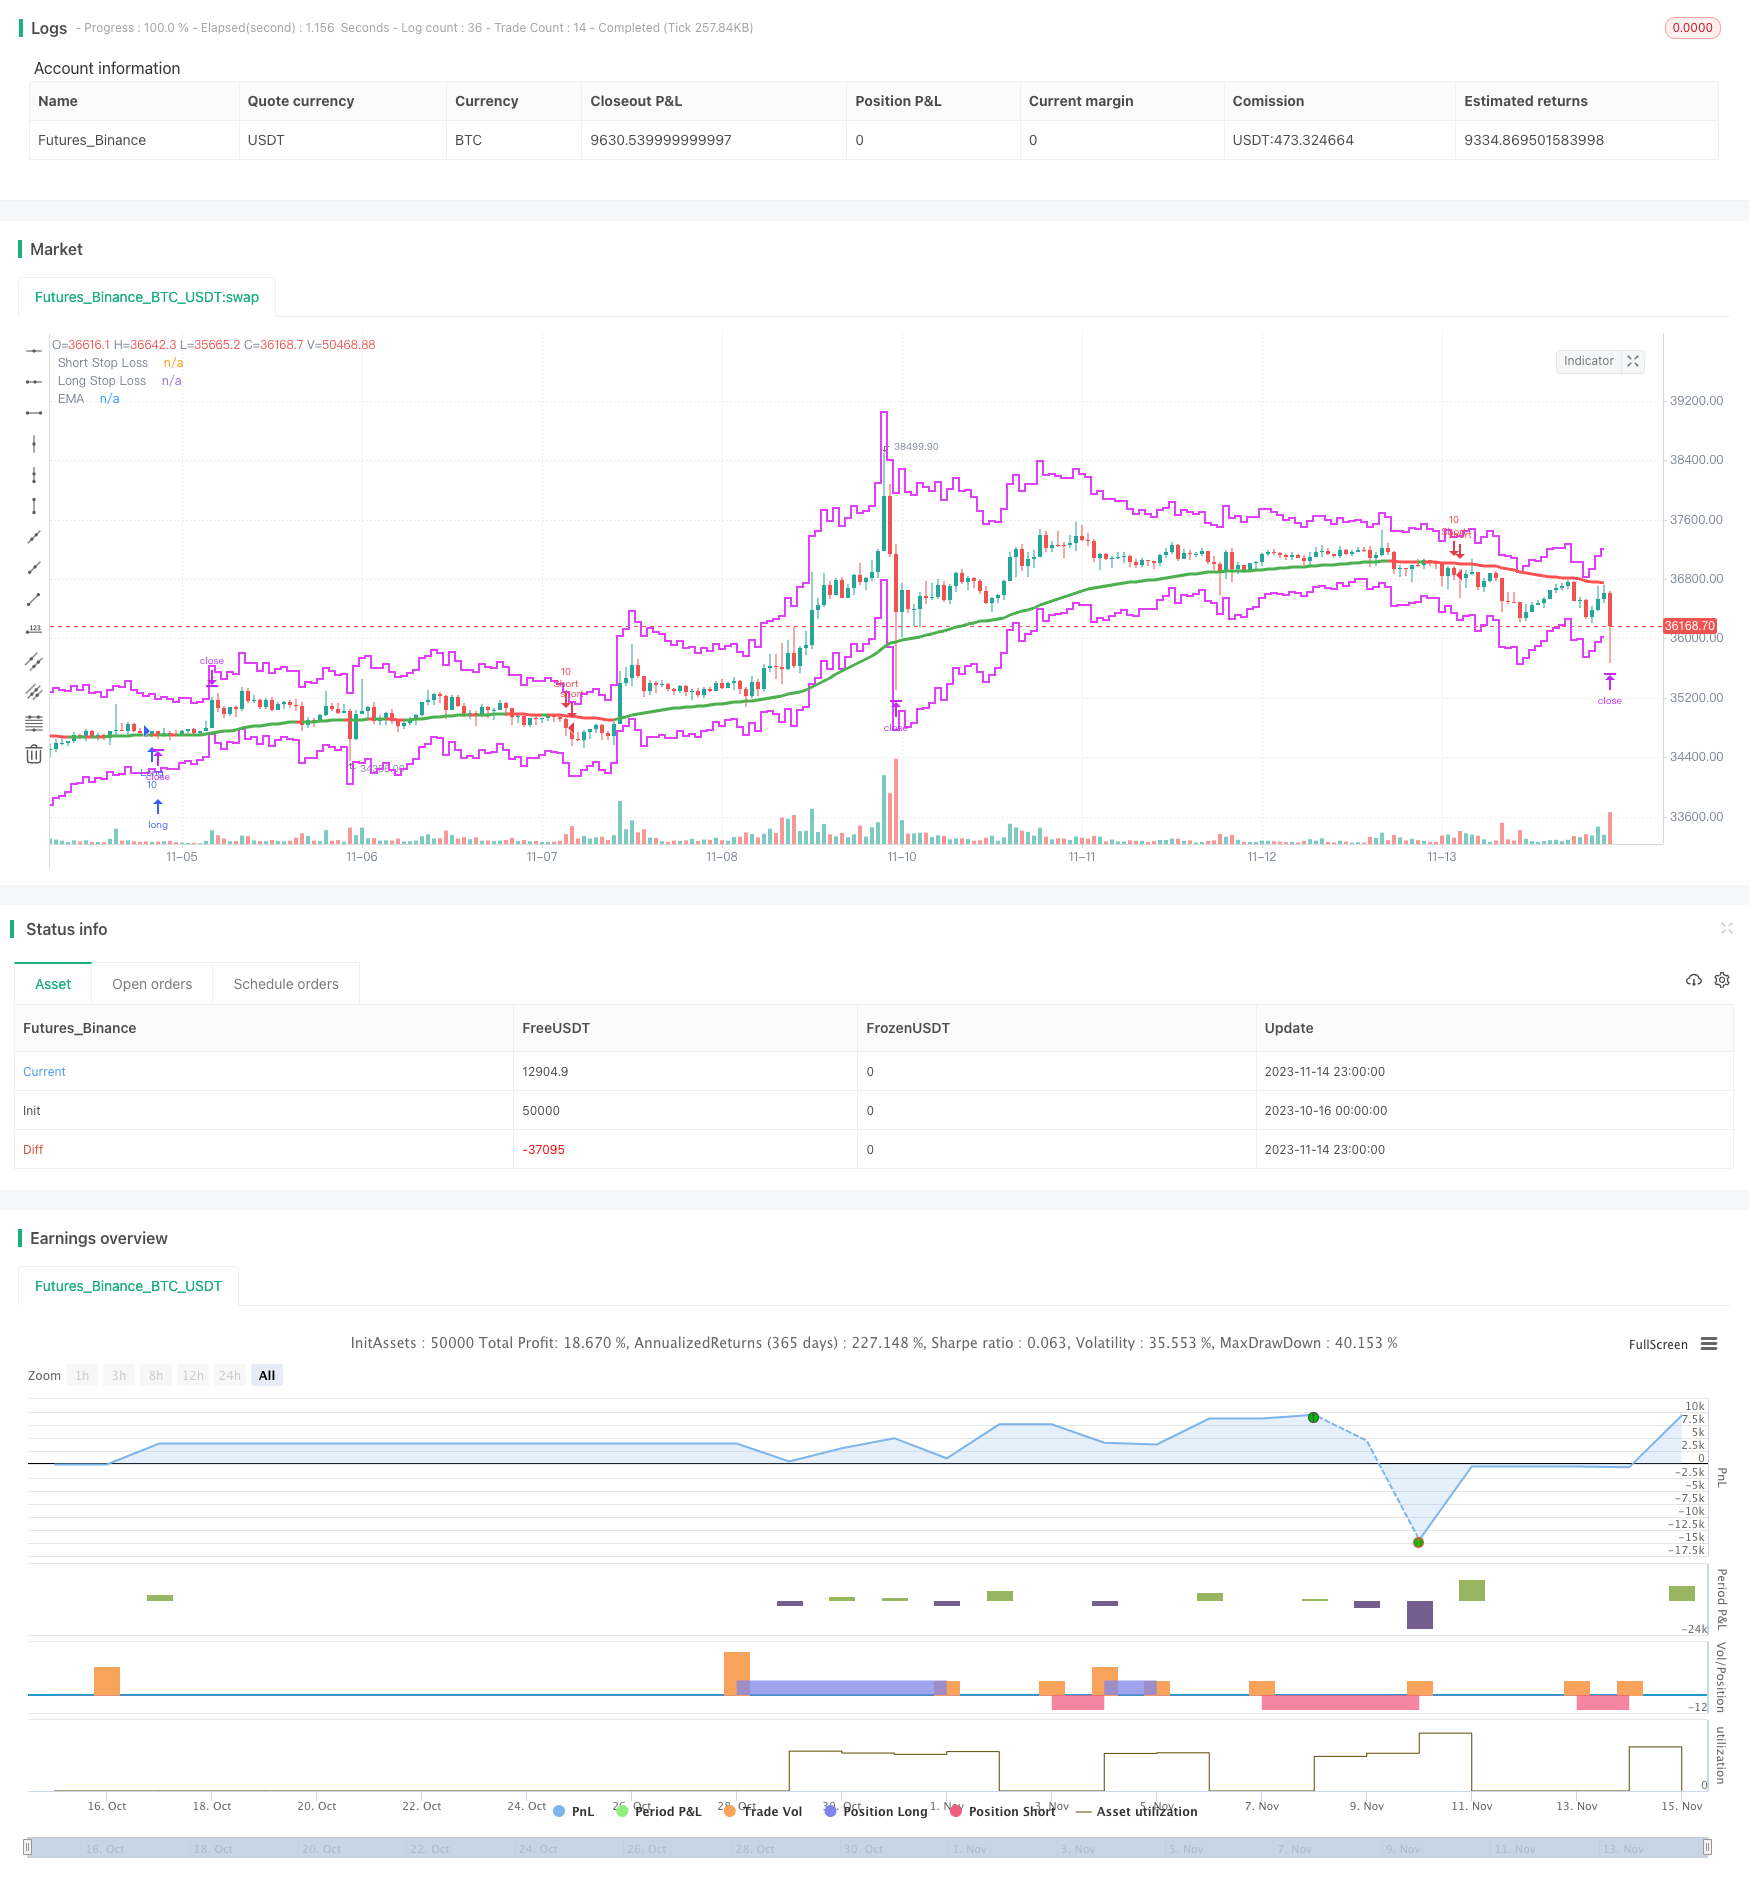 [trans]
概述
该策略运用双重EMA均线的金叉、死叉形成信号,配合ATR指标判断市场波动率,实现低买高卖的趋势跟随策略。当快线金叉慢线,且ATR指标低于前一日时视为多头信号做多;当快线死叉慢线,且ATR指标高于前一日时视为空头信号做空。
策略原理
-
使用长度为20和55的双重EMA均线。当快线上穿慢线产生金叉时,视为多头信号;当快线下穿慢线产生死叉时,视为空头信号。
-
使用长度为14的ATR指标。ATR指标能反映市场的波动率和风险程度。当ATR低于前一日时,表示市场波动减弱,适合介入做多;当ATR高于前一日时,表示市场波动加大,适合介入做空。
-
只在快线金叉慢线且ATR低于前一日时做多;只在快线死叉慢线且ATR高于前一日时做空。避免在市场波动较大时轻易介入。
-
ATR指标还被用来设置止损位和止盈位。止损位为当前价减去ATR乘以止损倍数;止盈位为当前价加上ATR乘以止盈倍数。
-
止损倍数默认为3倍ATR,止盈倍数默认为3倍ATR。这使止损位和止盈位都能动态跟随市场波动。
策略优势
-
使用双重均线系统,能对多空状态判断提供较强确认。避免被市场常有的假突破误导。
-
ATR指标的引入,使策略只在低波动时介入,能过滤掉许多假信号,减少系统风险。
-
ATR动态止损止盈能使止损止盈随市场波动水平设定。避免止损太近或止盈过浅。
-
可设置是否采用均线交叉作为附加退出机制。可进一步优化系统的盈亏结果。
-
可根据ATR设定动态的止损和止盈水平,更符合趋势交易逻辑,止损不会过于敏感,止盈也不会过于宽松。
策略风险
-
双均线系统判断信号存在一定滞后。可能错过较强的短期趋势。
-
高波动时,ATR会上升,可能错过介入时机。应适当调整ATR参数。
-
长期持仓时,止损位可能会过于靠近,应结合趋势力度适当放宽。
-
均线系统对曲折盘整场景判断效果较差。应配合其它指标进行确认。
-
ATR参数应根据不同品种不同周期进行调整。参数选取不当会影响系统损益。
策略优化方向
-
可测试不同长度参数的均线组合,寻找更匹配该品种趋势特征的均线参数。
-
可以引入MACD,KD等其他指标,对均线交叉信号进行确认,提高 Entscheidungssicherheit。
-
可以通过回测优化ATR参数,使其更符合该品种的波动平稳特性。
-
可设置ATR倍数因子为可调变量,根据趋势强弱程度动态调整止盈止损位置。
-
可以结合趋势强度指标,在趋势不强时降低止损要求,在趋势强劲时增加止盈要求。
总结
该策略整合双EMA均线的趋势判断和ATR波动率指标的风险控制,形成了一个较完整的趋势跟随体系。策略优化的重点是调整均线和ATR参数使其更符合品种特性,以及设计动态止盈止损机制来跟随趋势强度变化。通过参数优化和逻辑优化,该策略可以成为一个优秀的趋势跟随策略。
||
Overview
This strategy uses the golden cross and dead cross signals formed by dual EMA moving averages, combined with the ATR indicator to judge market volatility, to implement a low-buying-high-selling trend following strategy. When the fast line crosses above the slow line, and the ATR indicator is lower than the previous day, it is considered a bullish signal to go long. When the fast line crosses below the slow line, and the ATR indicator is higher than the previous day, it is considered a bearish signal to go short.
Strategy Logic
-
Use dual EMA moving averages of length 20 and 55. When the fast line crosses above the slow line and generates a golden cross, it is considered a bullish signal. When the fast line crosses below the slow line and generates a dead cross, it is considered a bearish signal.
-
Use ATR indicator of length 14. The ATR indicator reflects the volatility and risk level of the market. When the ATR is lower than the previous day, it indicates that market volatility is weakening and it is suitable to go long. When the ATR is higher than the previous day, it indicates that market volatility is increasing and it is suitable to go short.
-
Only go long when the fast line golden crosses the slow line and the ATR is lower than the previous day. Only go short when the fast line dead crosses the slow line and the ATR is higher than the previous day. This avoids intervene when market volatility is high.
-
The ATR indicator is also used to set stop loss and take profit levels. The stop loss is set at current price minus ATR multiplied by the stop loss multiplier. The take profit is set at current price plus ATR multiplied by the take profit multiplier.
-
The default stop loss multiplier is 3xATR and the default take profit multiplier is 3xATR. This allows the stop loss and take profit to dynamically follow market volatility.
Advantages of the Strategy
-
Using a dual moving average system provides stronger confirmation of long/short status. It avoids being misled by false breakouts that frequently occur in the market.
-
Introducing the ATR indicator allows the strategy to only engage when volatility is low. This filters out many false signals and reduces system risk.
-
The dynamic ATR stop loss/take profit allows the stops and targets to be set according to market volatility level. This prevents stops being too close or targets being too shallow.
-
It is possible to set moving average crossover as an additional exit mechanism. This can further optimize the system's profitability.
-
Dynamic stop loss and take profit levels based on ATR fit better with the trend trading logic. The stop loss is not too sensitive and the take profit is not too loose.
Risks of the Strategy
-
Dual moving averages have some lag in signals. This may miss stronger short-term trends.
-
When volatility is high, ATR rises and may miss entry opportunities. ATR parameters need to be adjusted accordingly.
-
For long holding periods, the stop loss may get too close. It needs to be relaxed according to the trend strength.
-
Moving averages perform poorly in choppy ranging markets. Other indicators are needed for confirmation.
-
ATR parameters need to be adjusted for different products and timeframes. Incorrect parameters will negatively impact performance.
Improvement Areas
-
Test different length moving average combinations to find parameters that match the trend characteristics of the product.
-
Incorporate other indicators like MACD, KD to confirm moving average crossover signals and improve Entscheidungssicherheit.
-
Optimize ATR parameters through backtesting to better match the volatility characteristics of the product.
-
Make the ATR multiplier factor adjustable to dynamically adjust stop loss/take profit according to trend strength.
-
Incorporate a trend strength indicator to reduce stop loss requirements in weak trends, and increase take profit in strong trends.
Summary
This strategy integrates the trend判断 of dual EMAs and the risk control of the ATR volatility indicator to form a relatively complete trend following system. The focus for optimization is adjusting the moving average and ATR parameters to match the product characteristics, and designing dynamic stop loss/take profit mechanisms to follow changes in trend strength. With parameter and logic optimization, this strategy can become an excellent trend following strategy.
[/trans]
Strategy Arguments
| Argument | Default | Description |
|---|---|---|
| v_input_1 | 20 | Fast Moving Average |
| v_input_2 | 55 | Slow Moving Average |
| v_input_3_close | 0 | Source: close |
| v_input_4 | 14 | ATR Length |
| v_input_5 | 3 | Stop Loss Multiple |
| v_input_6 | 3 | Take Profit Multiple |
| v_input_7 | true | Plot EMA? |
| v_input_8 | false | Exit with Slow MA Crossover? |
| v_input_9 | true | Exit with ATR? |
Source (PineScript)
/*backtest
start: 2023-10-16 00:00:00
end: 2023-11-15 00:00:00
period: 1h
basePeriod: 15m
exchanges: [{"eid":"Futures_Binance","currency":"BTC_USDT"}]
*/

//@version=4
// **********************************************
// PtahX EMA/ATR Strategy Public Release
// EMA Strategy with ATR & "Fear Factor" built in
// written by PtahX October 2019
// * modifications welcome
// * please let me know if you improve it so I can continue to learn :)
// * use at your own risk - I'm a new programmer and still learning
// * Best of luck on your trades!!

// Take Profit (TP) option based on ATR or MA Crossover
//***********************************************

strategy(title="PtahX EMA/ATR Strategy", overlay=true, pyramiding=1, calc_on_every_tick=true, default_qty_value=1, initial_capital=10000, slippage=2)

//*****************************
// Global Inputs
//*****************************

fastMA = input(title="Fast Moving Average", defval=20, step=1)
slowMA = input(title="Slow Moving Average", defval=55, step=1)
source = input(close, title="Source")
atrLength = input(title="ATR Length", defval=14, minval=7, step=1)
slMultiplier = input(title="Stop Loss Multiple", type=input.float, defval=3, minval=1, step=0.2)
tpMultiplier = input(title= "Take Profit Multiple", type=input.float, defval=3, minval=1, step=0.2)
maPlot = input(true, title="Plot EMA?")
maCrossoverExit =  input(false, title="Exit with Slow MA Crossover?")
atrExit = input(true, title="Exit with ATR?")
//***********************************
// ATR
//***********************************
atr = atr(atrLength)


//***********************************
// Volatility Filter
//**********************************
// During uptrends the ATR indicator tends to post lower volatility.
// During downtrends, the ATR indicator tends to post higher volatility

volatilityBullish = atr < atr[1]
volatilityBearish = atr > atr[1]


//***********************************
// Moving Averages
//***********************************

// Double Line Plot Code (used for Entries & Exits not plotted by default)
fast = ema(source, fastMA)
slow = ema(source, slowMA)
maLong = crossover(fast, slow)
maShort = crossunder(fast, slow)

// Single Line Plot Code
bullish = slow > slow[1]
bearish = slow < slow[1]
barColor = bullish ? color.green : bearish ? color.red : color.blue


//*****************************
// Entries
//*****************************

entryLong = maLong and volatilityBullish
entryShort = maShort and volatilityBearish

if entryLong
    sLoss = source - atr * slMultiplier
    strategy.entry("Long", strategy.long, qty=10)
    strategy.exit("Long Exit", "Long", stop=sLoss)


if entryShort
    sLoss = source + atr * slMultiplier
    tProfit = close > slowMA
    strategy.entry("Short", strategy.short, qty=10)
    strategy.exit("Short Exit", "Short", stop=sLoss)


//*****************************
// Exits
//*****************************

exitLong = 0
exitShort = 0

if maCrossoverExit
    exitLong = maShort
    exitShort = maLong
    strategy.exit("Long Exit", "Long", when = exitLong)
    strategy.exit("Short Exit", "Short", when = exitShort)

if atrExit
    exitLong = source + atr * tpMultiplier
    exitShort = source - atr * tpMultiplier
    strategy.exit("Long Exit", "Long", limit = exitLong)
    strategy.exit("Short Exit", "Short", limit = exitShort)


//******************************
// ATR Based Exit/ Stop Plotting
//******************************

// Stop Loss Calculations
longStopLoss = source - atr(atrLength) * slMultiplier
shortStopLoss = source + atr(atrLength) * slMultiplier

longTakeProfit = source - atr(atrLength) * slMultiplier
shortTakeProfit = source + atr(atrLength) * slMultiplier


//*********************************
//Chart Plotting
//*********************************

//ATR Based Stop Losses
plot(shortStopLoss, color=color.fuchsia, offset=0, transp=0, show_last=5, linewidth=2, style=plot.style_stepline, title="Short Stop Loss")
plot(longStopLoss, color=color.fuchsia, offset=0, transp=0, show_last=5, linewidth=2, style=plot.style_stepline, title="Long Stop Loss")


// Single Slow EMA Option
plot(slow and maPlot ? slow : na, title="EMA", color=barColor, linewidth=3)
Detail
https://www.fmz.com/strategy/432313
Last Modified
2023-11-16 11:25:23