
9.4 KiB
Name
双重均线交叉移动平均策略Dual-Moving-Average-Crossover-Strategy
Author
ChaoZhang
Strategy Description
 [trans]
概述
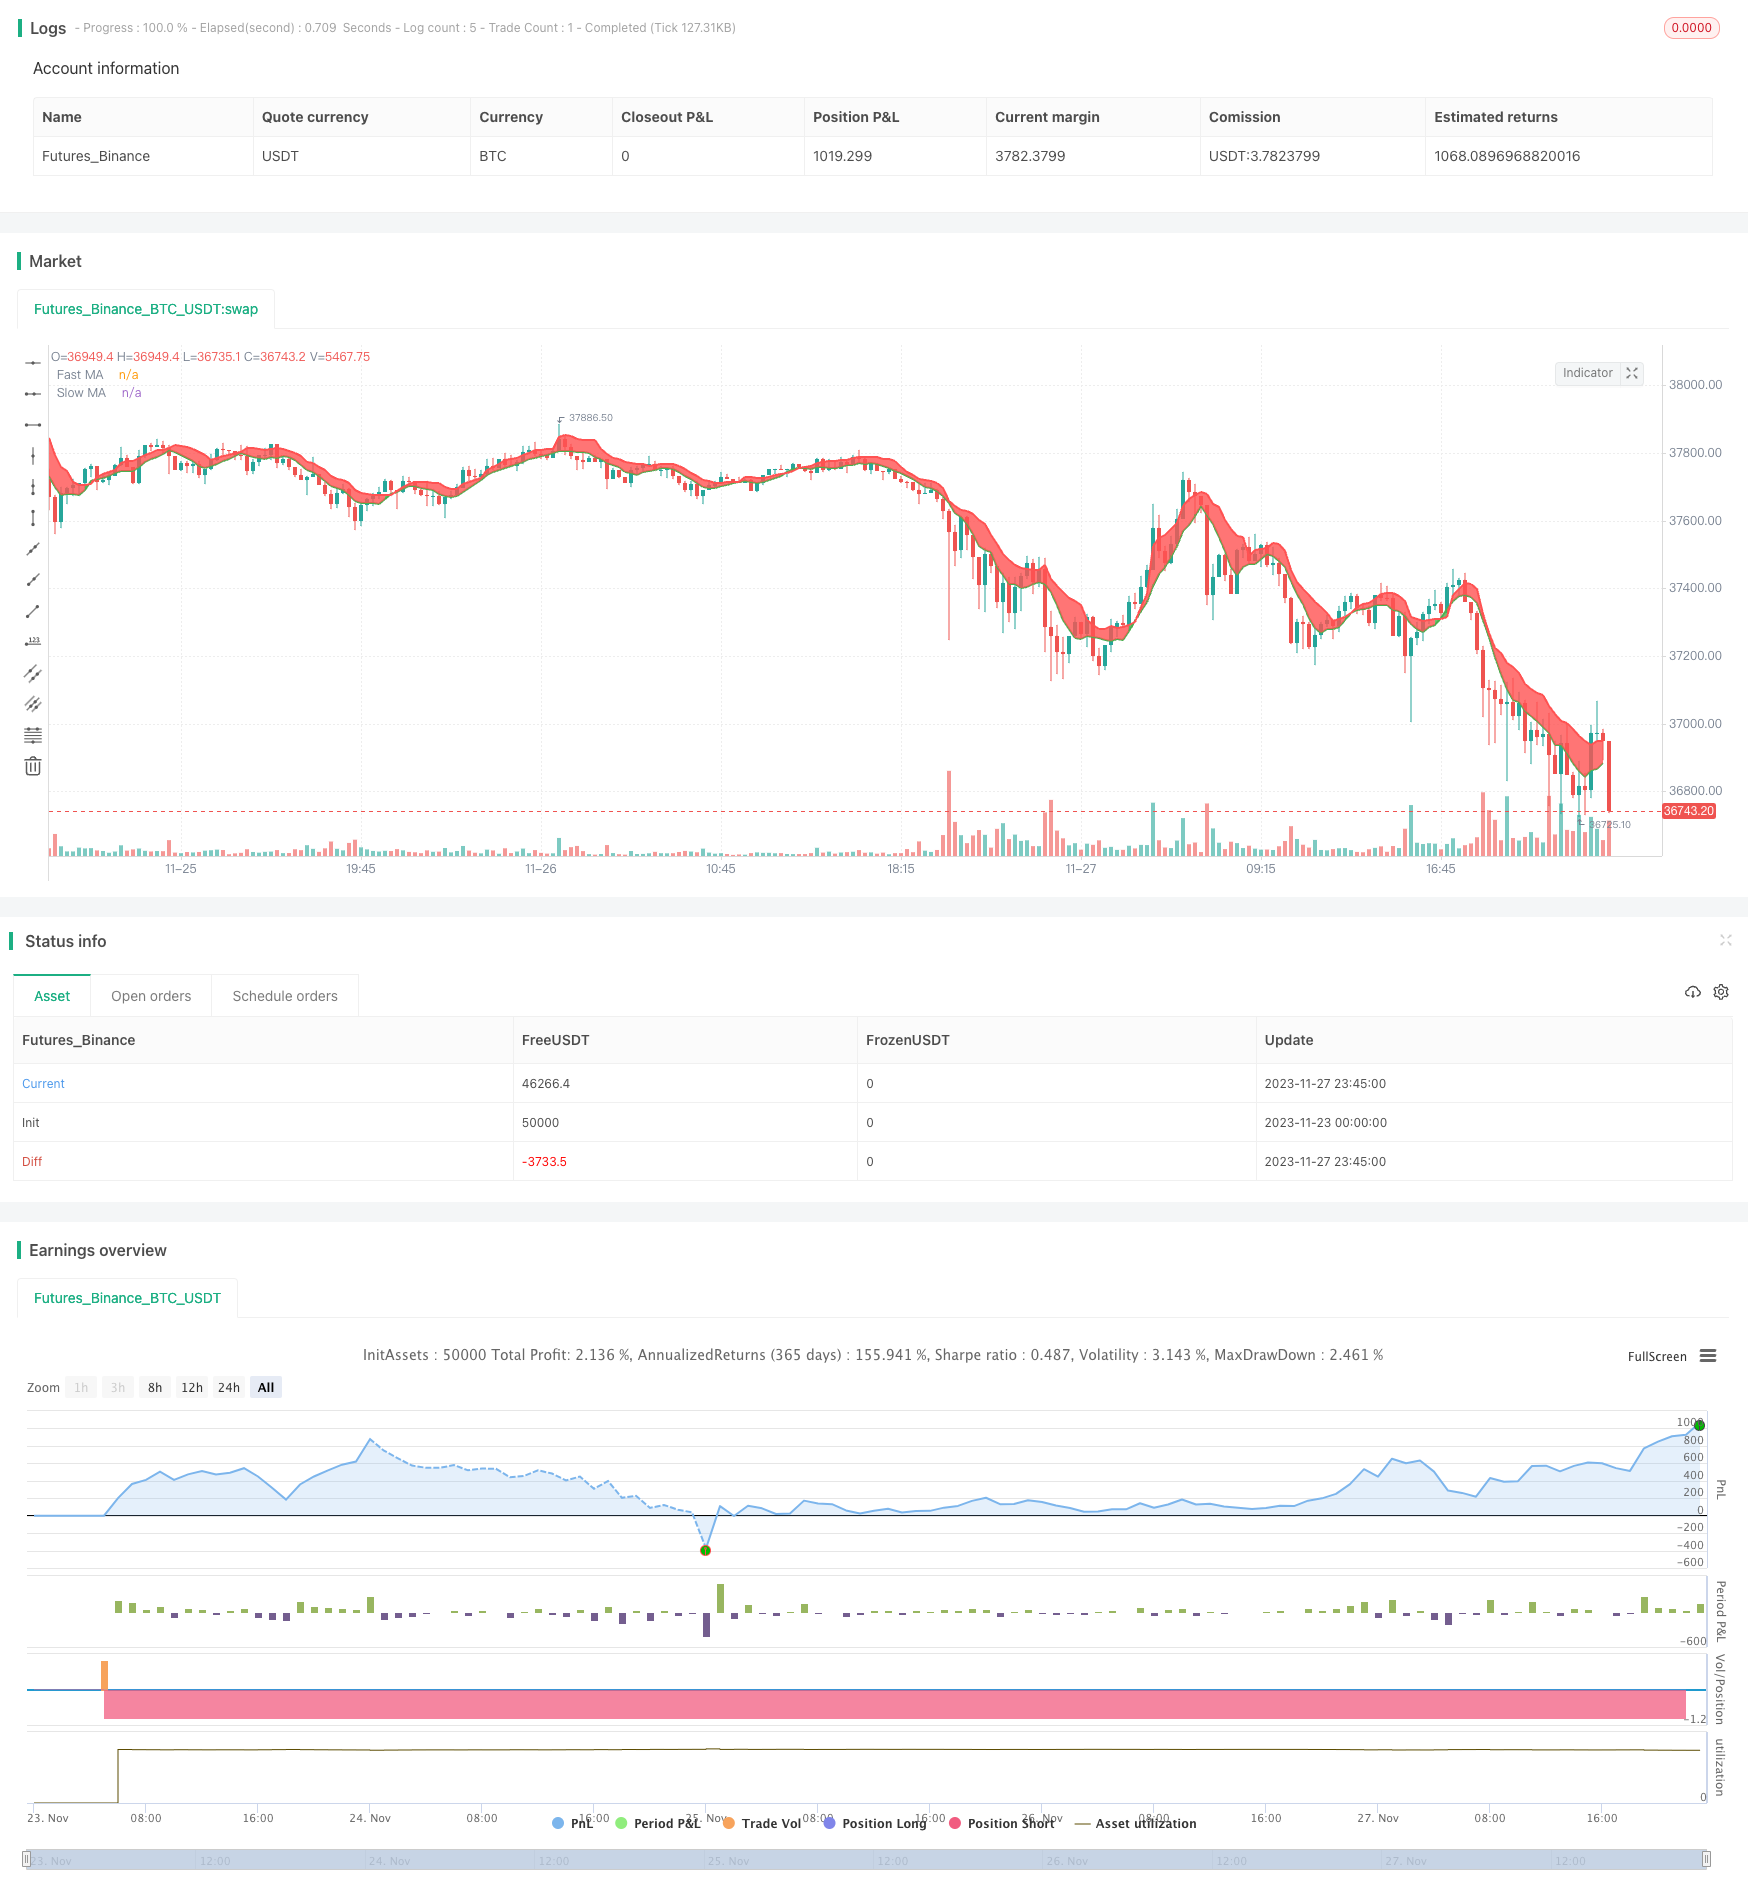
该策略是基于双重均线交叉的趋势跟踪策略。它结合了快速简单移动平均线(SMA)和缓慢加权移动平均线(VWMA),利用两条平均线的交叉形成买入和卖出信号。
当快速SMA向上穿过缓慢VWMA时,产生买入信号;当快速SMA向下穿过缓慢VWMA时,产生卖出信号。策略采用止损机制控制风险。
策略原理
该策略的核心逻辑基于双重均线交叉系统。具体来说,它同时运用了以下技术指标:
- 简单移动平均线(SMA):对最近n天的收盘价取算术平均值,能反映最近期间的平均价格。
- 加权移动平均线(VWMA):对最近n天的收盘价进行加权平均,赋予近期价格更大权重,能更快速地响应价格变动。
双重均线中的快速SMA参数设置较短,能快速响应价格变化;缓慢VWMA参数较长,具有滤波作用。当短期和长期趋势向同一方向发展时,快速SMA向上穿越缓慢VWMA产生买入信号;向下穿越时产生卖出信号。
该策略同时设置止损机制。当价格向不利方向运行时,及时止损以控制风险。
优势分析
- 响应迅速,跟踪市场趋势的变化
- 回撤控制好,止损机制有效控制风险
- 简单直观,容易理解实现
- 可以通过调整参数进行优化,适应不同市场环境
风险分析
- 双重均线策略容易产生多头市场的假信号
- 需要选择合适的参数,不当设置可能导致亏损
- 偶尔可能会头疼 Markt 的突发事件而造成损失
风险控制的方法:
- 采用趋势过滤指标进行确认
- 优化参数设置
- 采取止损策略,合理控制单笔损失
优化方向
该策略可以从以下几个方面进行优化:
- 结合其他技术指标进行确认,例如RSI,布林线等,提高信号的准确性
- 优化均线参数的长度,根据不同周期调整参数
- 结合交易量指标,在大量能量进出的点位进行交易
- 根据回测结果进行参数调整,选择最优参数
- 采用动态止损,根据市场波动程度来调整止损点
总结
该策略整体来说是一个非常实用的趋势跟踪策略。它采用简单直观的双重均线交叉来产生交易信号,通过快速均线和缓慢均线的配合,能够有效捕捉市场趋势的变化。止损机制也使其具有良好的风险控制。通过配合其他指标和参数优化,可以进一步提高策略的交易效果。
||
Overview
This strategy is based on the dual moving average crossover trend following system. It combines fast simple moving average (SMA) and slow weighted moving average (VWMA), and generates trading signals when the two lines cross each other.
When the fast SMA crosses above the slow VWMA, a buy signal is generated. When the fast SMA crosses below the slow VWMA, a sell signal is generated. The strategy also employs stop loss mechanism to control risks.
Strategy Logic
The core logic of this strategy lies in the dual moving average crossover system. Specifically, it utilizes the following technical indicators:
- Simple Moving Average (SMA): Arithmetic mean of closing prices over the past n days, reflecting recent average price.
- Weighted Moving Average (VWMA): Weighted mean of closing prices over the past n days, assigning higher weights to more recent prices, responding faster to price changes.
The fast SMA has a shorter lookback period to react swiftly to price changes, while the slow VWMA has a longer lookback period for smoothing. When short-term and long-term trends align in the same direction, the fast SMA crossing above the slow VWMA generates buy signals, while crossing below generates sell signals.
The strategy also sets up stop loss mechanisms. It cuts losses in time when price moves in unfavorable directions.
Advantage Analysis
- Responds swiftly in tracing market trend changes
- Good drawdown control with effective stop loss mechanisms
- Simple and intuitive, easy to understand and implement
- Optimizable parameters across varying market environments
Risk Analysis
- Dual MA strategies tend to give false signals in bull markets
- Inappropriate parameter tuning could lead to losses
- Occasional flash crashes could cause losses
Risk Management:
- Employ trend filtering indicators for confirmation
- Optimize parameter settings
- Adopt stop loss strategy to reasonably control single loss
Optimization Directions
The strategy can be enhanced in the following aspects:
- Incorporate other indicators like RSI, Bollinger Bands to increase signal accuracy
- Optimize length of moving averages across cycles
- Combine volume indicators, trade at points with significant capital flows
- Adjust parameters based on backtest results to find optimum
- Employ dynamic stop loss, adjusting stops based on market volatility
Conclusion
In conclusion, this is a very practical trend following strategy. It uses intuitive dual moving average crossovers to generate trading signals, capturing trend changes effectively with the coordination of fast and slow moving averages. The stop loss mechanism also ensures good risk control. With complementary indicators and parameter optimization, the strategy can achieve even better trading performance.
[/trans]
Strategy Arguments
| Argument | Default | Description |
|---|---|---|
| v_input_1_close | 0 | Simple MA Source: close |
| v_input_2 | 6 | Simple MA Length |
| v_input_3_high | 0 | VW MA Source: high |
| v_input_4 | 7 | VW MA Period |
| v_input_5 | true | From Month |
| v_input_6 | true | From Day |
| v_input_7 | 2018 | From Year |
| v_input_8 | true | To Month |
| v_input_9 | true | To Day |
| v_input_10 | 9999 | To Year |
| v_input_11 | 50 | v_input_11 |
| v_input_12 | 2 | v_input_12 |
| v_input_13 | 27 | v_input_13 |
| v_input_14 | 32.6 | oversold |
| v_input_15 | 63 | overbought |
Source (PineScript)
/*backtest
start: 2023-11-23 00:00:00
end: 2023-11-28 00:00:00
period: 15m
basePeriod: 5m
exchanges: [{"eid":"Futures_Binance","currency":"BTC_USDT"}]
*/

//@version=4
//strategy(title="Bitlinc Entry v0.1 VWMA / SMA / MRSI SQQQ 94M", overlay=true, initial_capital=10000, currency='USD')

strategy(title="Bitlinc Entry v0.1 VWMA / SMA / MRSI SQQQ 94M", overlay=true)

// Credit goes to this developer for the "Date Range Code"
// https://www.tradingview.com/script/62hUcP6O-How-To-Set-Backtest-Date-Range/

// === GENERAL INPUTS ===
// short ma
maFastSource   = input(defval = close, title = "Simple MA Source")
maFastLength   = input(defval = 6, title = "Simple MA Length", minval = 1)
// long ma
maSlowSource   = input(defval = high, title = "VW MA Source")
maSlowLength   = input(defval = 7, title = "VW MA Period", minval = 1)


// === SERIES SETUP ===
// a couple of ma's...
maFast = sma(maFastSource, maFastLength)
maSlow = vwma(maSlowSource, maSlowLength)


// === PLOTTING ===
fast = plot(maFast, title = "Fast MA", color = color.green, linewidth = 2, style = plot.style_line, transp = 30)
slow = plot(maSlow, title = "Slow MA", color = color.red, linewidth = 2, style = plot.style_line, transp = 30)

// === INPUT BACKTEST RANGE ===
FromMonth = input(defval = 1, title = "From Month", minval = 1, maxval = 12)
FromDay   = input(defval = 1, title = "From Day", minval = 1, maxval = 31)
FromYear  = input(defval = 2018, title = "From Year", minval = 2017)
ToMonth   = input(defval = 1, title = "To Month", minval = 1, maxval = 12)
ToDay     = input(defval = 1, title = "To Day", minval = 1, maxval = 31)
ToYear    = input(defval = 9999, title = "To Year", minval = 2017)

// === FUNCTION EXAMPLE ===
start     = timestamp(FromYear, FromMonth, FromDay, 00, 00)  // backtest start window
finish    = timestamp(ToYear, ToMonth, ToDay, 23, 59)        // backtest finish window
window()  => time >= start and time <= finish ? true : false // create function "within window of time"

// === LOGIC ===
enterLong = crossover(maFast, maSlow)
exitLong = crossover(maSlow, maFast)
//enterLong = crossover(maSlow, maFast)
//exitLong = crossover(maFast, maSlow)

// Entry //
strategy.entry(id="Long Entry", long=true, when=window() and enterLong)
strategy.entry(id="Short Entry", long=false, when=window() and exitLong)

// === FILL ====
fill(fast, slow, color = maFast > maSlow ? color.green : color.red)

// === MRSI ===
//
//

basis = rsi(close, input(50))

ma1 = ema(basis, input(2))
ma2 = ema(basis, input(27))

oversold = input(32.6)
overbought = input(63)

//plot(ma1, title="RSI EMA1", color=blue)
//plot(ma2, title="RSI EMA2", color=yellow)

obhist = ma1 >= overbought ? ma1 : overbought
oshist = ma1 <= oversold ? ma1 : oversold

//plot(obhist, title="Overbought Highligth", style=columns, color=color.maroon, histbase=overbought)
//plot(oshist, title="Oversold Highligth", style=columns, color=color.yellow, histbase=oversold)

//i1 = hline(oversold, title="Oversold Level", color=white)
//i2 = hline(overbought, title="Overbought Level", color=white)

//fill(i1, i2, color=olive, transp=100)

// === LOGIC ===
enterLongMrsi = crossover(ma1, oversold)
exitLongMrsi = crossover(ma1, overbought)

// Entry //
strategy.entry(id="MRSI Long Entry", long=true, when=window() and enterLongMrsi)
strategy.entry(id="MRSI Short Entry", long=false, when=window() and exitLongMrsi)

//hline(50, title="50 Level", color=white)
Detail
https://www.fmz.com/strategy/433969
Last Modified
2023-12-01 18:18:16