
11 KiB
Name
双重叠加平均线组合Stochastic异同K线交易策略Intraday-Stochastic-Oscillator-with-Double-Moving-Average-Crossover-Strategy
Author
ChaoZhang
Strategy Description
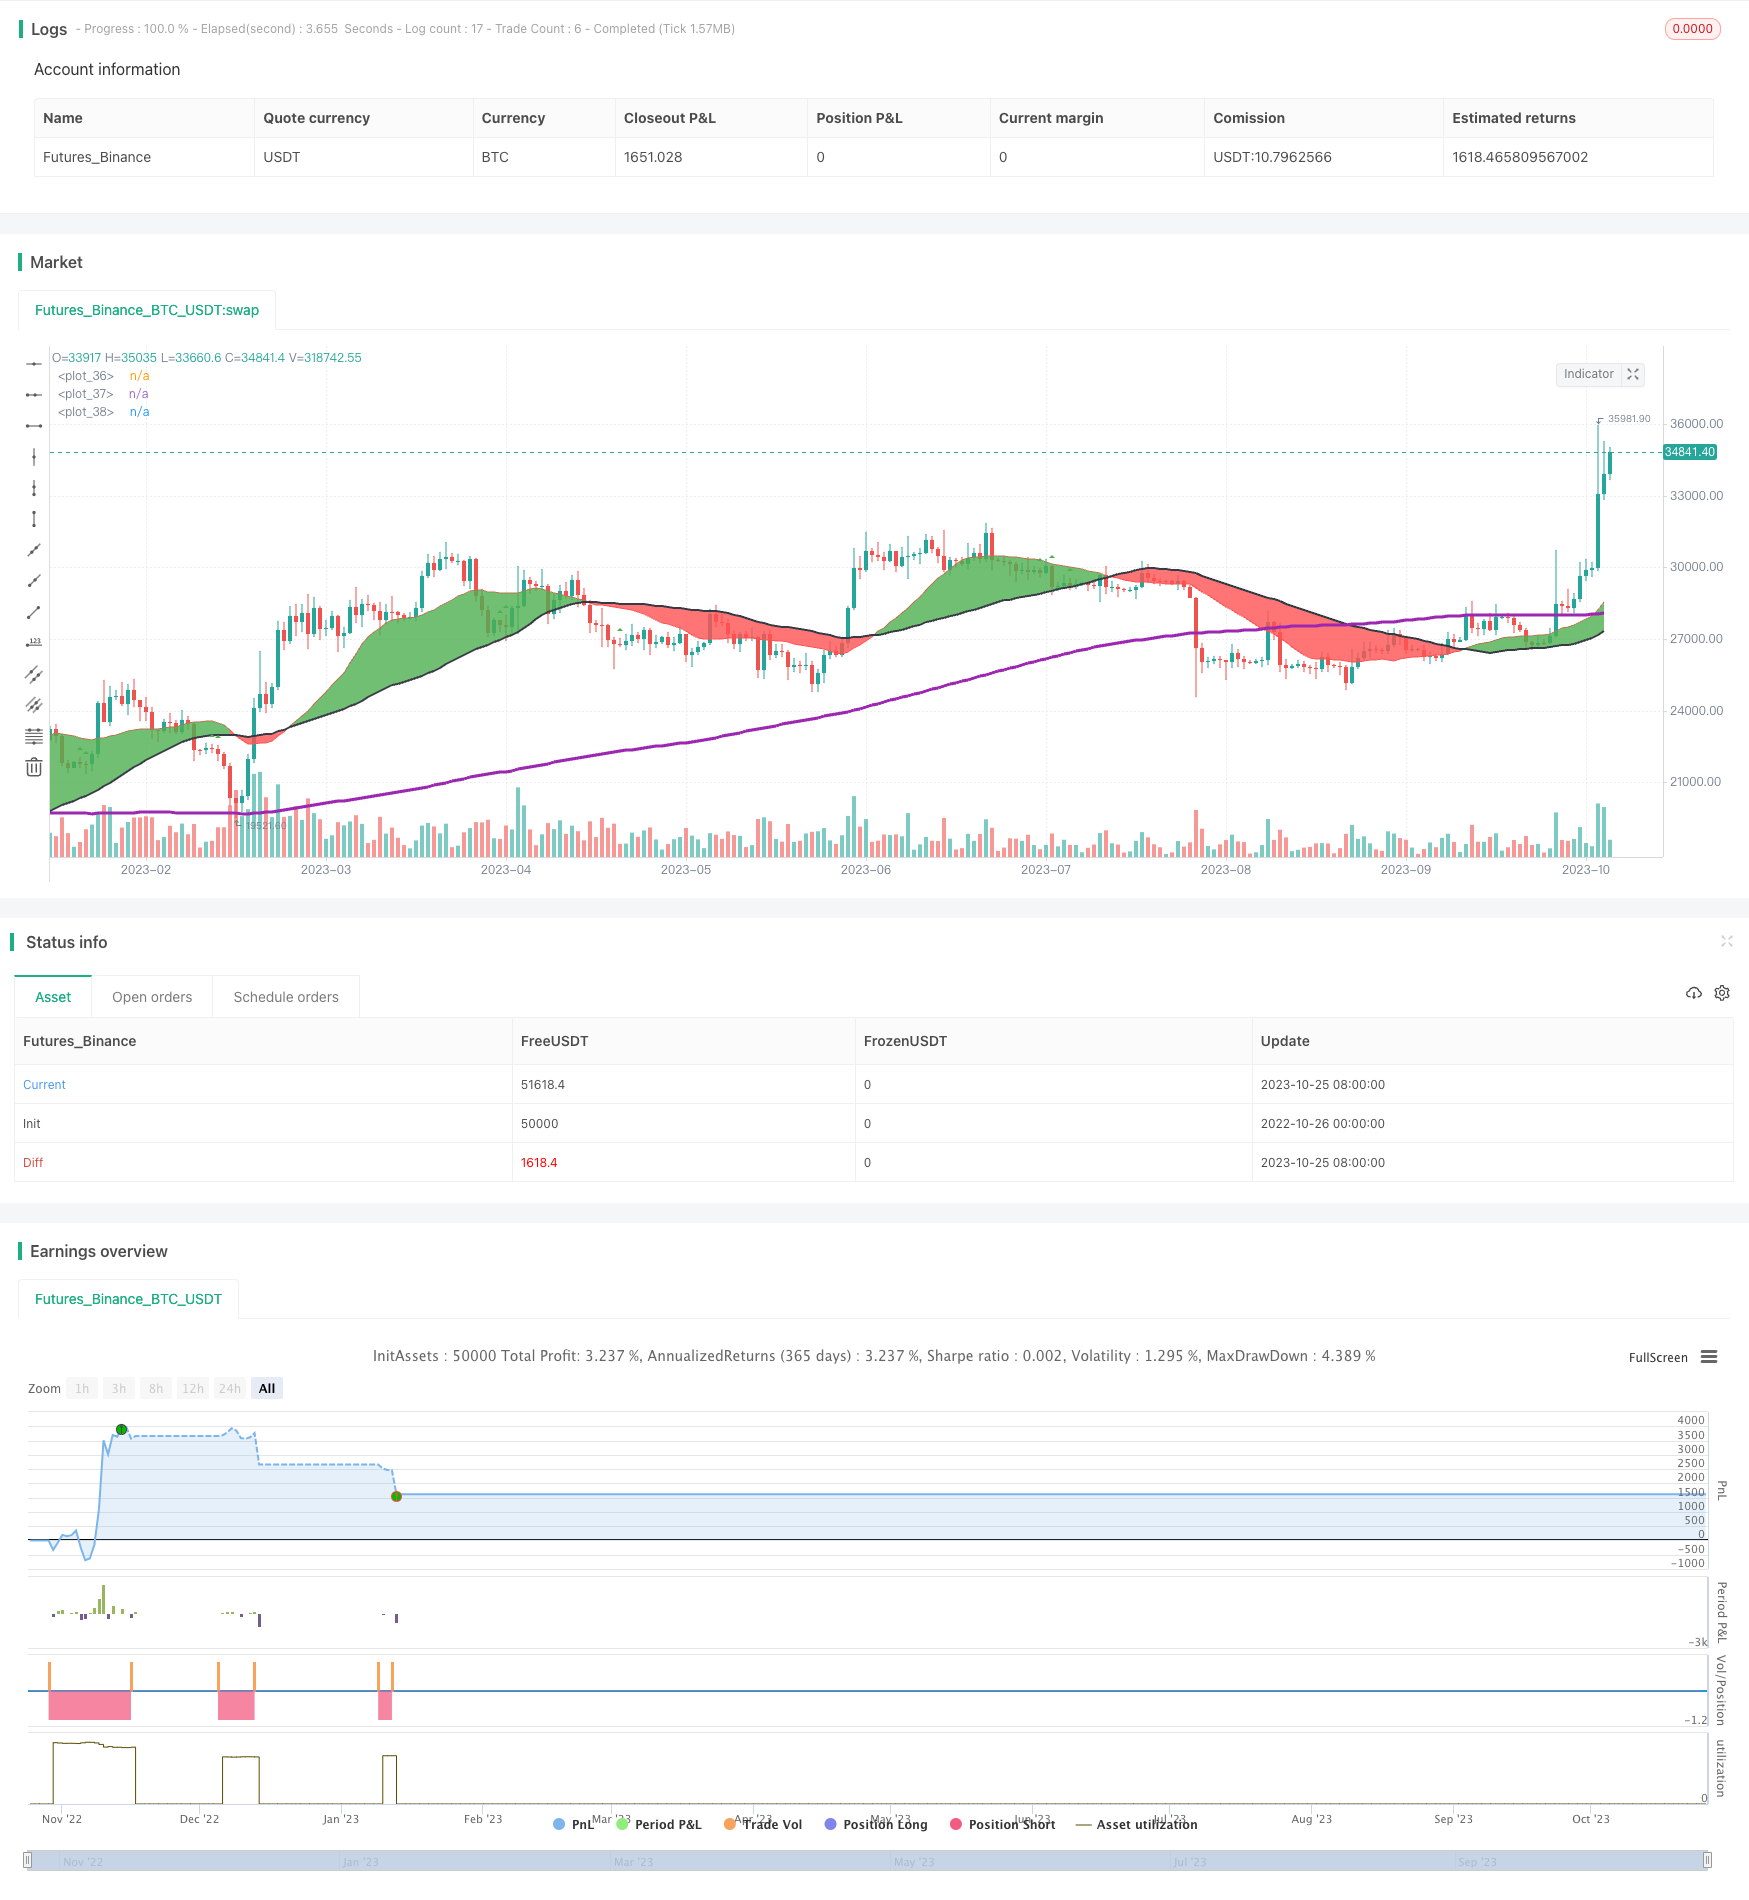 [trans]
概述
本策略通过组合使用双重叠加平均线指标和Stochastic指标来识别趋势反转的机会,实现高效的短线交易。当价格进入超买超卖区域时策略选择做空;当价格进入超卖区域时策略选择做多,以捕捉中短线趋势的反转。
策略原理
该策略主要基于双重叠加平均线和Stochastic指标的组合使用。
双重叠加平均线由快速移动平均线、慢速移动平均线和超慢速移动平均线组成。当快速移动平均线上穿慢速移动平均线时,视为买入信号;当快速移动平均线下穿慢速移动平均线时,视为卖出信号。双重叠加平均线能识别出中短线趋势的反转点。
Stochastic指标包含K值和D值,K值表示当前收盘价相对N天内的最高价和最低价的位置,D值是K值的M日简单移动平均。当K值和D值都超过80时为超买区,小于20时为超卖区。Stochastic指标能识别出短期的超买超卖区域。
本策略通过结合双重叠加平均线和Stochastic指标,在Stochastic指标显示超买或超卖区域时,treeview看是否与双重平均线信号一致,如果一致则选择该点进行反转交易,以期捕捉短线趋势的转折点。
优势分析
该策略具有以下优势:
-
组合使用双重叠加平均线和Stochastic指标,能够同时识别出中短线和短线的趋势转折点。
-
利用Stochastic指标的超买超卖信号选择更有效的双叠加平均线反转交易机会。
-
交易策略规则清晰,容易实施。
-
可调整的交易时间和月份参数,适应不同品种和时间段。
-
设置止损来控制风险。
风险分析
该策略也存在一些风险:
-
双重叠加平均线可能产生假突破,Stochastic指标也可能出现失效的异同K线形态,导致交易信号错误。可适当调整参数,或者增加其他指标进行组合验证。
-
只基于技术指标,没有考虑基本面因素,在重大经济事件发生时容易失败。可加入经济事件风险控制。
-
难以把握移动平均线反转的精确时点,可能出现止损过小或过大的问题。应优化止损策略。
-
参数设定不当可能导致交易频率过高或信号效果不佳。应针对不同品种和周期进行参数优化测试。
-
仅适合短线交易,不适合长线持有。应控制仓位规模。
优化方向
该策略可以从以下几个方面进行优化:
-
测试更多指标的组合,如KDJ、MACD等,增强信号的有效性。
-
加入交易量指标分析,避免虚假突破。
-
优化双平均线参数,识别更精确的反转时点。
-
优化止损策略,降低止损被触发的可能。
-
增加经济事件风险控制模块,避免重大事件对交易的影响。
-
利用机器学习技术自动优化参数,提高参数的适应性。
-
在更多品种和周期进行回测,寻找最佳的应用方向。
总结
本策略通过双重叠加平均线和Stochastic异同K线形态的组合运用,实现了在中短线趋势反转点进行交易的目的。相比单一使用某个指标,该策略能提高 trades 盈利能力,且策略规则清晰易操作。但该策略也存在一定的风险,需要对参数及止损进行优化,并且加入更多验证指标和风控手段。总体来说,本策略为一种可靠、适中频率的短线交易策略。
||
Overview
This strategy combines double moving average crossover and Stochastic oscillator to identify trend reversal opportunities for efficient short-term trading. It goes short when price enters the overbought region and goes long when price enters the oversold region, in order to catch the reversal of medium-term trends.
Strategy Logic
The strategy is based on the combination of double moving average crossover and Stochastic oscillator.
The double moving average crossover consists of a fast moving average, slow moving average and ultraslow moving average. When the fast MA crosses above the slow MA, it is a buy signal. When the fast MA crosses below the slow MA, it is a sell signal. The double MA crossover can identify medium-term trend reversal points.
The Stochastic oscillator contains the %K and %D values. %K shows where the current close is relative to the highest and lowest prices of the past N days. %D is the M-day simple moving average of %K. Values above 80 mean overbought levels and values below 20 mean oversold levels. The Stochastic oscillator can identify short-term overbought/oversold zones.
This strategy combines the double MA crossover and Stochastic oscillator. It looks for trend reversal signals from the double MA crossover when Stochastic shows overbought/oversold levels. This aims to catch short-term trend reversals.
Advantage Analysis
The advantages of this strategy:
-
Combining double MA crossover and Stochastic oscillator to identify both medium-term and short-term trend reversals.
-
Using Stochastic overbought/oversold signals to select more effective double MA crossover reversal trades.
-
Clear trading rules easy to implement.
-
Adjustable trading time and month parameters suitable for different products and time periods.
-
Stop loss to control risks.
Risk Analysis
The risks of this strategy:
-
Double MA may have false breakouts. Stochastic may have invalid bull/bear divergences, leading to wrong trade signals. Fine tune parameters or add other indicators for combo confirmation.
-
Based solely on technical indicators without considering fundamentals. May fail on major economic events. Add economic event risk control.
-
Hard to pinpoint exact MA reversal timing, may have issues of stops being too tight or too wide. Optimize stop loss strategy.
-
Improper parameter settings may lead to over-trading or poor signal quality. Optimize parameters for different products and timeframes through backtesting.
-
Only suitable for short-term trading, not long-term holding. Control position sizing.
Optimization Directions
The strategy can be optimized in several aspects:
-
Test more indicator combos like KDJ, MACD etc to improve signal validity.
-
Add trading volume analysis to avoid false breakouts.
-
Optimize double MA parameters to identify more accurate reversal points.
-
Optimize stop loss strategy to reduce chance of being stopped out.
-
Add economic event risk control modules to avoid impacts from major events.
-
Use machine learning techniques to auto optimize parameters for better adaptiveness.
-
Backtest on more products and timeframes to find best applications.
Conclusion
This strategy trades at medium-term trend reversal points identified by the double MA crossover and Stochastic bull/bear divergences. Compared to using a single indicator, it can improve trade profitability with clear rules. But it also has risks that require parameter and stop loss optimization, and more filters and risk controls. Overall it is a reliable, medium-frequency short-term trading strategy.
[/trans]
Strategy Arguments
| Argument | Default | Description |
|---|---|---|
| v_input_1 | true | Mode |
| v_input_2 | 10000 | Loss Limit |
| v_input_3 | 2 | Hour Start |
| v_input_4 | 13 | Hour Stop |
| v_input_5 | false | Month Selected |
| v_input_6 | 3 | smooth |
| v_input_7 | 14 | K |
| v_input_8 | 3 | D |
Source (PineScript)
/*backtest
start: 2022-10-26 00:00:00
end: 2023-10-26 00:00:00
period: 1d
basePeriod: 1h
exchanges: [{"eid":"Futures_Binance","currency":"BTC_USDT"}]
*/

//@version=3
strategy(title="Intraday Stochiastic Strategy", shorttitle="Intraday Stochiastic Strategy", overlay=true, initial_capital = 1000)
//WORKS FOR BTCUSD M30
//OBVERVED GOOD PERFORMANCES FOR SELL MODE M15 : US30USD / UK100GBP / JP225USD / SPX500USD / BCOUSD / EURGBP
//Best Forex Hours are 7-21
//0 is Long Position
//1 is Short Position
//2 No position
mode=input(1, maxval=2, title="Mode")
lossLimit=input(10000, maxval=10000, title="Loss Limit")
hourStart=input(2, maxval=24, title="Hour Start")
hourStop=input(13, maxval=24, title="Hour Stop")

//Month selected for back testing. 0 is maximum number of months
monthSelected = input(0, maxval=12, title="Month Selected")

/////////////////////////////////////////////////

fast = 20, slow = 50, ultraSlow = 200
fastMA = sma(close, fast)
slowMA = sma(close, slow)
ultraSlowMA = sma(close, ultraSlow)

colorFast = red
colorSlow = black
colorUltraSlowMA = purple

if(timeframe.period == "1" or timeframe.period == "3" or timeframe.period == "5" or timeframe.period == "15" or timeframe.period == "30" or timeframe.period == "45" or timeframe.period == "60" or timeframe.period == "120" or timeframe.period == "180" or timeframe.period == "240")
    fastMA := ema(close, fast)
    slowMA := ema(close, slow)
    ultraSlowMA := ema(close, ultraSlow)
    colorFast := orange
    colorSlow := gray
    colorUltraSlowMA := blue

p1 = plot(fastMA, color=colorFast)
p2 = plot(slowMA, color=colorSlow, linewidth=2)
p3 = plot(ultraSlowMA, color=colorUltraSlowMA, linewidth=3)

fill(p1, p2, color = fastMA > slowMA ? green : red)

////////////////////////////////////////////////

ema150 = 200
ema150MA = ema(close, ema150)

smooth = input(3, minval=1), K = input(14, minval=1), D=input(3,minval=1)
hh=highest(high,K)
ll=lowest(low,K)
k = sma((close-ll)/(hh-ll)*100, smooth)
d = sma(k, 3)
//plot(k, color=blue)
//plot(d, color=red)
//h0 = hline(80)
//h1 = hline(20)
//fill(h0, h1, color=purple, transp=95)


//plot(hour*100, color=red, linewidth=2)

stochiasticHigh = 80
stochiasticLow = 20

data = close < ema150MA and k>stochiasticHigh and d>stochiasticHigh and close>open
plotshape(data, style=shape.triangledown, location=location.belowbar, color=red)

data2 = close > ema150MA and k<stochiasticLow and d<stochiasticLow and close<open
plotshape(data2, style=shape.triangleup, location=location.abovebar, color=green)

isData = 0
isData := isData[1]


if(isData == 0)
    if(data)
        if(mode==1 and hour>hourStart and hour<hourStop and (monthSelected==0 or month==monthSelected)) //DOW hours : 2-13
            strategy.entry("SCALP SHORT", strategy.short)
            isData := 1
else
    if(k<stochiasticLow and d<stochiasticLow)
        if(mode==1)
            strategy.close_all(when = true)
        isData := 0

isData2 = 0
isData2 := isData2[1]

if(isData2 == 0)
    if(data2)
        if(mode==0 and hour>hourStart and hour<hourStop and (monthSelected==0 or month==monthSelected))
            strategy.entry("SCALP LONG", strategy.long)
            isData2 := 1
else
    if(k>stochiasticHigh and d>stochiasticHigh)
        if(mode==0)
            strategy.close_all(when = true)
        isData2 := 0

strategy.exit("STOP LOSS", "SCALP LONG", loss=lossLimit)
strategy.exit("STOP LOSS", "SCALP SHORT", loss=lossLimit)
Detail
https://www.fmz.com/strategy/430384
Last Modified
2023-10-27 17:00:04