
6.8 KiB
Name
双速率变化量动量指标交易策略Dual-Rate-of-Change-Momentum-Indicator-Trading-Strategy
Author
ChaoZhang
Strategy Description
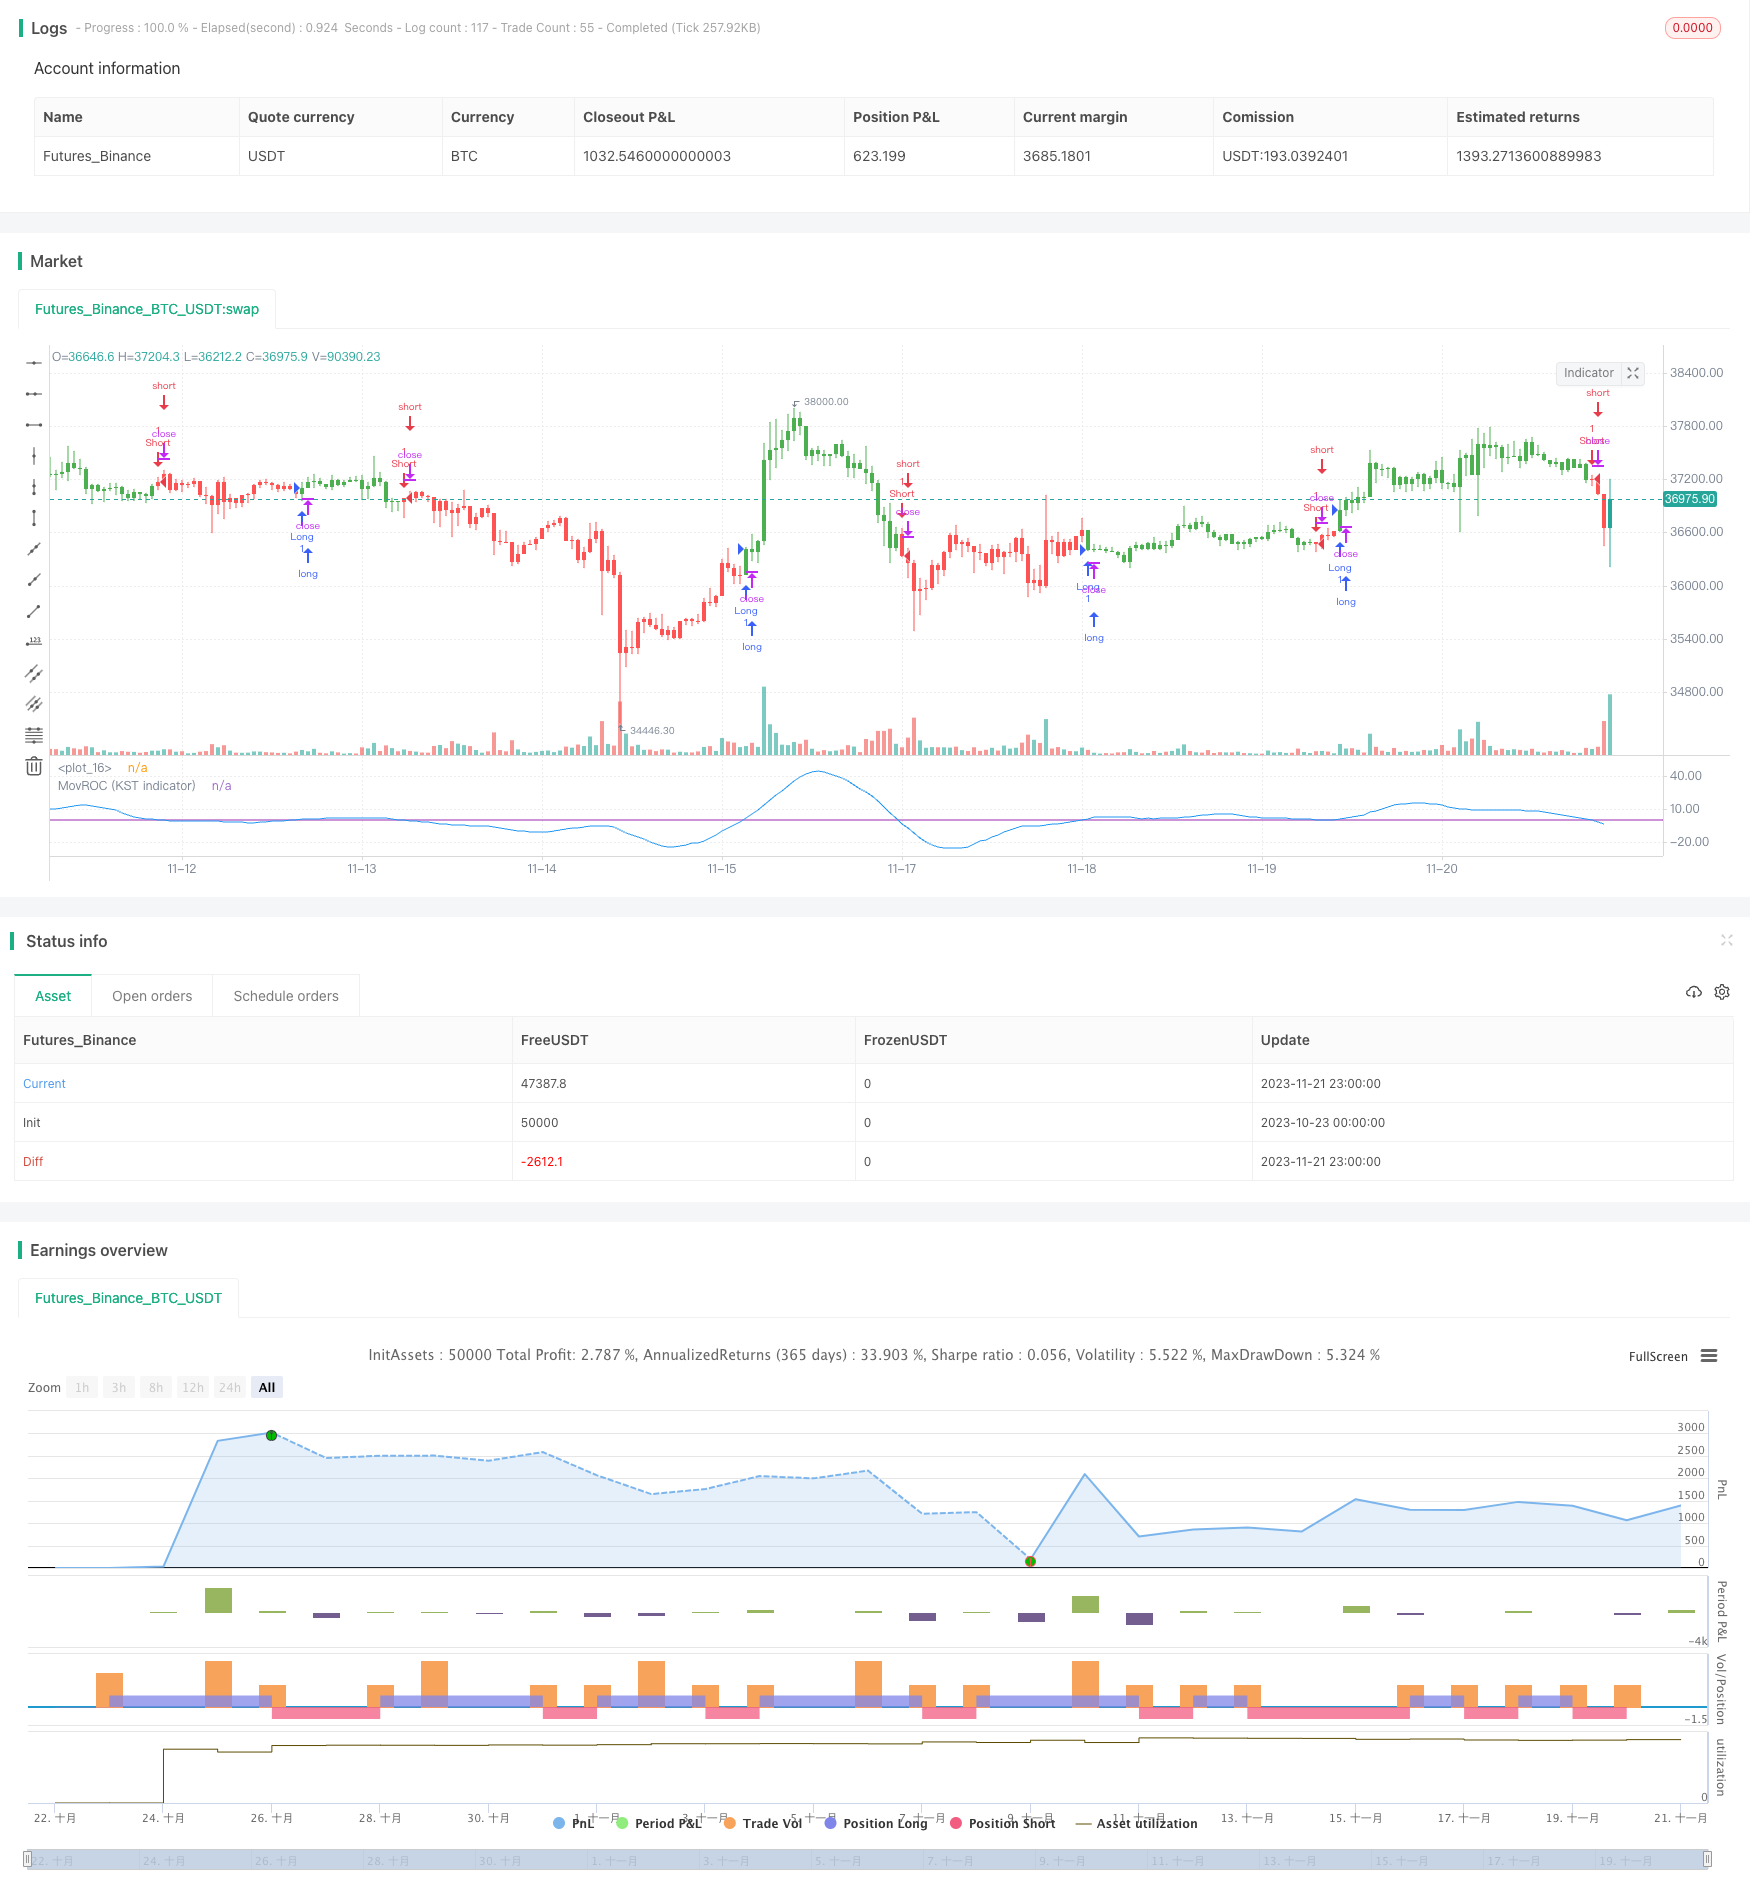
[trans]
概述
该策略是一个基于双速率变化量动量指标的交易策略。策略通过计算多个不同周期的变化量,构建一个综合的动量指标,并以其波动判断市场趋势,产生交易信号。
策略原理
该策略的核心指标是双速率变化量动量指标(Dual Rate of Change Momentum Indicator),简称DRCMI。它由多个不同周期的变化量的加权平均构成。具体来说,包括6周期、10周期、15周期和20周期的变化量。其中,6周期和10周期变化量的权重为1;15周期变化量权重为2;20周期变化量权重为3。这样,更长周期的变化量具有更大的权重。
综合多个周期的变化量,可以同时反映市场的短期和较长期的动量。当DRCMI为正时,表示短期和长期趋势均为上升;当为负时,表示短期和长期均为下降。DRCMI的波动幅度也反映了市场动量的力度。
根据DRCMI的多空周期性特点,策略判断行情趋势,产生交易信号。当DRCMI上穿0轴时,做多;当DRCMI下穿0轴时,做空。
优势分析
该策略主要有以下优势:
- 整合多周期动量,判断市场趋势更加准确。
- 比单一变化量指标更能捕捉周期性特征。
- 权重设计合理,注重较长周期,可过滤噪声。
- 实施简单,仅一个指标即可判断行情。
- 可自定义周期参数,适应不同品种。
风险分析
该策略也存在一些风险:
- 多周期综合指标,参数设置敏感,不当设置可能失败。
- 仅关注动量指标,可能忽略其他因素。
- 存在一定的滞后,应适当优化入市出场。
- 行情剧烈波动时,止损保护仍然必要。
为控制风险,建议设置止损,优化指标参数,并辅助其他技术指标。
优化方向
该策略可从以下几个方面进行优化:
- 优化DRCMI的参数,调整周期和权重的设置。
- 结合趋势指标,确定市场阶段,动态调整参数。
- 设置动态止损,保护利润。
- 结合相关性指标,评估品种间关系,设定品种组合。
总结
该策略通过构建DRCMI指标,整合多周期动量特征,判断行情趋势,以获利。策略简单实用,效果明显。但PARAMETER设置和止损保护仍需优化,与其他技术指标配合使用效果更佳。
||
Overview
This is a trading strategy based on the Dual Rate of Change Momentum Indicator (DRCMI). It generates trading signals by gauging market momentum across multiple timeframes.
Strategy Logic
The core of this strategy is the DRCMI, which is a weighted average of multiple Rate of Change (ROC) indicators across different periods. Specifically, it incorporates 6-period, 10-period, 15-period, and 20-period ROC. The 6-period and 10-period ROC have a weight of 1, while the 15-period ROC has a weight of 2, and the 20-period ROC has a weight of 3. Thus, longer-term ROC is given greater emphasis.
By combining ROC across timeframes, the DRCMI reflects both short-term and longer-term momentum. When it is positive, it indicates an uptrend in both the short and long run. When negative, it signals a downtrend. The intensity of the momentum is also captured in the amplitude of DRCMI fluctuations.
Trading signals are generated based on the cyclicality of DRCMI. A long position is initiated when DRCMI crosses above 0, while a short position is initiated when it crosses below 0.
Advantage Analysis
The main advantages of this strategy are:
- Integrates momentum across periods for more accurate trend identification.
- Better captures cyclicality compared to single timeframe ROC.
- Reasonable weighting methodology focuses on longer-term to filter noise.
- Simple to implement with just a single indicator for signals.
- Customizable lookback periods suit different products.
Risk Analysis
There are also some risks to consider:
- Sensitivity to parameters with multiple integrated timeframes.
- May overlook other factors by only considering momentum.
- Potential lag requires optimized entry and exit.
- Stop loss still necessary during high volatility.
To mitigate risks, stop losses should be utilized along with optimization of the DRCMI parameters and incorporation of additional technical indicators.
Optimization Directions
Some ways to improve the strategy:
- Optimize DRCMI parameters like periods and weights.
- Incorporate trend indicators to dynamically adjust parameters based on market regime.
- Implement dynamic stops to lock in profits.
- Consider intermarket relationships with correlation analysis to construct spreads.
Conclusion
This strategy generates trading signals by condensing momentum from multiple timeframes into the DRCMI indicator. It is simple yet effective in profiting from momentum swings. However, parameter tuning and stop loss implementation requires further optimization, and combining DRCMI with additional technical indicators can improve performance.
[/trans]
Strategy Arguments
| Argument | Default | Description |
|---|---|---|
| v_input_1 | false | Trade reverse |
Source (PineScript)
/*backtest
start: 2023-10-23 00:00:00
end: 2023-11-22 00:00:00
period: 1h
basePeriod: 15m
exchanges: [{"eid":"Futures_Binance","currency":"BTC_USDT"}]
*/

//@version=2
////////////////////////////////////////////////////////////
//  Copyright by HPotter v1.0 20/09/2017
// This indicator really is the KST indicator presented by Martin Pring.
// the KST indicator is a weighted summed rate of change oscillator that
// is designed to identify meaningful turns. Various smoothed rate of change
// indicators can be combined to form different measurements of cycles.
//
// You can change long to short in the Input Settings
// WARNING:
//  - For purpose educate only
//  - This script to change bars colors.
////////////////////////////////////////////////////////////
strategy(title="MovROC (KST indicator)", shorttitle="MovROC (KST indicator)")
reverse = input(false, title="Trade reverse")
hline(0, color=purple, linestyle=line)
xROC6 = sma(roc(close, 6), 10)
xROC10 = sma(roc(close, 10), 10)
xROC15 = sma(roc(close, 15), 9)
xROC20 = sma(roc(close, 20), 15)
nRes = xROC6 + (2 * xROC10) + (3 * xROC15) + (4 * xROC20)
pos = iff(nRes > 0, 1,
	   iff(nRes < 0, -1, nz(pos[1], 0)))
possig = iff(reverse and pos == 1, -1,
          iff(reverse and pos == -1, 1, pos))
if (possig == 1)
    strategy.entry("Long", strategy.long)
if (possig == -1)
    strategy.entry("Short", strategy.short)
barcolor(possig == -1 ? red: possig == 1 ? green : blue )
plot(nRes, color=blue, title="MovROC (KST indicator)")
Detail
https://www.fmz.com/strategy/432967
Last Modified
2023-11-23 10:37:00