
6.3 KiB
Name
双线性回归趋势跟踪策略Bilinear-Regression-Trend-Following-Strategy
Author
ChaoZhang
Strategy Description
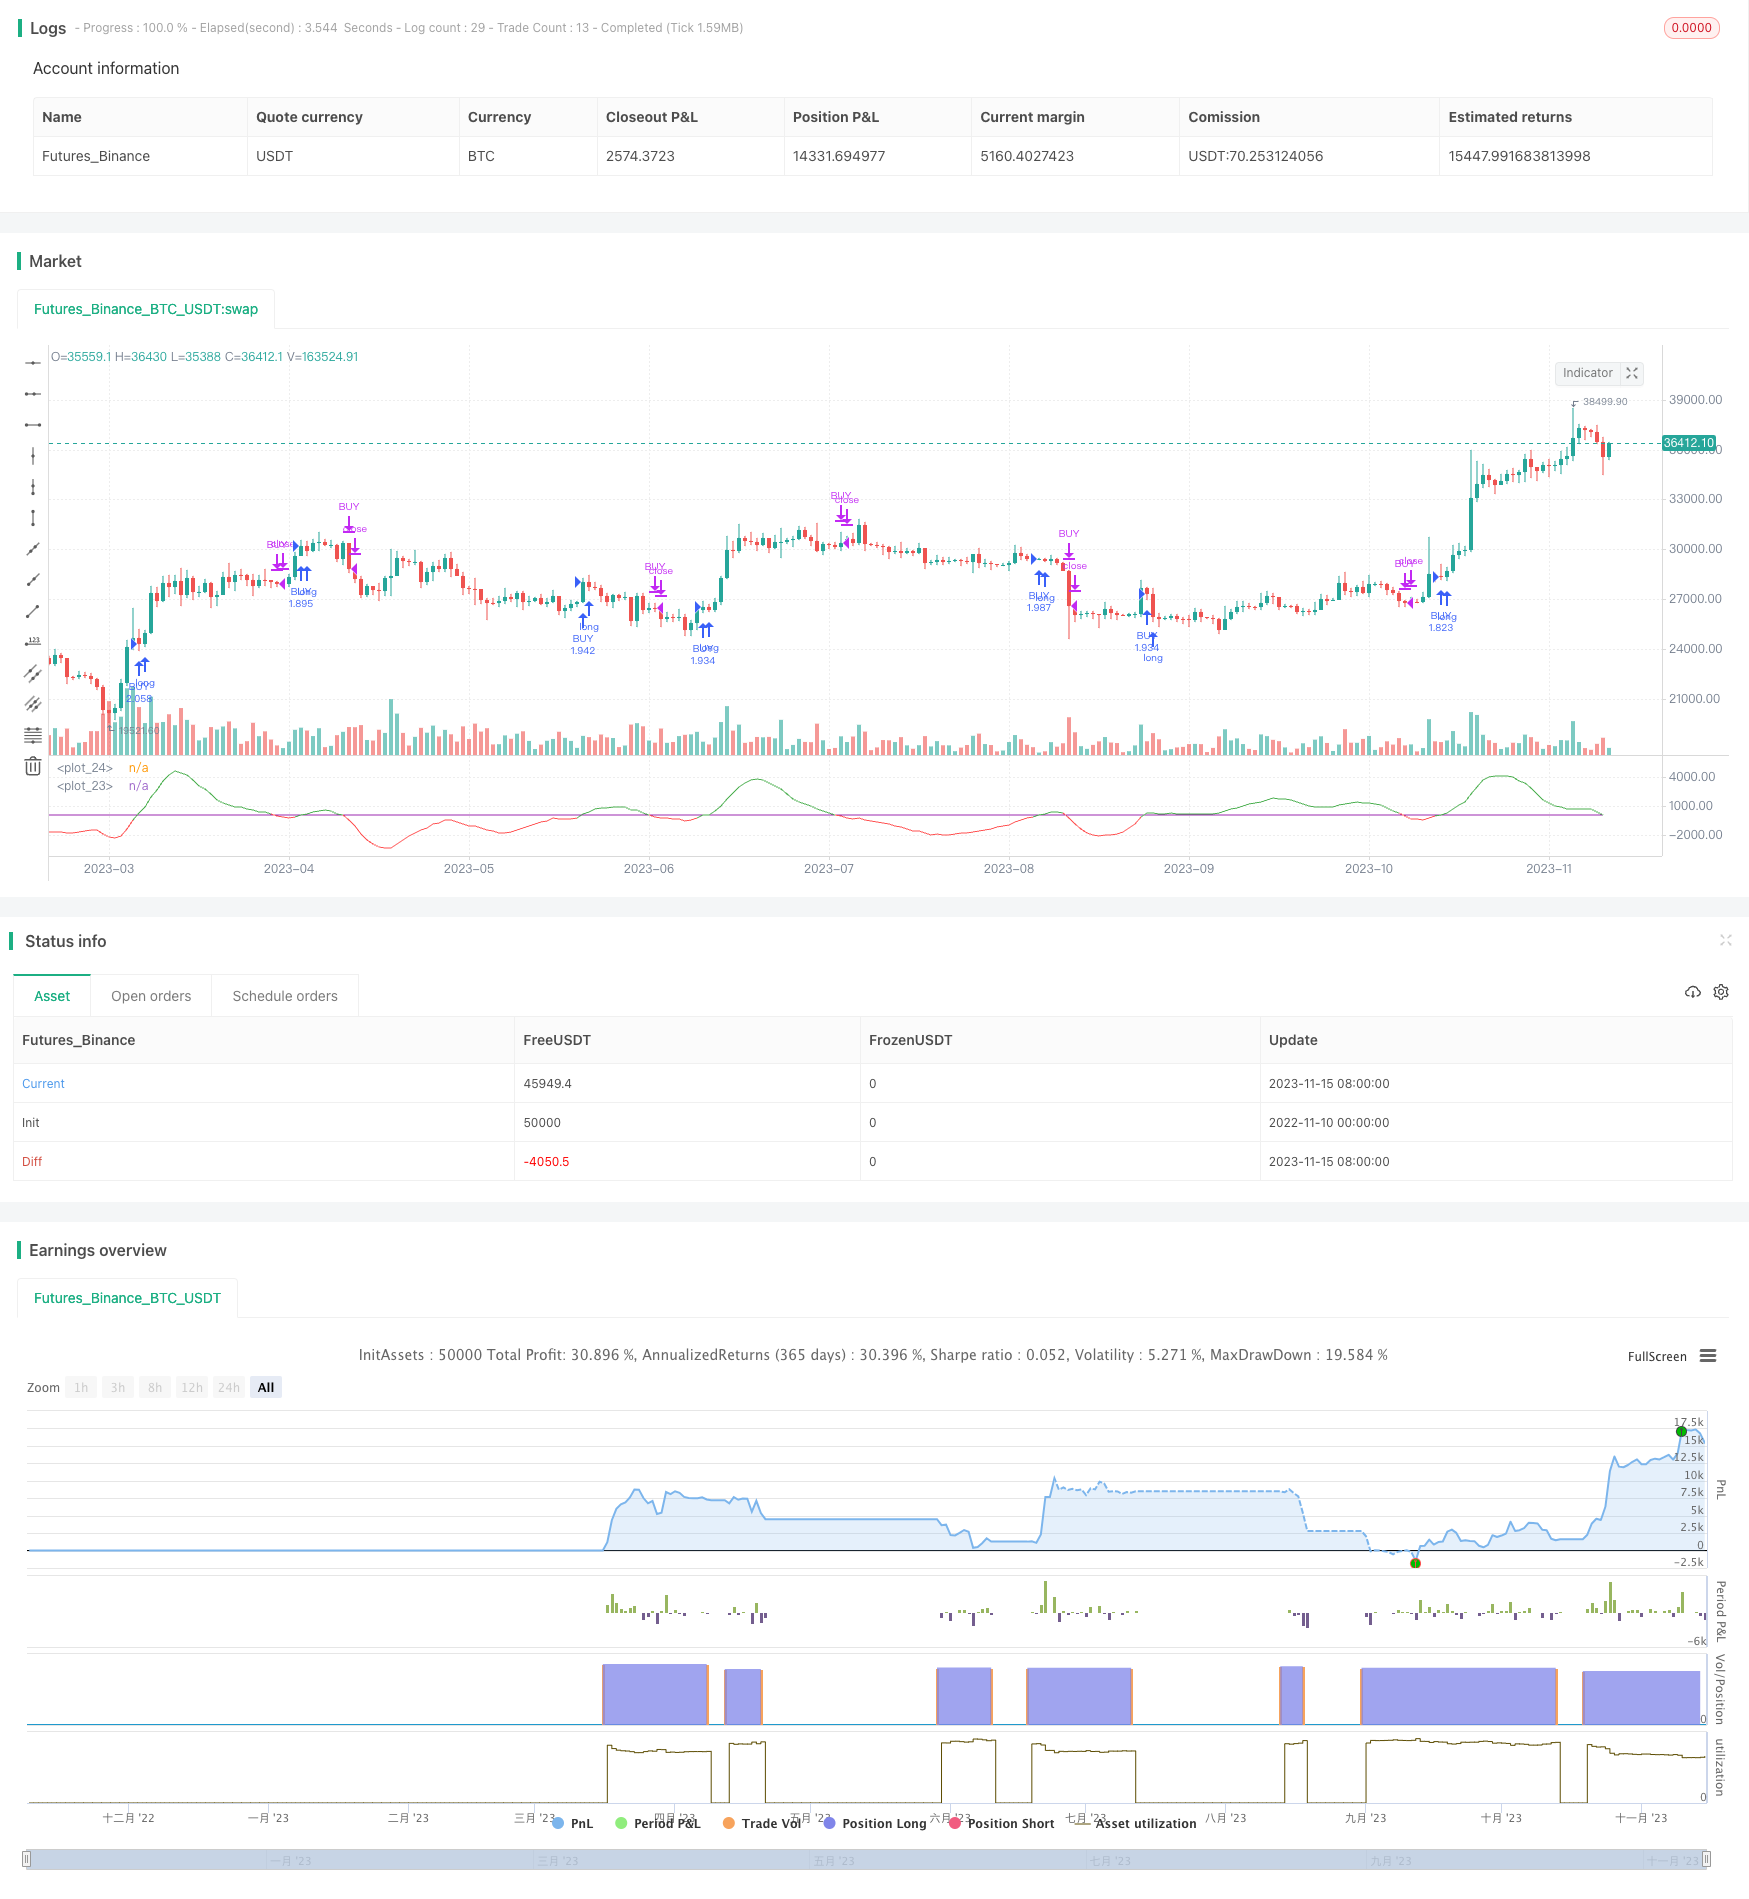 [trans]
概述
双线性回归趋势跟踪策略利用快速线性回归和慢速线性回归的差值来判断价格趋势,并以此作为入场信号。当快速线性回归上穿门限时做多,下穿门限时平仓。同时,该策略还利用EMA作为过滤条件,只有当价格高于EMA时才会入场。
策略原理
该策略首先计算两条不同周期的线性回归曲线,一条为快速线性回归,周期较短,另一条为慢速线性回归,周期较长。然后计算两条线性回归的差值,当快速线性回归高于慢速线性回归时,差值大于0,表示价格处于上升趋势;当快速线性回归低于慢速线性回归时,差值小于0,表示价格处于下降趋势。
策略以差值线穿过门限值作为买入信号,以差值线跌破门限值为平仓信号。同时,要求价格高于200周期的EMA,这是为了过滤掉非趋势行情。
优势分析
-
利用双线性回归捕捉价格趋势,回测效果较好。
-
增加EMA过滤,可以过滤掉部分非趋势行情,避免错信号。
-
策略逻辑简单清晰,容易理解和实现。
风险分析
-
线性回归周期设置不当,可能导致产生大量噪音信号。
-
强势趋势行情中,EMA过滤可能错过部分机会。
-
震荡行情中容易产生频繁交易和亏损。
解决方法:
-
优化线性回归周期参数,降低噪音。
-
可根据市场情况动态调整EMA周期。
-
增加止损来控制亏损。
策略优化
该策略可以从以下几个方面进行优化:
-
优化快速线性回归和慢速线性回归的周期参数,找到最佳参数组合。
-
尝试其他过滤指标代替EMA,如布林带、KDJ等,看是否可以提高策略效果。
-
增加动态止损来控制风险,防止亏损扩大。
-
结合股票选择机制,选择趋势性较强的个股进行交易。
-
开发参数自适应功能,根据市场状态自动调整参数。
总结
双线性回归趋势跟踪策略整体来说较为简单直接,利用双线性回归差值判断价格趋势,并以EMA作为过滤指标,可以有效跟踪趋势行情。但该策略也存在一定风险,需要关注参数优化、止损控制等方面,才能发挥策略最大效果。
||
Overview
The Bilinear Regression Trend Following strategy uses the difference between fast and slow linear regression to determine price trends and uses it as entry signals. It goes long when the fast linear regression crosses above the threshold and exits when it crosses below. It also uses EMA as a filter to only enter when price is above EMA.
Strategy Logic
The strategy first calculates two linear regression lines with different periods, one fast with shorter period and one slow with longer period. Then it calculates the difference between the two, when fast regression is above slow regression, the difference is positive, indicating an uptrend. When fast is below slow, the difference is negative, indicating a downtrend.
The strategy enters long when the difference line crosses above the threshold and exits when it crosses below. It also requires price to be above 200-period EMA to filter out non-trending moves.
Advantage Analysis
-
Dual linear regression can capture price trends well.
-
EMA filter eliminates some false signals from non-trending moves.
-
Simple and clear logic, easy to understand and implement.
Risk Analysis
-
Improper LR periods may generate excessive noise.
-
EMA filter may miss opportunities in strong trends.
-
Prone to whipsaws and losses in ranging markets.
Solutions:
-
Optimize LR periods to reduce noise.
-
Dynamically adjust EMA period based on market conditions.
-
Add stop loss to control losses.
Optimization
The strategy can be optimized in the following aspects:
-
Optimize fast and slow LR periods to find best combination.
-
Try other filters like Bollinger Bands, KDJ instead of EMA.
-
Add dynamic stop loss to control risks.
-
Combine with stock picking to select trending stocks.
-
Develop adaptive parameters based on market conditions.
Summary
The Bilinear Regression strategy is simple and direct in capturing trends with dual linear regression and EMA filter. But it also has risks that need to be addressed through parameter optimization, stop loss, etc. When properly tuned, it can effectively trade trending markets.
[/trans]
Strategy Arguments
| Argument | Default | Description |
|---|---|---|
| v_input_1 | 2017 | Start Year |
| v_input_2 | 12 | Month |
| v_input_3 | 17 | Day |
| v_input_4 | 9999 | End Year |
| v_input_5 | true | Month |
| v_input_6 | true | Day |
| v_input_7 | 13 | Fast LR |
| v_input_8 | 55 | Slow LR |
| v_input_9 | false | Lag for fast |
| v_input_10 | false | Lag for slow |
| v_input_11 | false | Threshold |
Source (PineScript)
/*backtest
start: 2022-11-10 00:00:00
end: 2023-11-16 00:00:00
period: 1d
basePeriod: 1h
exchanges: [{"eid":"Futures_Binance","currency":"BTC_USDT"}]
*/

// This source code is subject to the terms of the Mozilla Public License 2.0 at https://mozilla.org/MPL/2.0/
// © TradingAmmo

//@version=4
strategy("Linear trend", overlay=false, default_qty_type=strategy.percent_of_equity, default_qty_value=100, commission_type=strategy.commission.percent, commission_value=0.075, currency='USD')
startP = timestamp(input(2017, "Start Year"), input(12, "Month"), input(17, "Day"), 0, 0)
end   = timestamp(input(9999, "End Year"),   input(1, "Month"),   input(1, "Day"),   0, 0)
_testPeriod() =>
    iff(time >= startP and time <= end, true, false)

src = close
len1 = input(defval=13, minval=1, title="Fast LR")
len2 = input(defval=55, minval=1, title="Slow LR")

lag1 = input(0, title="Lag for fast")
lag2 = input(0, title="Lag for slow")

threshold  = input(0,step=0.5, title="Threshold")

fast_lr = linreg(src, len1, lag1)
slow_lr = linreg(src, len2, lag2)
lr = fast_lr - slow_lr
plot_fast = plot(lr, color = lr > 0 ? color.green : color.red)
plot(threshold, color=color.purple)

long_condition = crossover(lr, threshold) and close > ema(close, 200) and _testPeriod()
strategy.entry('BUY', strategy.long, when=long_condition)

short_condition = crossunder(lr, threshold)
strategy.close('BUY', when=short_condition)
Detail
https://www.fmz.com/strategy/432416
Last Modified
2023-11-17 16:51:33