
9.6 KiB
Name
双移动平均线交叉策略-Dual-Moving-Average-Crossover-Strategy
Author
ChaoZhang
Strategy Description
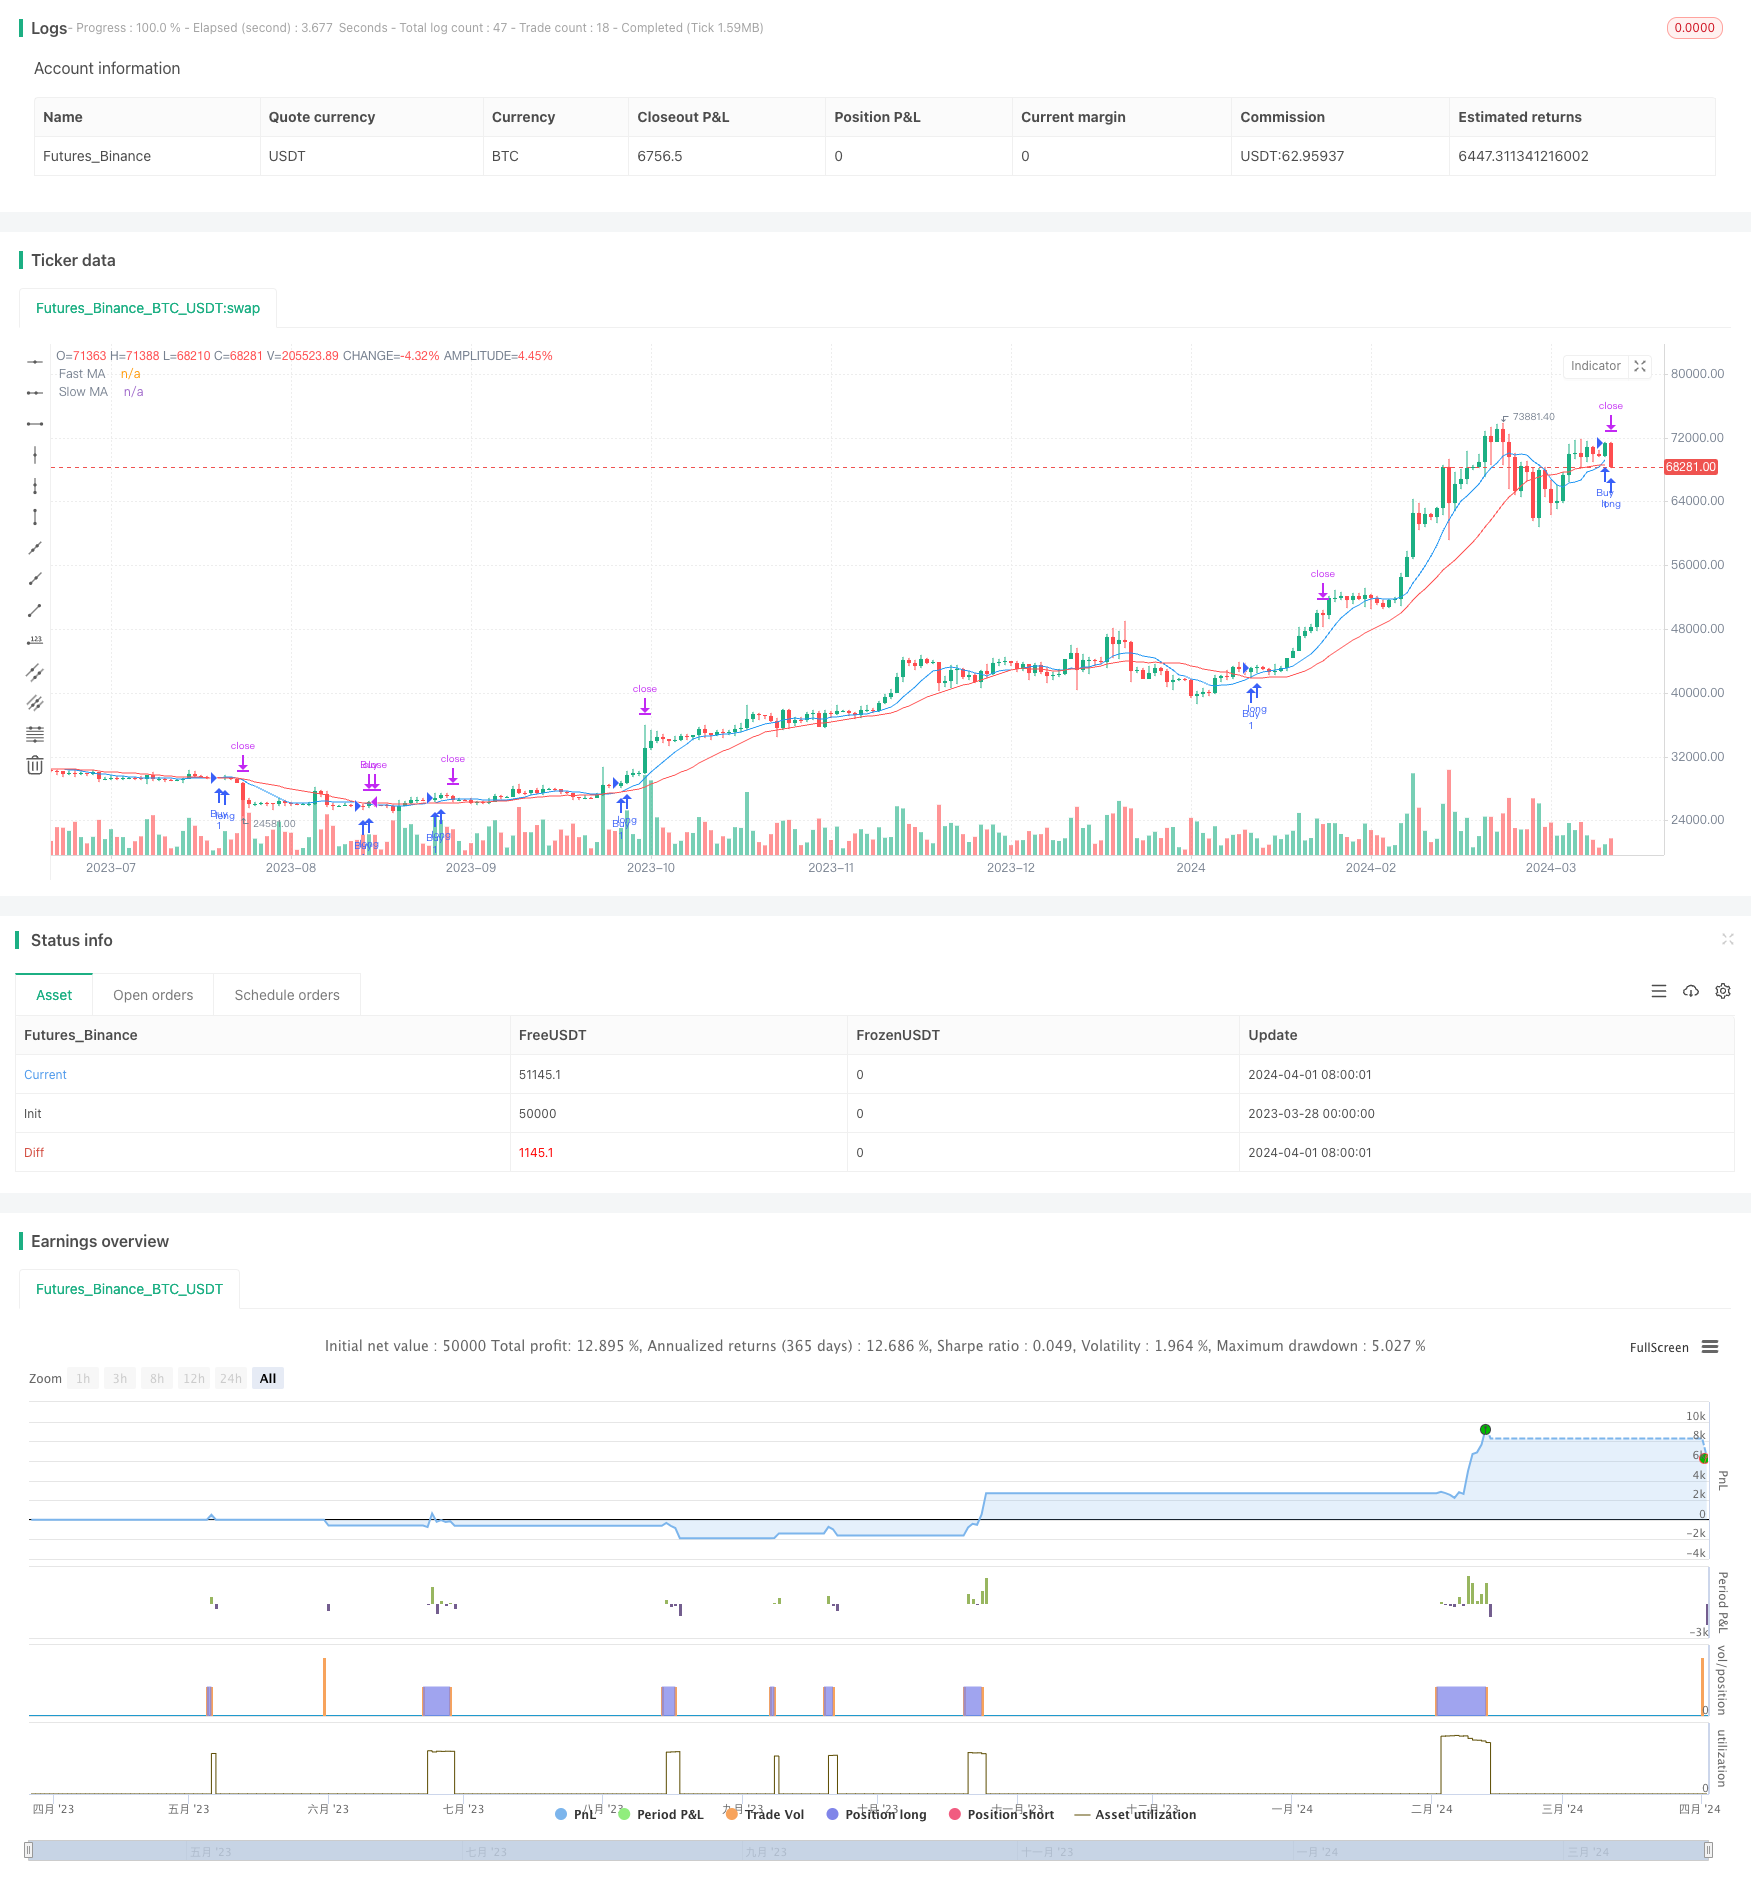
[trans]
概述
该策略使用两条不同周期的移动平均线(快线和慢线)来产生交易信号。当快线从下向上穿越慢线时,产生买入信号;当快线从上向下穿越慢线时,产生卖出信号。该策略同时设置了止损和止盈水平,用于控制风险和锁定利润。
策略原理
该策略的核心原理是利用移动平均线的趋势跟踪特性。移动平均线能够平滑价格波动,反映价格的主要趋势。短期移动平均线对价格变化更敏感,而长期移动平均线则反应更加缓慢。当短期移动平均线与长期移动平均线发生交叉时,意味着价格趋势可能发生了改变。
具体来说,当快线(短期移动平均线)从下向上穿越慢线(长期移动平均线)时,表明上升趋势可能开始,此时产生买入信号;反之,当快线从上向下穿越慢线时,表明下降趋势可能开始,此时产生卖出信号。同时,该策略设置了2%的止损和10%的止盈,以控制风险和锁定利润。
策略优势
-
简单易懂:该策略逻辑清晰,易于理解和实现。只需计算两条不同周期的移动平均线,并判断其交叉关系即可产生交易信号。
-
趋势跟踪:移动平均线策略的核心优势在于其趋势跟踪能力。通过快慢两条均线的交叉,可以较好地捕捉价格趋势的变化,并及时调整交易头寸。
-
风险控制:该策略设置了明确的止损和止盈水平,能够有效控制单笔交易的风险敞口。一旦价格触及止损或止盈水平,策略会自动平仓,避免了过大的损失或利润回吐。
策略风险
-
参数选择:该策略的表现很大程度上取决于快慢均线的周期选择。不同的周期组合可能导致不同的交易结果。如何选择最优的参数组合是该策略面临的主要风险之一。
-
震荡市:在震荡市场中,价格波动频繁但缺乏明显趋势。此时,快慢均线可能会频繁交叉,产生大量的交易信号,导致过度交易和高昂的交易成本。
-
滞后性:移动平均线是一个滞后指标,它对价格变化的反应存在一定的延迟。这意味着该策略可能会错过一些早期的趋势机会,或在趋势反转时及时平仓。
策略优化方向
-
参数优化:可以通过对不同周期组合进行回测,找出历史表现最优的参数设置。这需要在样本内和样本外数据上进行全面的测试和验证。
-
趋势过滤:为了减少震荡市中的过度交易,可以引入趋势过滤指标,如ADX或者ParabolicSAR等。只有在趋势明显时才进行交易,避免在区间市交易。
-
动态止损:固定百分比止损可能并不适用于所有市场环境。可以考虑引入动态止损机制,如ATR止损或者跟踪止损,让止损水平随着市场波动而动态调整。
-
组合优化:可以将该策略与其他无关策略进行组合,以提高整体回报和稳定性。通过合理的仓位配置和风险管理,可以在保证高胜率的同时,提升整体收益水平。
总结
双移动平均线交叉策略是一个简单易用的趋势跟踪策略。通过快慢均线的交叉关系产生交易信号,同时设置了固定的止损止盈水平控制风险。尽管该策略易于理解和实现,但其表现很大程度上取决于参数选择,并且在震荡市中面临过度交易的风险。通过参数优化、趋势过滤、动态止损和策略组合等方法,可以进一步提升该策略的稳健性和盈利能力,使其成为一个值得信赖的量化交易工具。
||
Overview
This strategy uses two moving averages with different periods (fast and slow) to generate trading signals. When the fast MA crosses above the slow MA, it generates a buy signal; when the fast MA crosses below the slow MA, it generates a sell signal. The strategy also sets stop loss and take profit levels to control risk and lock in profits.
Strategy Principle
The core principle of this strategy is to utilize the trend-following characteristic of moving averages. Moving averages can smooth out price fluctuations and reflect the main trend of prices. The short-term moving average is more sensitive to price changes, while the long-term moving average reacts more slowly. When the short-term moving average crosses the long-term moving average, it indicates that the price trend may have changed.
Specifically, when the fast MA (short-term moving average) crosses above the slow MA (long-term moving average), it suggests that an upward trend may begin, generating a buy signal; conversely, when the fast MA crosses below the slow MA, it suggests that a downward trend may begin, generating a sell signal. At the same time, the strategy sets a 2% stop loss and a 10% take profit to control risk and lock in profits.
Strategy Advantages
-
Simple and easy to understand: The logic of this strategy is clear and easy to understand and implement. It only requires calculating two moving averages with different periods and judging their crossover relationship to generate trading signals.
-
Trend tracking: The core advantage of the moving average strategy lies in its trend tracking ability. By using the crossover of fast and slow MAs, it can capture changes in price trends and adjust trading positions in a timely manner.
-
Risk control: The strategy sets explicit stop loss and take profit levels, which can effectively control the risk exposure of a single trade. Once the price reaches the stop loss or take profit level, the strategy will automatically close the position, avoiding excessive losses or profit givebacks.
Strategy Risks
-
Parameter selection: The performance of this strategy largely depends on the selection of fast and slow MA periods. Different period combinations may lead to different trading results. How to choose the optimal parameter combination is one of the main risks faced by this strategy.
-
Choppy market: In a choppy market, prices fluctuate frequently but lack clear trends. At this time, fast and slow MAs may cross frequently, generating a large number of trading signals, leading to overtrading and high trading costs.
-
Lag: Moving averages are lagging indicators, and their reaction to price changes has a certain delay. This means that the strategy may miss some early trend opportunities or fail to close positions in a timely manner when the trend reverses.
Strategy Optimization Directions
-
Parameter optimization: By backtesting different period combinations, we can find the parameter settings with the best historical performance. This requires comprehensive testing and validation on in-sample and out-of-sample data.
-
Trend filtering: To reduce overtrading in choppy markets, trend filtering indicators such as ADX or ParabolicSAR can be introduced. Trades are only made when the trend is obvious, avoiding trading in rangebound markets.
-
Dynamic stop loss: Fixed percentage stop loss may not be suitable for all market environments. Dynamic stop loss mechanisms, such as ATR stop loss or trailing stop loss, can be considered, allowing the stop loss level to adjust dynamically with market volatility.
-
Portfolio optimization: This strategy can be combined with other uncorrelated strategies to improve overall returns and stability. Through reasonable position sizing and risk management, the overall profitability can be improved while ensuring a high win rate.
Summary
The dual moving average crossover strategy is a simple and easy-to-use trend-following strategy. It generates trading signals based on the crossover relationship of fast and slow MAs while setting fixed stop loss and take profit levels to control risk. Although the strategy is easy to understand and implement, its performance largely depends on parameter selection and faces the risk of overtrading in choppy markets. Through parameter optimization, trend filtering, dynamic stop loss, and strategy combination, the robustness and profitability of this strategy can be further improved, making it a trustworthy quantitative trading tool. [/trans]
Strategy Arguments
| Argument | Default | Description |
|---|---|---|
| v_input_1 | 9 | Fast MA Length |
| v_input_2 | 21 | Slow MA Length |
| v_input_3 | 0.02 | Stop Loss (%) |
| v_input_4 | 0.1 | Take Profit (%) |
Source (PineScript)
/*backtest
start: 2023-03-28 00:00:00
end: 2024-04-02 00:00:00
period: 1d
basePeriod: 1h
exchanges: [{"eid":"Futures_Binance","currency":"BTC_USDT"}]
*/

// This Pine Script™ code is subject to the terms of the Mozilla Public License 2.0 at https://mozilla.org/MPL/2.0/
// © uugankhuu

//@version=5
strategy("Moving Average Crossover Strategy", overlay=true)

// Define length for fast and slow moving averages
fastLength = input(9, title="Fast MA Length")
slowLength = input(21, title="Slow MA Length")

// Calculate moving averages
fastMA = ta.sma(close, fastLength)
slowMA = ta.sma(close, slowLength)

// Generate buy and sell signals
buySignal = ta.crossover(fastMA, slowMA)
sellSignal = ta.crossunder(fastMA, slowMA)

// Plot moving averages
plot(fastMA, color=color.blue, title="Fast MA")
plot(slowMA, color=color.red, title="Slow MA")

// Execute trades based on signals
strategy.entry("Buy", strategy.long, when=buySignal)
strategy.close("Buy", when=sellSignal)

// Set stop loss and take profit levels
stopLoss = input(0.02, title="Stop Loss (%)") // 2% stop loss
takeProfit = input(0.10, title="Take Profit (%)") // 10% take profit

strategy.exit("Take Profit/Stop Loss", "Buy", stop=close * (1 - stopLoss), limit=close * (1 + takeProfit))
Detail
https://www.fmz.com/strategy/446963
Last Modified
2024-04-03 15:12:10