
8.0 KiB
Name
双移动均线趋势跟踪策略Dual-Moving-Average-Trend-Following-Strategy
Author
ChaoZhang
Strategy Description
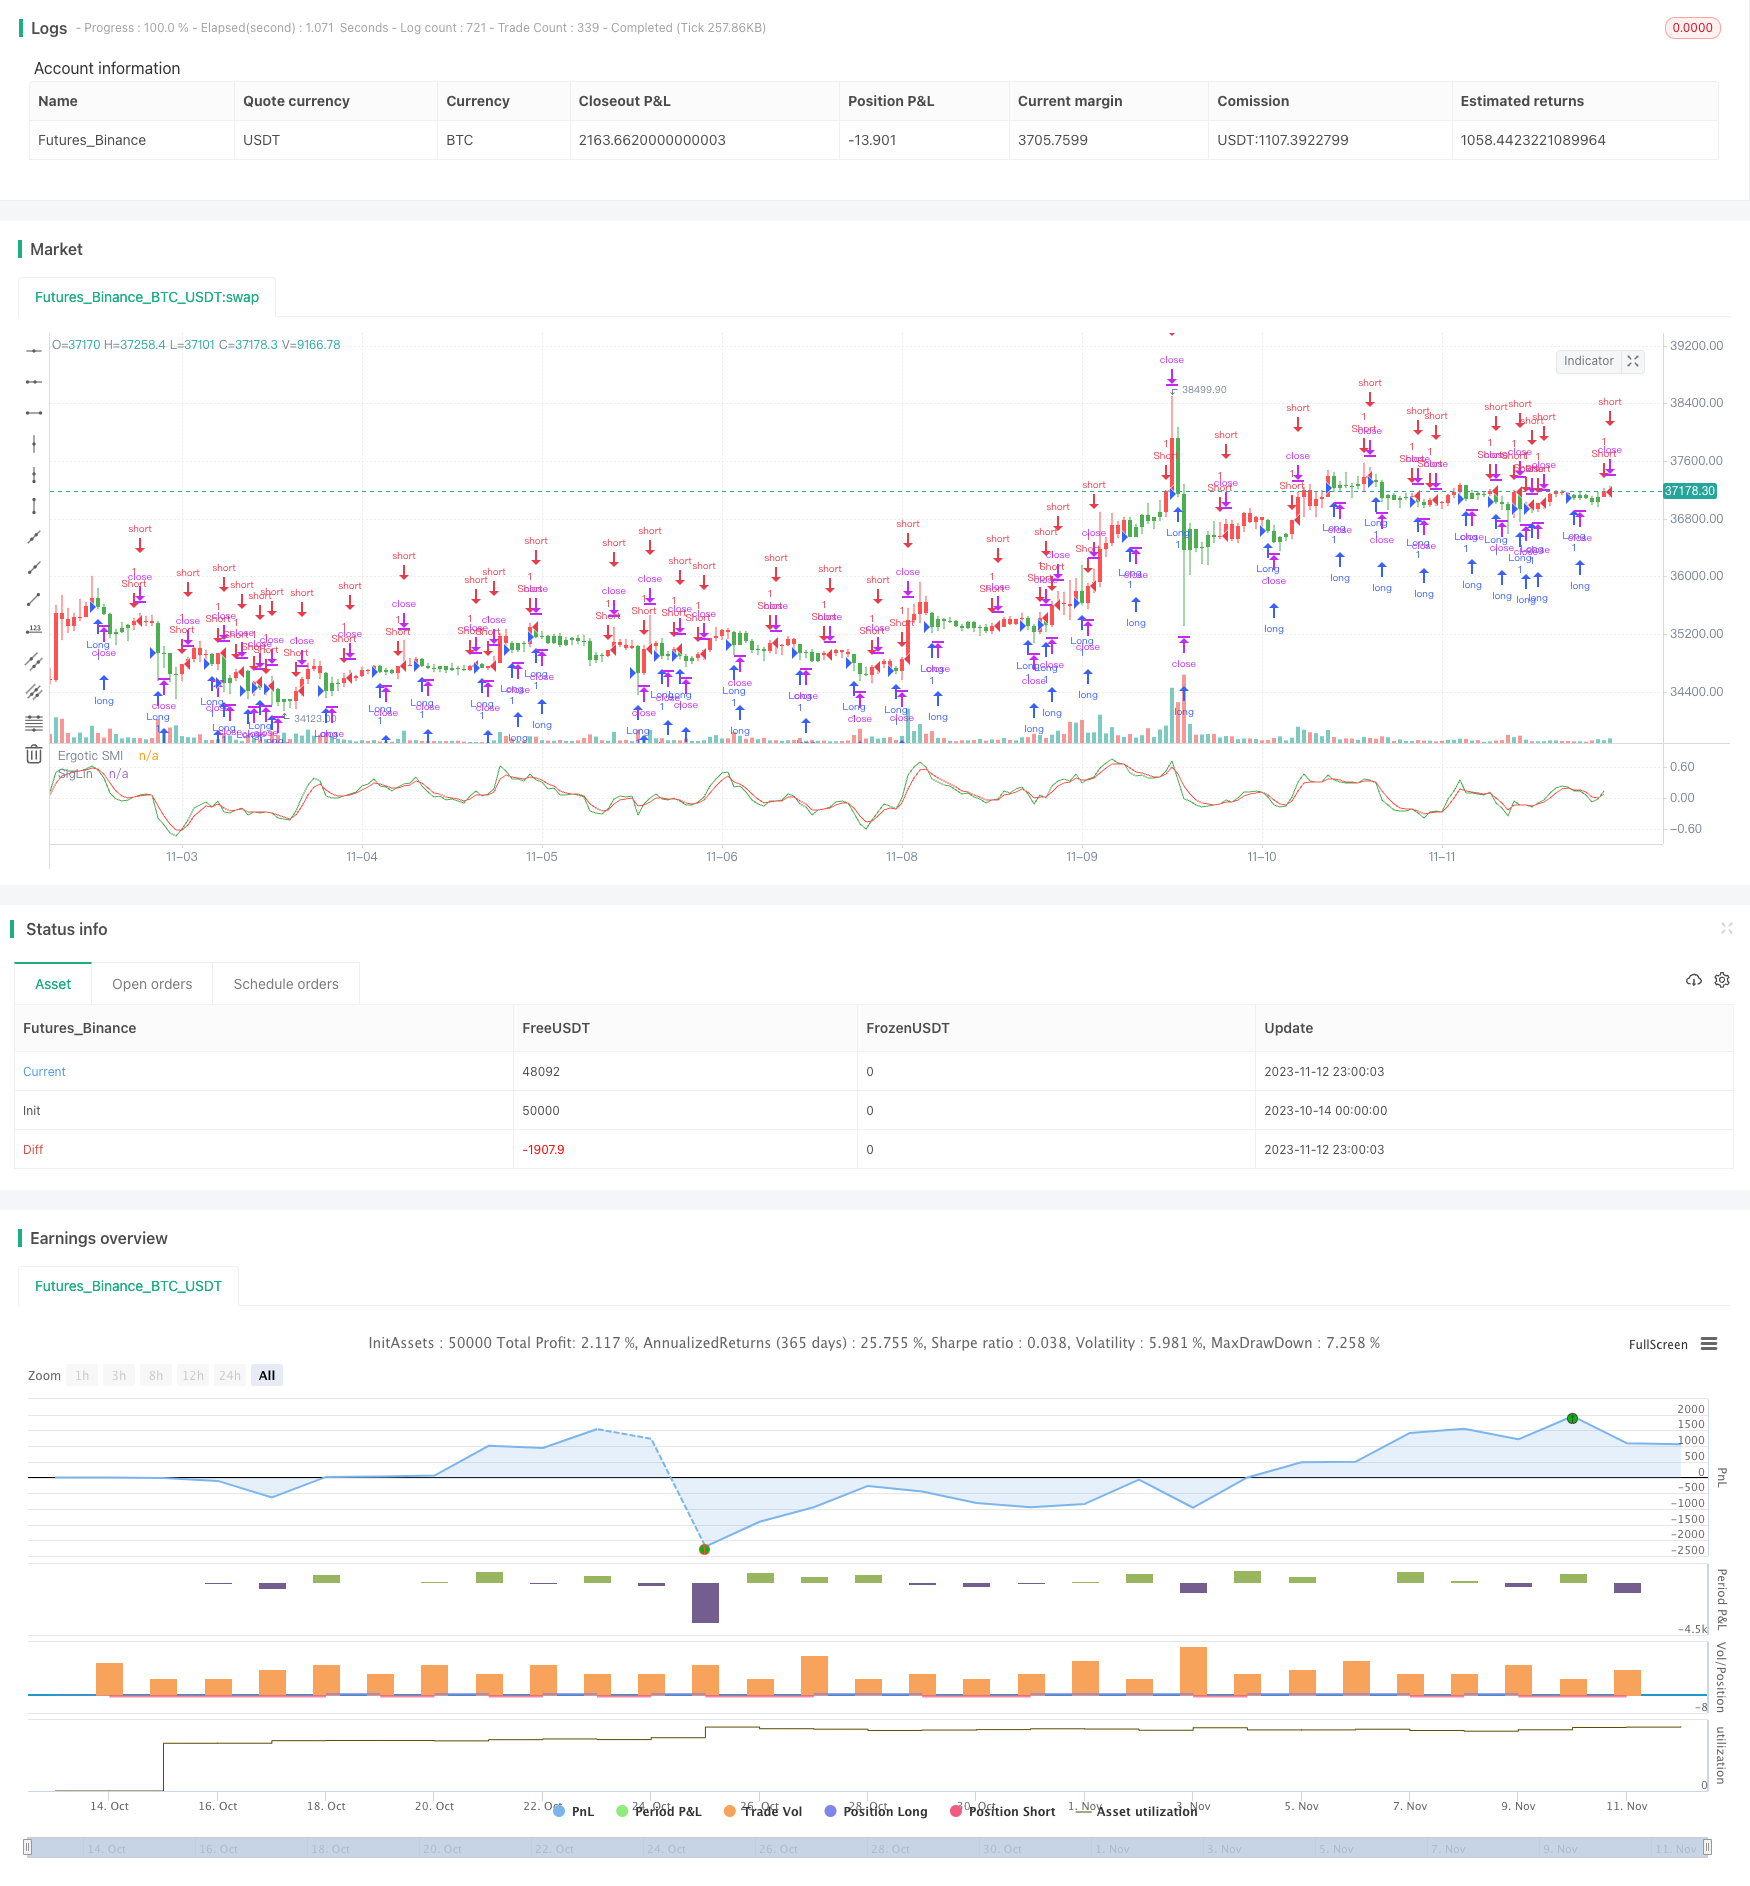 [trans]
概述
双移动均线趋势跟踪策略通过计算价格的双重指数移动平均线,形成快线和慢线,根据两线的交叉形态判断价格趋势,实现趋势跟踪交易。该策略属于基于趋势跟踪的量化交易策略。
策略原理
该策略首先计算价格的双重指数移动平均线,包括快速线和慢速线。快速线参数为4周期,慢速线参数为8周期。两线交叉时产生买入和卖出信号。当快线从下方上穿慢线时,产生买入信号;当快线从上方下穿慢线时,产生卖出信号。此外,该策略还计算MACD指标,以发散红色柱线作为卖出信号,聚合绿色柱线作为买入信号。综合双移动均线交叉和MACD指标,可以判断价格趋势方向,实现趋势跟踪交易。
优势分析
该策略首先可以顺应价格趋势进行交易,避免 Transaction Costs。其次,双移动均线过滤掉价格的部分噪音,能够顺利把握价格趋势。再者,该策略参数优化灵活,移动均线周期和MACD参数都可以进行调整,适应不同品种和参数。最后,策略逻辑简单清晰,容易理解和实现,适合量化交易的算法设计。
风险分析
该策略依赖参数优化,如果参数设置不当,将产生大量错误信号。此外,双移动均线具有滞后性,可能错过价格转折点位。另外,趋势交易容易形成“追高杀跌”的模式,存在一定的风险。此外,交易品种的流动性和手续费也会影响策略收益。为降低风险,可以适当优化参数,结合其他指标过滤信号,控制仓位规模。
优化方向
该策略可以从以下几个方面进行优化:
-
优化双移动均线的周期参数,寻找最佳参数组合
-
增加其他指标过滤信号,例如RSI,KD等,提高信号质量
-
增加止损策略,在趋势反转时及时止损
-
根据市场情况动态调整仓位大小,控制风险
-
针对不同交易品种参数进行优化
-
结合高级策略,如机器学习等提升策略效果
总结
本策略整体来说是一个基于双移动均线的简单趋势跟踪策略。策略思路清晰,易于实现,参数调整灵活,适合作为量化交易的入门策略。但该策略存在追涨杀跌、信号滞后等问题,需要进一步优化来控制风险,提高稳定性。总体而言,本策略为初学者提供了一个学习算法交易的好机会,也为高级策略打下基础。
||
Overview
The dual moving average trend following strategy calculates the double exponential moving averages of the price to form fast and slow lines. It identifies price trends based on the crossover of the two lines to implement trend following trading. This strategy belongs to quantitative trading strategies based on trend following.
Strategy Logic
The strategy first calculates the double exponential moving averages of the price, including fast and slow lines. The fast line has a period of 4, and the slow line has a period of 8. Trading signals are generated when the two lines cross. When the fast line crosses above the slow line, a buy signal is generated. When the fast line crosses below the slow line, a sell signal is triggered. In addition, the strategy also calculates the MACD indicator to provide additional trading signals. Diverging red MACD bars are sell signals, while converging green bars are buy signals. By combining the crossover of dual moving averages and MACD indicator, the strategy identifies price trend directions for trend following trading.
Advantage Analysis
Firstly, this strategy trades along the price trend to avoid transaction costs. Secondly, the dual moving averages filter out some price noises and capture the price trend smoothly. Also, the flexible parameter optimization of the moving averages and MACD makes the strategy adaptable to different products and environments. Finally, the simple and clear logic makes this strategy easy to understand and implement, suitable for quantitative trading algorithm design.
Risk Analysis
The strategy relies heavily on parameter optimization. Improper parameter settings may generate many false signals. Additionally, the lagging nature of dual moving averages may cause missed turning points. Trend following strategies are also prone to chasing uptrends and killing downtrends, which poses certain risks. Moreover, the liquidity of the trading products and transaction costs will also affect the strategy's profitability. To mitigate risks, parameters can be optimized, additional filters can be added, and position sizing can be controlled.
Improvement Directions
The following aspects of the strategy can be improved:
-
Optimize the periods of the dual moving averages to find the optimal combination.
-
Add other indicators like RSI and KD to filter signals and improve quality.
-
Incorporate stop loss strategies to exit trades at trend reversals.
-
Dynamically adjust position sizing based on market conditions to control risk.
-
Optimize parameters for different trading products.
-
Incorporate advanced strategies like machine learning to improve performance.
Conclusion
In summary, this is a simple dual moving average trend following strategy. The strategy logic is straightforward and easy to implement. The flexible parameter tuning makes it suitable as an introductory quantitative trading strategy. However, the risks of chasing trends and signal lagging need to be addressed through further enhancements to improve stability and risk control. Overall, this strategy provides a great learning opportunity for beginners and establishes a foundation for advanced strategies.
[/trans]
Strategy Arguments
| Argument | Default | Description |
|---|---|---|
| v_input_1 | 4 | fastPeriod |
| v_input_2 | 8 | slowPeriod |
| v_input_3 | 3 | SmthLen |
| v_input_4 | 0.5 | TopBand |
| v_input_5 | -0.5 | LowBand |
| v_input_6 | false | Trade reverse |
Source (PineScript)
/*backtest
start: 2023-10-14 00:00:00
end: 2023-11-13 00:00:00
period: 1h
basePeriod: 15m
exchanges: [{"eid":"Futures_Binance","currency":"BTC_USDT"}]
*/

//@version=2
////////////////////////////////////////////////////////////
//  Copyright by HPotter v1.0 12/11/2017
// The SMI Ergodic Indicator is the same as the True Strength Index (TSI) developed by
// William Blau, except the SMI includes a signal line. The SMI uses double moving averages
// of price minus previous price over 2 time frames. The signal line, which is an EMA of the
// SMI, is plotted to help trigger trading signals. Adjustable guides are also given to fine
// tune these signals. The user may change the input (close), method (EMA), period lengths
// and guide values.
// You can use in the xPrice any series: Open, High, Low, Close, HL2, HLC3, OHLC4 and ect...
//
// WARNING:
// - For purpose educate only
////////////////////////////////////////////////////////////
strategy(title="SMI Ergodic Oscillator")
fastPeriod = input(4, minval=1)
slowPeriod = input(8, minval=1)
SmthLen = input(3, minval=1)
TopBand = input(0.5, step=0.1)
LowBand = input(-0.5, step=0.1)
reverse = input(false, title="Trade reverse")
// hline(0, color=gray, linestyle=dashed)
// hline(TopBand, color=red, linestyle=line)
// hline(LowBand, color=green, linestyle=line)
xPrice = close
xPrice1 = xPrice - xPrice[1]
xPrice2 = abs(xPrice - xPrice[1])
xSMA_R = ema(ema(xPrice1,fastPeriod),slowPeriod)
xSMA_aR = ema(ema(xPrice2, fastPeriod),slowPeriod)
xSMI = xSMA_R / xSMA_aR
xEMA_SMI = ema(xSMI, SmthLen)
pos = iff(xEMA_SMI < xSMI, -1,
	   iff(xEMA_SMI > xSMI, 1, nz(pos[1], 0)))
possig = iff(reverse and pos == 1, -1,
          iff(reverse and pos == -1, 1, pos))
if (possig == 1)
    strategy.entry("Long", strategy.long)
if (possig == -1)
    strategy.entry("Short", strategy.short)
barcolor(possig == -1 ? red: possig == 1 ? green : blue )
plot(xSMI, color=green, title="Ergotic SMI")
plot(xEMA_SMI, color=red, title="SigLin")
Detail
https://www.fmz.com/strategy/432119
Last Modified
2023-11-14 16:56:21