
9.7 KiB
Name
双漩涡指标结合真实强度指标的趋势追踪策略Trend-Tracking-Strategy-Based-on-Dual-Vortex-Indicator-Combined-with-True-Strength-Index
Author
ChaoZhang
Strategy Description
 [trans]
概述
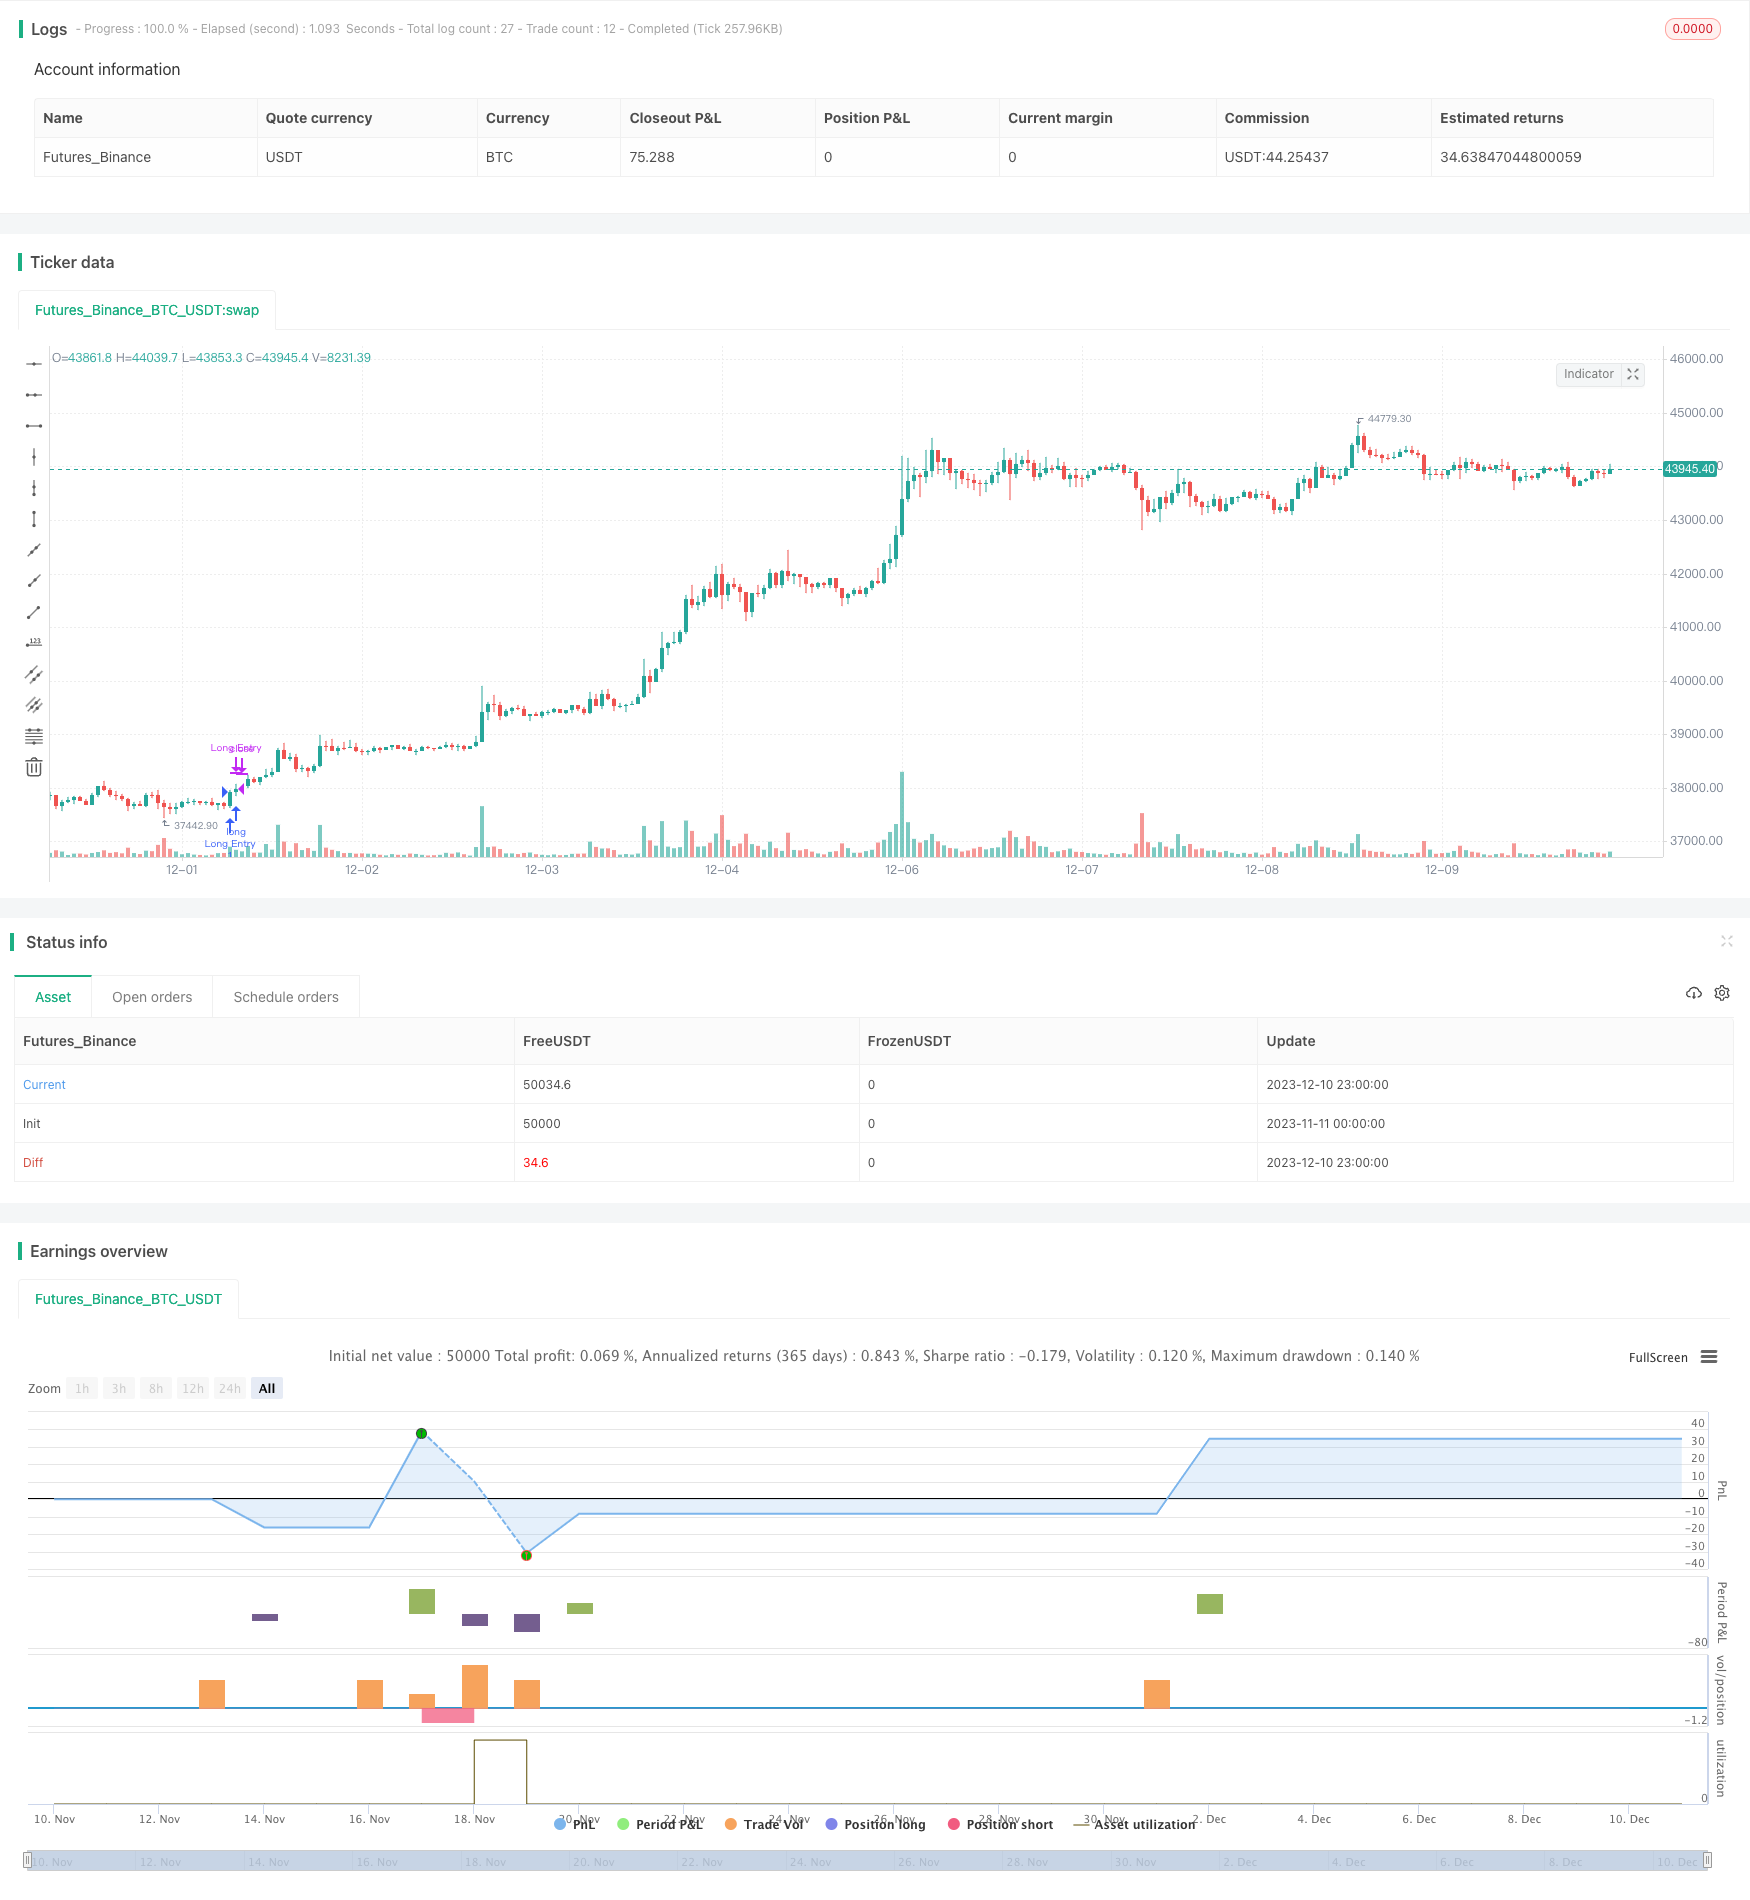
本策略名称为“双漩涡指标结合真实强度指标的趋势追踪策略”。该策略通过同时应用双漩涡指标和真实强度指标,在它们发出买入和卖出信号时开仓做多做空,并在一定波段后平仓退出,以捕捉中长线趋势。
策略原理
该策略同时使用了双漩涡指标和真实强度指标。双漩涡指标包括VI+和VI-两条线,它们反映了价格的上升和下降力度。真实强度指标包括TSI红线和TSI蓝线,衡量价格变化的力度和方向。
当VI+上涨趋势增强而VI-下跌趋势减弱时,双漩涡指标会发出做多信号。此时如果TSI蓝线也上穿红线,那么真实强度指标也会发出做多信号。当两个指标同时发出做多信号时,就打开做多头寸。
相反,当VI+上涨趋势减弱而VI-下跌趋势增强时,双漩涡指标会发出做空信号。此时如果TSI蓝线也下穿红线,那么真实强度指标也会发出做空信号。当两个指标同时发出做空信号时,就打开做空头寸。
通过这样的组合,可以在中长线趋势开始建立时打开头寸,并跟踪该趋势。当趋势结束时,指标也会发出平仓信号。因此,该策略可以有效捕捉价格中长线大趋势的行情。
策略优势分析
该策略主要有以下几个优势:
-
双重指标过滤,可以增强信号的可靠性,避免假信号。
-
采用中长线指标,可以跟踪更大的趋势行情。短线指标容易被市场噪音干扰,错过大趋势。
-
通过参数调整,可以灵活调整策略的持仓时间。可以让策略跟踪趋势的同时,也控制单笔损益。
-
兼顾趋势跟踪和风险控制。指标可以有效识别趋势,通过设置退出波段来控制风险。
策略风险分析
该策略也存在一些风险:
-
中长线持仓,容易遇到震荡行情止损。可以适当缩短退出波段,或调整止损来应对。
-
双重指标组合还是可能出现假信号的概率。可以引入其他指标进行确认,或调整参数。
-
效率较低,中长线持仓期间资金被占用。可以适当调整仓位规模来优化资金使用效率。
-
需依赖趋势行情。在震荡行情中应减少仓位规模,避免无谓损失。
策略优化方向
该策略还可以从以下几个方面进行优化:
-
增加其他指标组合,形成多重指标过滤,可进一步提高信号质量。
-
优化参数设置,使指标参数更符合不同品种的特点。
-
增加动态仓位管理机制,在趋势行情中加大仓位,震荡行情中减小仓位。
-
增加止损策略,通过移动止损、缩量止损等方式来控制风险。
-
结合波浪理论,识别更大级别的潜在趋势方向作为方向过滤条件。
-
利用机器学习方法自动优化参数和交易规则,使策略更具优化自适应性。
总结
本策略总体来说是一个优秀的中长线趋势跟踪策略。它使用双漩涡指标和真实强度指标发挥各自的技术优势,互相验证信号,可以有效识别价格中长线趋势的生成。通过适当的参数调整,可以控制单笔交易的风险。如果结合更多其他技术指标和风险控制方法进行优化,该策略可以获得更出色的效果。它适合对中长线趋势交易感兴趣的投资者。
||
Overview
This strategy is named "Trend Tracking Strategy Based on Dual Vortex Indicator Combined with True Strength Index". It opens long and short positions when the dual vortex indicator and true strength index issue buy and sell signals, and closes positions after a certain price movement to capture medium- to long-term trends.
Strategy Logic
This strategy uses both the dual vortex indicator and the true strength index (TSI). The dual vortex indicator consists of VI+ and VI- lines, reflecting the magnitude of upward and downward momentum respectively. The TSI has red and blue lines measuring the strength and direction of price changes.
When VI+ rises and VI- falls, indicating strengthening uptrend and weakening downtrend momentum, the dual vortex indicator generates a long signal. If at the same time, the TSI blue line crosses above the red line, TSI also issues a long signal. The strategy will open a long position when both indicators give out long signals simultaneously.
Conversely, when VI+ falls and VI- rises, signaling weakening upside momentum and strengthening downside momentum, the dual vortex gives out a short signal. If the TSI blue line crosses below the red line as well, the TSI produces a short signal too. The strategy then opens a short position upon receiving aligned short signals.
By combining signals from both indicators this way, the strategy is able to identify and track nascent medium- to long-term trends. Exit signals are generated when the trends end. Thus, this strategy can effectively capture large trend-following moves in the market.
Advantage Analysis
The main advantages of this strategy include:
- The dual indicator filter improves signal reliability and avoids false signals.
- Adopting medium- to long-term indicators allows catching larger trends. Short-term signals tend to be disturbed by market noise.
- Flexible adjustment of holding period through parameter tuning. This allows both trend tracking and single trade risk control.
- Balancing trend following and risk management. Indicators identify trends well. Risk is controlled by setting exit price waves.
Risk Analysis
Some risks also exist:
- Medium- to long-term holding may face whipsaw price actions for stop loss. This can be mitigated by reducing exit wave period or adjusting stop loss properly.
- Probability of false signals still exists despite the dual indicator filter. Additional indicator confirmation or parameter tuning helps.
- Relatively low capital usage efficiency because capital is held for longer holding periods. Position sizing could be adjusted to optimize fund utilization.
- Reliance on trending markets. Position sizes should be reduced in range-bound markets to avoid unnecessary losses.
Optimization Directions
Some ways to optimize the strategy include:
- Introducing more indicator combos to strengthen signal quality via multiple filtering.
- Optimizing parameters to suit different products' characteristics better.
- Adding dynamic position sizing to extend positions in trending while reducing sizes in ranging markets.
- Incorporating stop loss mechanisms like trailing stop loss and partial close stop loss to control risks.
- Combining Elliott Wave analysis to identify larger degree trends as directional filter.
- Utilizing machine learning to auto-optimize parameters and rules for enhanced adaptiveness.
Conclusion
In summary, this strategy is an excellent medium- to long-term trend following approach. By leveraging the techniques of dual vortex indicator and TSI, it can recognize emerging mid- to long-term trends reliably. With proper parameter tuning, per trade risks can be managed. Further optimizations by incorporating more indicators and risk control techniques would lead to improved performance. It suits investors interested in mid- to long-term trend trading.
[/trans]
Strategy Arguments
| Argument | Default | Description |
|---|---|---|
| v_input_1 | 25 | Long Length |
| v_input_2 | 13 | Short Length |
| v_input_3 | 13 | Signal Length |
| v_input_4 | 14 | Period |
| v_input_5 | true | Close after x bar |
Source (PineScript)
/*backtest
start: 2023-11-11 00:00:00
end: 2023-12-11 00:00:00
period: 1h
basePeriod: 15m
exchanges: [{"eid":"Futures_Binance","currency":"BTC_USDT"}]
*/

// This source code is subject to the terms of the Mozilla Public License 2.0 at https://mozilla.org/MPL/2.0/
// © hydrelev

//@version=4
strategy("Vortex TSI strategy", overlay=false)
///////////////////INDICATOR TSI
long = input(title="Long Length", type=input.integer, defval=25)
short = input(title="Short Length", type=input.integer, defval=13)
signal = input(title="Signal Length", type=input.integer, defval=13)
price = close
double_smooth(src, long, short) =>
    fist_smooth = ema(src, long)
    ema(fist_smooth, short)
pc = change(price)
double_smoothed_pc = double_smooth(pc, long, short)
double_smoothed_abs_pc = double_smooth(abs(pc), long, short)
tsi_blue = 100 * (double_smoothed_pc / double_smoothed_abs_pc)
tsi_red = ema(tsi_blue, signal)
// plot(tsi_blue, color=#3BB3E4)
// plot(tsi_red, color=#FF006E)
// hline(0, title="Zero")

/////////////////INDICATOR VI
period_ = input(14, title="Period", minval=2)
VMP = sum( abs( high - low[1]), period_ )
VMM = sum( abs( low - high[1]), period_ )
STR = sum( atr(1), period_ )
VIP_blue = VMP / STR
VIM_red = VMM / STR
// plot(VIP_blue, title="VI +", color=#3BB3E4)
// plot(VIM_red, title="VI -", color=#FF006E)

////////////////////STRATEGY
bar=input(1, title="Close after x bar", minval=1, maxval=50)

tsi_long = crossover(tsi_blue, tsi_red)
tsi_short = crossunder(tsi_blue, tsi_red)
vi_long = crossover(VIP_blue, VIM_red)
vi_short = crossunder(VIP_blue, VIM_red)

LongConditionOpen = tsi_long and vi_long ? true : false
LongConditionClose = tsi_long[bar] and vi_long[bar] ? true : false
ShortConditionOpen = tsi_short and vi_short ? true : false
ShortConditionClose = tsi_short[bar] and vi_short[bar] ? true : false

if (LongConditionOpen)
    strategy.entry("Long Entry", strategy.long)
if (LongConditionClose)
    strategy.close("Long Entry")

if (ShortConditionOpen)
    strategy.entry("Short Entry", strategy.short)
if (ShortConditionClose)
    strategy.close("Short Entry")
Detail
https://www.fmz.com/strategy/435143
Last Modified
2023-12-12 16:23:10