
15 KiB
Name
双指标组合疯狂日内scalping策略Dual-Indicators-Combo-Crazy-Intraday-Scalping-Strategy
Author
ChaoZhang
Strategy Description
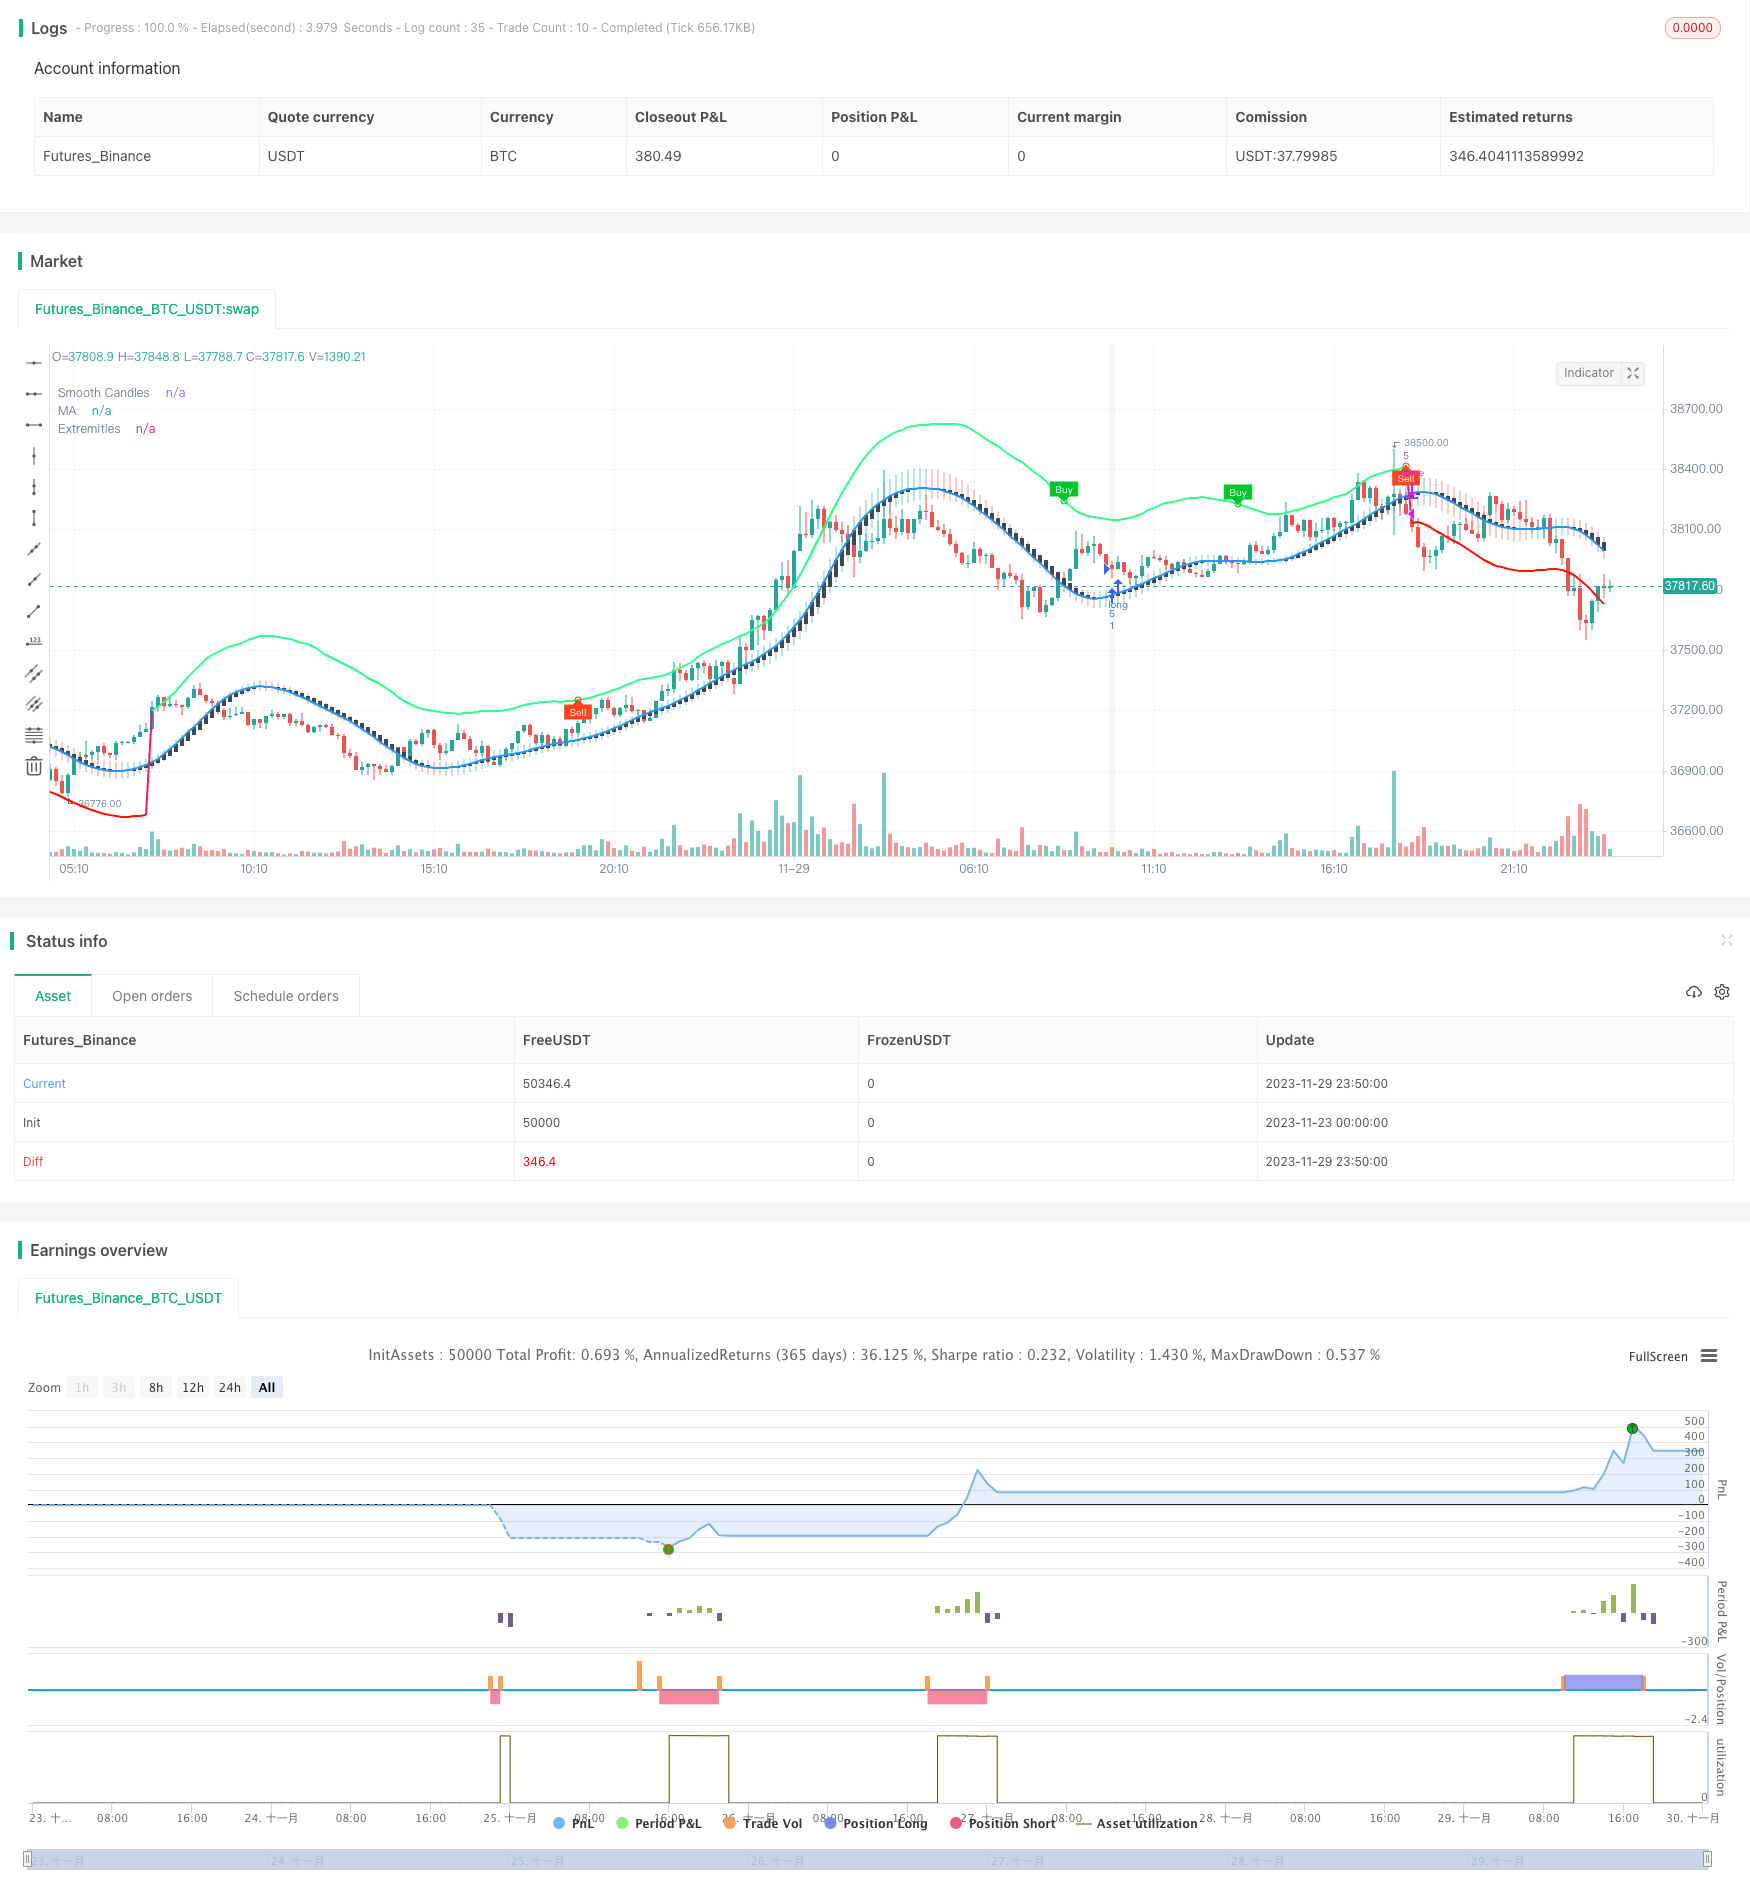
[trans]
概述
该策略将LuxAlgo开发的TMO和AMA两个指标的买卖信号进行组合,在震荡盘整理中捕捉趋势开始的机会。它会在满足TMO指标买卖信号、AMA指标买卖极值、K线实体量逐渐放大等多个条件后,做多做空。止损方式为最近N根K线的最高价最低价。
策略原理
TMO指标反映价格动量。它属于震荡指标类型,在价格出现背离时可以发出交易信号。AMA指标是一种平滑移动平均线指标。它显示价格波动的一个范围,价格接近上下轨时表示超买超卖现象。
该策略所依据的主要逻辑是:TMO指标能反映价格趋势背离提供交易信号,AMA指标能显示价格可能反转的区域,同时结合K线实体量放大来确认趋势启动。因此它们的组合可以提高交易成功率。具体来说,策略会在以下情况开仓做多或做空:
- TMO指标出现做多信号,即价格背离向上 AND AMA指标出现做多极大值
- TMO指标出现做空信号,即价格背离向下 AND AMA指标出现做空极小值
- 同时要求最近3根K线的实体量越来越大
这样它就解决了单一指标造成的假信号问题。止损方式选择了最近N根K线内最高价最低价,可以比较好地控制风险。
策略优势
该策略具有以下几个优势:
-
指标组合,提高信号准确率。TMO指标和AMA指标互相验证,可以减少假信号,从而提高信号准确率。
-
多个条件组合,捕捉趋势开始。策略所设定的TMO指标信号、AMA指标极值和K线实体量放大等多个条件,可以有效捕捉趋势开始的时机,这是Scalping策略追求的目标。
-
K线止损方式控制风险。采用K线最近最高价最低价作为止损方式,可以比较好地控制每单的风险。同时也不会因指标重新计算产生的滞后反转风险。
-
简洁有效的交易逻辑。该策略只用了两个指标就实现了比较完整的Scalping策略,不算复杂,逻辑简洁清晰。而且从示例结果来看,策略实现了不错的盈利。
策略风险
该策略主要存在以下风险:
-
频繁出入场风险。作为Scalping策略,它的持仓时间不长,如果交易费用较高,会对盈利造成一定影响。
-
K线止损过于激进风险。采用最近最高价最低价作为止损方式,可能会比较激进,无法完全过滤市场噪音,增加了止损被触发的概率。
-
参数优化困难风险。策略涉及多个参数,想找到最佳参数组合可能会比较困难。
优化方向
该策略还可以从以下几个方向进行优化:
-
添加更多过滤指标,如市场成交量,可以过滤掉一些假信号,进一步提高信号质量。
-
尝试在止损方式上增加过滤条件,避免止损过于激进。例如在触发止损前等待若干根K线确认,再止损。
-
进行参数优化,找到指标参数的最佳组合。这可能可以过滤更多噪音,提高策略胜率。主要优化TMO指标长度、AMA指标长度和倍数等参数。
-
尝试在不同品种和时间周期上进行回测和实盘,找到最匹配该策略逻辑的交易品种和周期。
总结
该策略通过组合TMO指标和AMA指标的交易信号,在震荡行情中寻找趋势开始的时机进行Scalping操盘。它具有信号准确率高、捕捉趋势早期且控制风险的优势。在进行进一步的参数和规则优化后,该策略可以成为具有很强实战价值的日内Scalping策略。
||
Overview
This strategy combines the buy and sell signals from LuxAlgo's TMO and AMA indicators to catch the beginning of a trend during range-bound consolidation. It goes long or short when the conditions of TMO signal, AMA extremities, and increasing candle body size are met. The stop loss is set at the latest swing high/low based on recent bars.
Strategy Logic
The TMO indicator reflects price momentum. It belongs to the oscillator indicator type and can generate trading signals when divergence occurs. The AMA indicator is a smoothed moving average. It shows a range of price fluctuations, indicating overbought/oversold conditions when price approaches the upper/lower band.
The main logic behind this strategy is: TMO can detect trend divergence to generate trading signals. AMA can identify price reversal zones. Together with the confirmation from increasing candle body size, they can improve the accuracy of capturing trend start. So the strategy will go long/short when:
- TMO gives buy signal, i.e. bullish divergence AND AMA shows its max extremity
- TMO gives sell signal. i.e. bearish divergence AND AMA shows its min extremity
- Also requires the most recent 3 candle's body to expand in size
This solves the false signal problem of single indicators. The stop loss based on recent bars' highest high/lowest low can control risk effectively.
Advantages
The advantages of this strategy include:
-
Indicator combo improves signal accuracy. TMO and AMA validate each other to reduce false signals and improve accuracy.
-
Multiple conditions capture trend start. The combo of TMO signal, AMA extremities and increasing candle size allows the strategy to effectively identify trend initiation, which scalping strategies pursue.
-
Candle-based stop loss manages risk. By using recent bars' highest/lowest price as stop loss, it controls the risk of each trade while avoiding the lagging risk from indicator recalculation.
-
Concise and effective logic. With just two indicators, the strategy has implemented a complete scalping system with clear and simple logic. The backtest results also look profitable.
Risks
The main risks of the strategy:
-
Frequent in-out trades risk. As a scalping strategy targeting short holding period, high trading cost can affect its profitability.
-
Aggressive stop loss risk. By using the recent extreme prices for stop loss, it may be vulnerable to market noise and increase the chance of stop loss trigger.
-
Difficult parameter optimization risk. The strategy involves multiple parameters. Finding the optimal parameter combination can be challenging.
Optimization
The strategy can be further optimized in the following areas:
-
Add more filter indicators like volume to remove false signals and further improve signal quality.
-
Test modifications on stop loss rules to make it less aggressive, e.g. add confirmation bars before triggering stop loss.
-
Conduct parameter optimization to find the best parameter combination for the indicators, which may help filter out more noise and increase win rate. Mainly optimize TMO Length, AMA Length and Multiplier.
-
Backtest and trade it live across different products and timeframes to find out the best fitting market condition for this strategy logic.
Conclusion
This strategy combines the trading signals from TMO and AMA to scalp in range-bound markets by capturing early trend moves. It has the advantages of high signal accuracy, early trend capture and effective risk control. Further optimizations on parameters and strategy rules can make it a highly practical intraday scalping strategy.
[/trans]
Strategy Arguments
| Argument | Default | Description |
|---|---|---|
| v_input_float_1 | 2 | Factor |
| v_input_1 | true | As Smoothed Candles |
| v_input_2 | true | Show Alternating Extremities |
| v_input_int_1 | 7 | (?TMO Settings)TMO Length |
| v_input_source_1_close | 0 | TMO Source: close |
| v_input_source_2_close | 0 | (?AMA Settings)AMA Source: close |
| v_input_int_2 | 50 | AMA Length |
| v_input_float_2 | true | (?AMA Kernel Parameters)Lag |
| v_input_float_3 | 0.5 | Overshoot |
| v_input_int_3 | 10 | (?Stop Loss Settings)SL Period |
Source (PineScript)
/*backtest
start: 2023-11-23 00:00:00
end: 2023-11-30 00:00:00
period: 10m
basePeriod: 1m
exchanges: [{"eid":"Futures_Binance","currency":"BTC_USDT"}]
*/

// This source code is subject to the terms of the Mozilla Public License 2.0 at https://mozilla.org/MPL/2.0/
// © Kaspricci

//@version=5
strategy("TradeIQ - Crazy Scalping Trading Strategy [Kaspricci]", overlay=true, initial_capital = 1000, currency = currency.USD)

headlineTMO = "TMO Settings"

tmoLength   = input.int(7, "TMO Length", minval = 1, group = headlineTMO)
tmoSource   = input.source(close, "TMO Source", group = headlineTMO)

// calculate values
osc         = ta.mom(ta.sma(ta.sma(tmoSource, tmoLength), tmoLength), tmoLength)

// determine color of historgram
oscColor    = osc > osc[1] and osc > 0 ? #00c42b : osc < osc[1] and osc > 0 ? #4ee567 : osc < osc[1] and osc < 0 ? #ff441f : osc > osc[1] and osc < 0 ? #c03920 : na

// plot histogram
//plot(osc, "OSC", oscColor, linewidth = 3, style = plot.style_histogram)

// conditon to find highs and lows
up          = ta.highest(tmoSource, tmoLength)
dn          = ta.lowest(tmoSource, tmoLength)

// define conditions to be used for finding divergence
phosc = ta.crossunder(ta.change(osc), 0)
plosc = ta.crossover (ta.change(osc), 0)

// test for divergence
bear = osc > 0 and phosc and ta.valuewhen(phosc,osc,0) < ta.valuewhen(phosc,osc,1) and ta.valuewhen(phosc,up,0) > ta.valuewhen(phosc,up,1) ? 1 : 0
bull = osc < 0 and plosc and ta.valuewhen(plosc,osc,0) > ta.valuewhen(plosc,osc,1) and ta.valuewhen(plosc,dn,0) < ta.valuewhen(plosc,dn,1) ? 1 : 0

// -------------------------------------------------------------------------------------------------------------

headlineAMA = "AMA Settings"

amaSource   = input.source(defval = close, title = "AMA Source", group = headlineAMA)
amaLength   = input.int(defval = 50, title = "AMA Length", minval = 2, group = headlineAMA)


amaMulti    = input.float(defval = 2.0, title = "Factor", minval = 1)

amaShowCd   = input(defval = true , title = "As Smoothed Candles")
amaShowEx   = input(defval = true,   title = "Show Alternating Extremities")

amaAlpha    = input.float(1.0, "Lag",       minval=0, step=.1, tooltip='Control the lag of the moving average (higher = more lag)', group= 'AMA Kernel Parameters')
amaBeta     = input.float(0.5, "Overshoot", minval=0, step=.1, tooltip='Control the overshoot amplitude of the moving average (higher = overshoots with an higher amplitude)', group='AMA Kernel Parameters')

// -------------------------------------------------------------------------------------------------------------

headlineSL = "Stop Loss Settings"

slLength    = input.int(defval = 10, title = "SL Period", minval = 1, group = headlineSL, tooltip = "Number of bars for swing high / low")

// -------------------------------------------------------------------------------------------------------------

var b       = array.new_float(0)
var float x = na

if barstate.isfirst
    for i = 0 to amaLength - 1
        x := i / (amaLength - 1)
        w = math.sin(2 * 3.14159 * math.pow(x, amaAlpha)) * (1 - math.pow(x, amaBeta))
        array.push(b, w)

// local function to filter the source
filter(series float x) =>
    sum = 0.

    for i = 0 to amaLength - 1
        sum := sum + x[i] * array.get(b,i)

    sum / array.sum(b)

// apply filter function on source series

srcFiltered = filter(amaSource)

deviation   = ta.sma(math.abs(amaSource - srcFiltered), amaLength) * amaMulti

upper       = srcFiltered + deviation
lower       = srcFiltered - deviation

//----
crossHigh   = ta.cross(high, upper)
crossLow    = ta.cross(low, lower)

var os      = 0
os          := crossHigh ? 1 : crossLow ? 0 : os[1]

ext         = os * upper + (1 - os) * lower

//----
os_css = ta.rsi(srcFiltered, amaLength) / 100

extColor    = os == 1 ? #30FF85 : #ff1100

plot(srcFiltered, "MA", amaShowCd ? na : color.black, 2, editable = false)
plot(amaShowEx ? ext : na, "Extremities", ta.change(os) ? na : extColor, 2, editable=false)

// handle smoothed candles
var float h = na
var float l = na
var float c = na
var float body = na

if amaShowCd
    h := filter(high)
    l := filter(low)
    c := filter(amaSource)
    body := math.abs(math.avg(c[1], c[2]) - c)

ohlc_os = ta.rsi(c, amaLength) / 100

plotcandle(math.avg(c[1], c[2]), h, l, c, "Smooth Candles", #434651, bordercolor = na, editable = false, display = amaShowCd ? display.all : display.none)

// -------------------------------------------------------------------------------------------------------------

plotshape(bull ? ext : na, "Bullish Circle", shape.circle,    location.absolute, color = #00c42b, size=size.tiny)
plotshape(bear ? ext : na, "Bearish Circle", shape.circle,    location.absolute, color = #ff441f, size=size.tiny)
plotshape(bull ? ext : na, "Bullish Label",  shape.labeldown, location.absolute, color = #00c42b, text="Buy", textcolor=color.white, size=size.tiny)
plotshape(bear ? ext : na, "Bearish Label",  shape.labelup,   location.absolute, color = #ff441f, text="Sell", textcolor=color.white, size=size.tiny)

// -------------------------------------------------------------------------------------------------------------

candleSizeIncreasing = body[2] < body[1] and body[1] < body[0]

longEntryCond   = os == 1 and bull
shortEntryCond  = os == 0 and bear

longEntry       = strategy.opentrades == 0 and candleSizeIncreasing and not candleSizeIncreasing[1] and ta.barssince(longEntryCond)  < ta.barssince(os == 0) and ta.barssince(longEntryCond) < ta.barssince(bear)
shortEntry      = strategy.opentrades == 0 and candleSizeIncreasing and not candleSizeIncreasing[1] and ta.barssince(shortEntryCond) < ta.barssince(os == 1) and ta.barssince(shortEntryCond) < ta.barssince(bull)

longExit        = strategy.opentrades > 0 and strategy.position_size > 0 and (bear or os == 0)
shortExit       = strategy.opentrades > 0 and strategy.position_size < 0 and (bull or os == 1)

recentSwingHigh = ta.highest(high, slLength) // highest high of last candles
recentSwingLow  = ta.lowest(low,   slLength) // lowest low of recent candles

bgcolor(longEntry  ? color.rgb(76, 175, 79, 90) : na)
bgcolor(shortEntry ? color.rgb(255, 82, 82, 90) : na)

slLong          = (close - recentSwingLow) / syminfo.mintick  // stop loss in ticks
slShort         = (recentSwingHigh - close) / syminfo.mintick // stop loss in ticks

newOrderID         = str.tostring(strategy.closedtrades + strategy.opentrades + 1)
curOrderID         = str.tostring(strategy.closedtrades + strategy.opentrades)

alertMessageForEntry = "Trade {0} - New {1} Entry at price: {2} with stop loss at: {3}"

if (longEntry)
    alertMessage = str.format(alertMessageForEntry, newOrderID, "Long", close, recentSwingLow)

    strategy.entry(newOrderID, strategy.long, alert_message = alertMessage)
    strategy.exit("Stop Loss Long", newOrderID, loss = slLong, alert_message = "Stop Loss for Trade " + newOrderID)

if(longExit)
    strategy.close(curOrderID, alert_message = "Close Trade " + curOrderID)

if (shortEntry)
    alertMessage = str.format(alertMessageForEntry, newOrderID, "Short", close, recentSwingLow)

    strategy.entry(newOrderID, strategy.short, alert_message = alertMessage)
    strategy.exit("Stop Loss Short", newOrderID, loss = slShort, alert_message = "Stop Loss for Trade " + newOrderID)

if(shortExit)
    strategy.close(curOrderID, alert_message = "Close Trade " + curOrderID)
Detail
https://www.fmz.com/strategy/433922
Last Modified
2023-12-01 14:47:57