
16 KiB
Name
双指数移动平均交叉转向退出策略-Dual-EMA-Cross-with-Directional-Exit-Strategy
Author
ianzeng123
Strategy Description
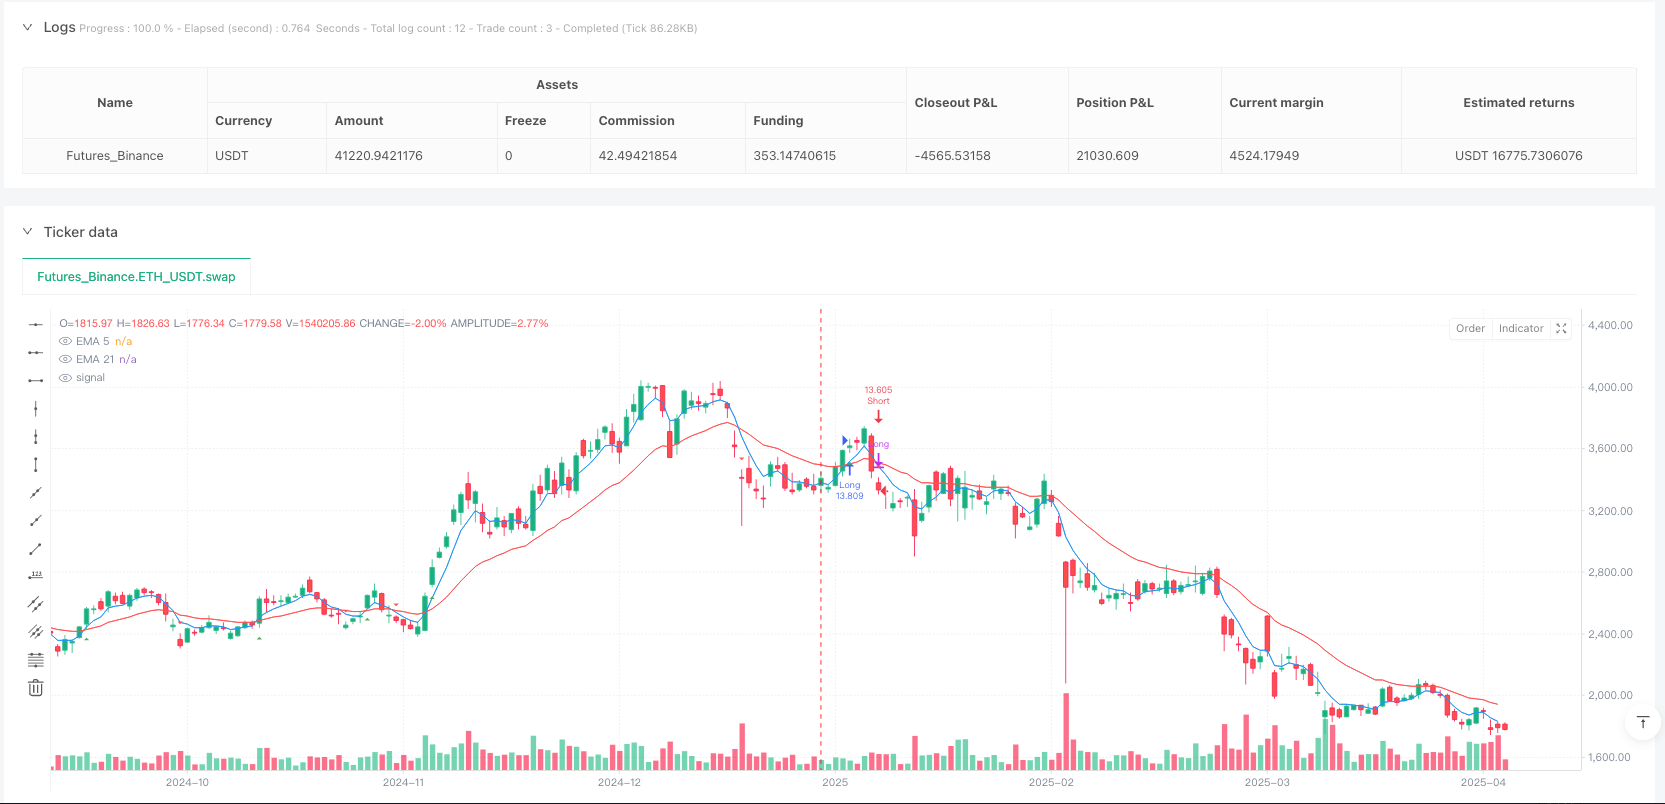
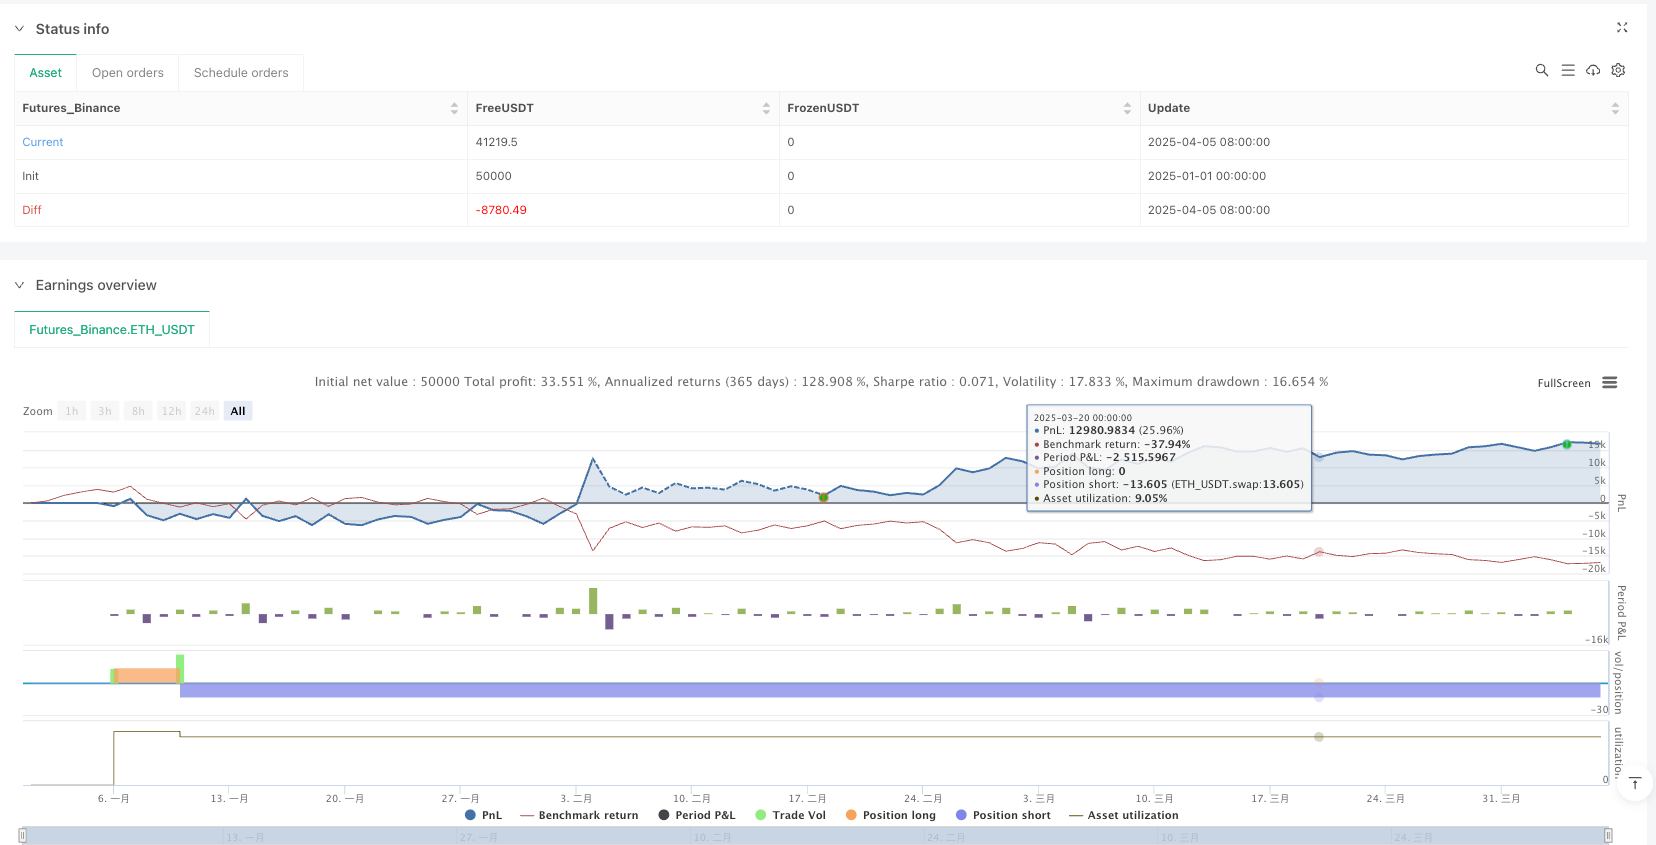
[trans]
概述
双指数移动平均交叉转向退出策略是一种基于两条不同周期EMA线(5周期和21周期)交叉信号的量化交易策略。该策略通过识别短期EMA与长期EMA之间的金叉和死叉来捕捉市场趋势的变化点,从而实现趋势跟踪交易。当短期EMA向上穿越长期EMA时形成金叉,触发做多信号;当短期EMA向下穿越长期EMA时形成死叉,触发做空信号。策略在交叉信号出现时平掉反向仓位并建立新仓位,实现全自动化的趋势跟踪交易。
策略原理
该策略的核心原理基于移动平均线交叉信号来识别市场趋势的转变点。具体实现如下:
- 计算两条指数移动平均线:5周期EMA(短期)和21周期EMA(长期)
- 识别金叉信号:当5周期EMA从下方穿越21周期EMA时
- 识别死叉信号:当5周期EMA从上方穿越21周期EMA时
- 交易规则:
- 金叉信号出现且当前无多头仓位时,平掉可能存在的空头仓位,开立多头仓位
- 死叉信号出现且当前无空头仓位时,平掉可能存在的多头仓位,开立空头仓位
- 仓位管理:使用账户净值的100%进行交易,且不允许加仓(pyramiding设置为0)
- 时间过滤:仅在2024年1月1日至2025年3月1日之间的时间段内执行交易信号
策略采用了趋势跟踪的思想,通过移动平均线交叉来确认趋势方向的改变,并在趋势确认后跟随趋势建立相应方向的仓位。EMA指标对价格变化的反应比简单移动平均线更敏感,能更快地捕捉到趋势的变化。
策略优势
通过深入分析代码,该策略具有以下显著优势:
- 信号明确:基于EMA交叉的信号明确无歧义,便于执行和回测
- 反应灵敏:采用EMA而非SMA,使得策略对价格变化的反应更加灵敏,能更快地捕捉到趋势变化
- 自动化程度高:策略全自动执行交易信号,无需人工干预,降低了主观情绪对交易的影响
- 完整的风险管理:在反向信号出现时自动平仓,有效控制了风险暴露时间
- 资金管理合理:使用账户净值百分比作为仓位管理方式,随着账户规模变化自动调整仓位大小
- 可视化优良:在图表上标记金叉和死叉信号,并显示策略参数和净利润,便于策略监控和评估
- 双向交易:同时捕捉上升和下降趋势,最大化市场机会
- 时间过滤:通过时间过滤机制,可以灵活设定策略运行的时间范围,避免特定时期的市场干扰
策略风险
尽管该策略设计合理,但仍存在以下潜在风险:
-
震荡市场风险:在横盘震荡市场中,EMA交叉信号频繁,容易产生虚假信号,导致连续止损
- 解决方法:可以增加额外的过滤条件,如ADX指标确认趋势强度,或添加波动率过滤器
-
滞后性风险:尽管EMA响应较快,但作为滞后指标仍然存在一定的延迟,可能在趋势已经结束时才发出信号
- 解决方法:可以考虑缩短EMA周期或结合领先指标使用
-
资金管理风险:策略使用100%的账户净值进行交易,杠杆率较高,在连续亏损时可能导致账户净值大幅缩水
- 解决方法:降低仓位比例,如改为50%或更低,引入最大回撤控制机制
-
缺乏止损机制:代码中没有明确的止损设置,在极端市场条件下可能面临较大损失
- 解决方法:添加固定止损或ATR倍数止损,限制单次交易的最大损失
-
缺乏盈利保护:没有设置止盈或移动止损,可能导致已获利润回吐
- 解决方法:实施移动止损或在达到特定盈利目标时部分获利了结
策略优化方向
基于对代码的深入分析,该策略可以在以下几个方向进行优化:
-
增加趋势过滤器:引入ADX指标来过滤弱趋势市场的交易信号,只在ADX大于特定阈值(如20)时执行交易,减少震荡市场中的虚假信号。这样优化能有效提高胜率,因为移动平均线策略在强趋势市场中表现更佳。
-
实施动态止损:增加基于ATR的动态止损,可以根据市场波动性自动调整止损位置,既能控制风险又不会因止损过紧而提前出局。这对于跟踪长期趋势特别有价值。
-
优化EMA参数:可以通过参数优化测试不同的EMA周期组合,如3和15、8和34等,找到特定市场环境下表现更佳的参数。不同的市场和时间框架可能需要不同的最优参数。
-
引入部分获利机制:当盈利达到特定水平时(如2倍ATR),可以平掉部分仓位锁定利润,剩余仓位继续持有跟踪趋势。这能在保持捕捉大趋势能力的同时提高整体收益稳定性。
-
添加交易时间过滤:某些市场在特定时段波动性过大或流动性不足,可以设置交易时间窗口,只在市场最活跃和稳定的时段交易。这有助于避开高波动或低效率的市场环境。
-
实施仓位管理策略:改进当前固定百分比的仓位管理方法,可以采用基于波动性的仓位调整,在波动性高的市场环境中减少仓位,反之增加仓位,以保持风险敞口的一致性。
-
增加二次确认指标:结合RSI、随机指标或MACD等其他技术指标作为二次确认,只有当多个指标共同指向同一方向时才执行交易,提高信号质量。
总结
双指数移动平均交叉转向退出策略是一种简洁高效的趋势跟踪交易系统,通过识别5周期和21周期EMA的交叉信号捕捉市场趋势转变点。该策略操作明确、执行自动化、信号生成客观,特别适合中长期趋势明显的市场环境。
尽管存在震荡市场下的虚假信号风险和一定的滞后性,但通过增加趋势强度过滤、优化参数选择、实施动态止损和改进仓位管理等方式,可以显著提升策略的稳健性和盈利能力。对于寻求全自动化趋势跟踪系统的交易者而言,这是一个理想的基础框架,可以根据个人风险偏好和交易风格进行进一步定制和优化。
特别值得注意的是,通过将该策略与市场结构分析、基本面筛选或季节性分析等方法结合,可以构建更加全面的交易系统,在各种市场环境中保持竞争力。 ||
Overview
The Dual EMA Cross with Directional Exit Strategy is a quantitative trading strategy based on crossover signals between two Exponential Moving Averages (EMAs) of different periods (5 and 21). The strategy captures market trend change points by identifying golden crosses and death crosses between short-term and long-term EMAs. A golden cross occurs when the short-term EMA crosses above the long-term EMA, triggering a buy signal; a death cross occurs when the short-term EMA crosses below the long-term EMA, triggering a sell signal. The strategy closes reverse positions and establishes new positions when crossover signals appear, achieving fully automated trend-following trading.
Strategy Principle
The core principle of this strategy is based on moving average crossover signals to identify trend reversal points in the market. The specific implementation is as follows:
- Calculate two exponential moving averages: 5-period EMA (short-term) and 21-period EMA (long-term)
- Identify golden cross signals: when the 5-period EMA crosses above the 21-period EMA
- Identify death cross signals: when the 5-period EMA crosses below the 21-period EMA
- Trading rules:
- When a golden cross appears and there is no long position, close any existing short position and open a long position
- When a death cross appears and there is no short position, close any existing long position and open a short position
- Position management: Uses 100% of account equity for trading, with no pyramiding allowed (pyramiding set to 0)
- Time filter: Execute trading signals only within the time period between January 1, 2024 and March 1, 2025
The strategy adopts a trend-following approach, using moving average crossovers to confirm changes in trend direction and establishing positions accordingly after trend confirmation. The EMA indicator responds more sensitively to price changes than simple moving averages, enabling faster capture of trend changes.
Strategy Advantages
Through in-depth code analysis, this strategy has the following significant advantages:
- Clear signals: The EMA crossover signals are unambiguous, facilitating execution and backtesting
- Sensitive response: Using EMA rather than SMA makes the strategy more responsive to price changes, capturing trend changes more quickly
- High degree of automation: The strategy executes trading signals automatically without manual intervention, reducing the impact of subjective emotions on trading
- Complete risk management: Automatically closes positions when reverse signals appear, effectively controlling risk exposure time
- Reasonable capital management: Uses account equity percentage as position sizing method, automatically adjusting position size as account scale changes
- Excellent visualization: Marks golden cross and death cross signals on the chart and displays strategy parameters and net profit, facilitating strategy monitoring and evaluation
- Bidirectional trading: Captures both upward and downward trends, maximizing market opportunities
- Time filtering: Through the time filtering mechanism, the strategy's operating time range can be flexibly set to avoid market interference during specific periods
Strategy Risks
Despite the reasonable design of this strategy, there are still the following potential risks:
-
Sideways market risk: In range-bound markets, EMA crossover signals are frequent, easily producing false signals leading to consecutive stop losses
- Solution: Additional filtering conditions can be added, such as ADX indicator to confirm trend strength, or add volatility filters
-
Lag risk: Although EMA responds faster, as a lagging indicator it still has some delay, possibly signaling after a trend has already ended
- Solution: Consider shortening EMA periods or combining with leading indicators
-
Capital management risk: The strategy uses 100% of account equity for trading, which is a high leverage ratio that could cause significant equity drawdown during consecutive losses
- Solution: Reduce position ratio to 50% or lower, introduce maximum drawdown control mechanisms
-
Lack of stop-loss mechanism: There is no explicit stop-loss setting in the code, which could face significant losses in extreme market conditions
- Solution: Add fixed stop-loss or ATR multiple stop-loss to limit maximum loss per trade
-
Lack of profit protection: No take-profit or trailing stop-loss settings, which may result in profit giveback
- Solution: Implement trailing stop-loss or partial profit-taking when specific profit targets are reached
Strategy Optimization Directions
Based on in-depth code analysis, this strategy can be optimized in the following directions:
-
Add trend filter: Introduce ADX indicator to filter trading signals in weak trend markets, only executing trades when ADX is above a specific threshold (such as 20) to reduce false signals in range-bound markets. This optimization can effectively improve win rate because moving average strategies perform better in strong trend markets.
-
Implement dynamic stop-loss: Add ATR-based dynamic stop-loss that automatically adjusts stop-loss positions based on market volatility, controlling risk without premature exit due to tight stops. This is particularly valuable for tracking long-term trends.
-
Optimize EMA parameters: Test different EMA period combinations through parameter optimization, such as 3 and 15, 8 and 34, etc., to find parameters that perform better in specific market environments. Different markets and timeframes may require different optimal parameters.
-
Introduce partial profit-taking mechanism: When profit reaches a specific level (such as 2x ATR), close part of the position to lock in profits while continuing to hold the remaining position to track the trend. This can improve overall return stability while maintaining the ability to capture major trends.
-
Add trading time filters: Some markets have excessive volatility or insufficient liquidity during specific periods; setting trading time windows to only trade during the most active and stable market sessions can help avoid high-volatility or inefficient market environments.
-
Implement position sizing strategy: Improve the current fixed percentage position sizing method by adopting volatility-based position adjustment, reducing positions in high-volatility market environments and increasing positions in the opposite case to maintain consistency in risk exposure.
-
Add secondary confirmation indicators: Combine with other technical indicators such as RSI, Stochastic, or MACD as secondary confirmation, only executing trades when multiple indicators point in the same direction, improving signal quality.
Summary
The Dual EMA Cross with Directional Exit Strategy is a concise and efficient trend-following trading system that captures market trend reversal points by identifying crossover signals between 5-period and 21-period EMAs. The strategy features clear operations, automated execution, and objective signal generation, making it particularly suitable for market environments with pronounced medium to long-term trends.
Although there are risks of false signals in range-bound markets and a certain degree of lag, the strategy's robustness and profitability can be significantly enhanced through adding trend strength filters, optimizing parameter selection, implementing dynamic stop-losses, and improving position management. For traders seeking a fully automated trend-following system, this is an ideal foundational framework that can be further customized and optimized according to individual risk preferences and trading styles.
It is particularly noteworthy that by combining this strategy with market structure analysis, fundamental screening, or seasonal analysis, a more comprehensive trading system can be constructed that maintains competitiveness across various market environments. [/trans]
Source (PineScript)
/*backtest
start: 2025-01-01 00:00:00
end: 2025-04-06 00:00:00
period: 1d
basePeriod: 1d
exchanges: [{"eid":"Futures_Binance","currency":"ETH_USDT"}]
*/

//@version=6
strategy("EMA Cross Strategy with EMA Turning Exit", overlay=true, initial_capital=10000, default_qty_type=strategy.percent_of_equity, default_qty_value=100, pyramiding=0)


// 定义EMA参数
ema5 = ta.ema(close, 5)
ema21 = ta.ema(close, 21)

// 绘制EMA线
plot(ema5, color=color.blue, title="EMA 5", linewidth=1)
plot(ema21, color=color.red, title="EMA 21", linewidth=1)

// 定义金叉和死叉条件
goldCross = ta.crossover(ema5, ema21)
deadCross = ta.crossunder(ema5, ema21)

// 在图表上标记交叉信号
plotshape(goldCross, title="Golden Cross", style=shape.triangleup, location=location.belowbar, color=color.green, size=size.normal)
plotshape(deadCross, title="Death Cross", style=shape.triangledown, location=location.abovebar, color=color.red, size=size.normal)


// 执行交易策略

// 开多单条件:金叉信号且无多头仓位
if (goldCross and strategy.position_size <= 0)
    strategy.close("Short")  // 平掉空头仓位(如果有)
    strategy.entry("Long", strategy.long)

// 开空单条件:死叉信号且无空头仓位
if (deadCross and strategy.position_size >= 0)
    strategy.close("Long")  // 平掉多头仓位(如果有)
    strategy.entry("Short", strategy.short)

// 显示策略参数和状态
var table t = table.new(position.top_right, 2, 3, bgcolor=color.white)
table.cell(t, 0, 0, "EMA Fast", text_color=color.blue)
table.cell(t, 1, 0, "5", text_color=color.blue)
table.cell(t, 0, 1, "EMA Slow", text_color=color.red)
table.cell(t, 1, 1, "21", text_color=color.red)
table.cell(t, 0, 2, "Net Profit", text_color=color.black)
table.cell(t, 1, 2, str.tostring(strategy.netprofit), text_color=color.black)
Detail
https://www.fmz.com/strategy/489646
Last Modified
2025-04-07 12:00:24