
10 KiB
Name
双指数平滑趋势跟踪交易系统-Dual-Exponential-Smoothing-Trend-Following-Trading-System
Author
ChaoZhang
Strategy Description
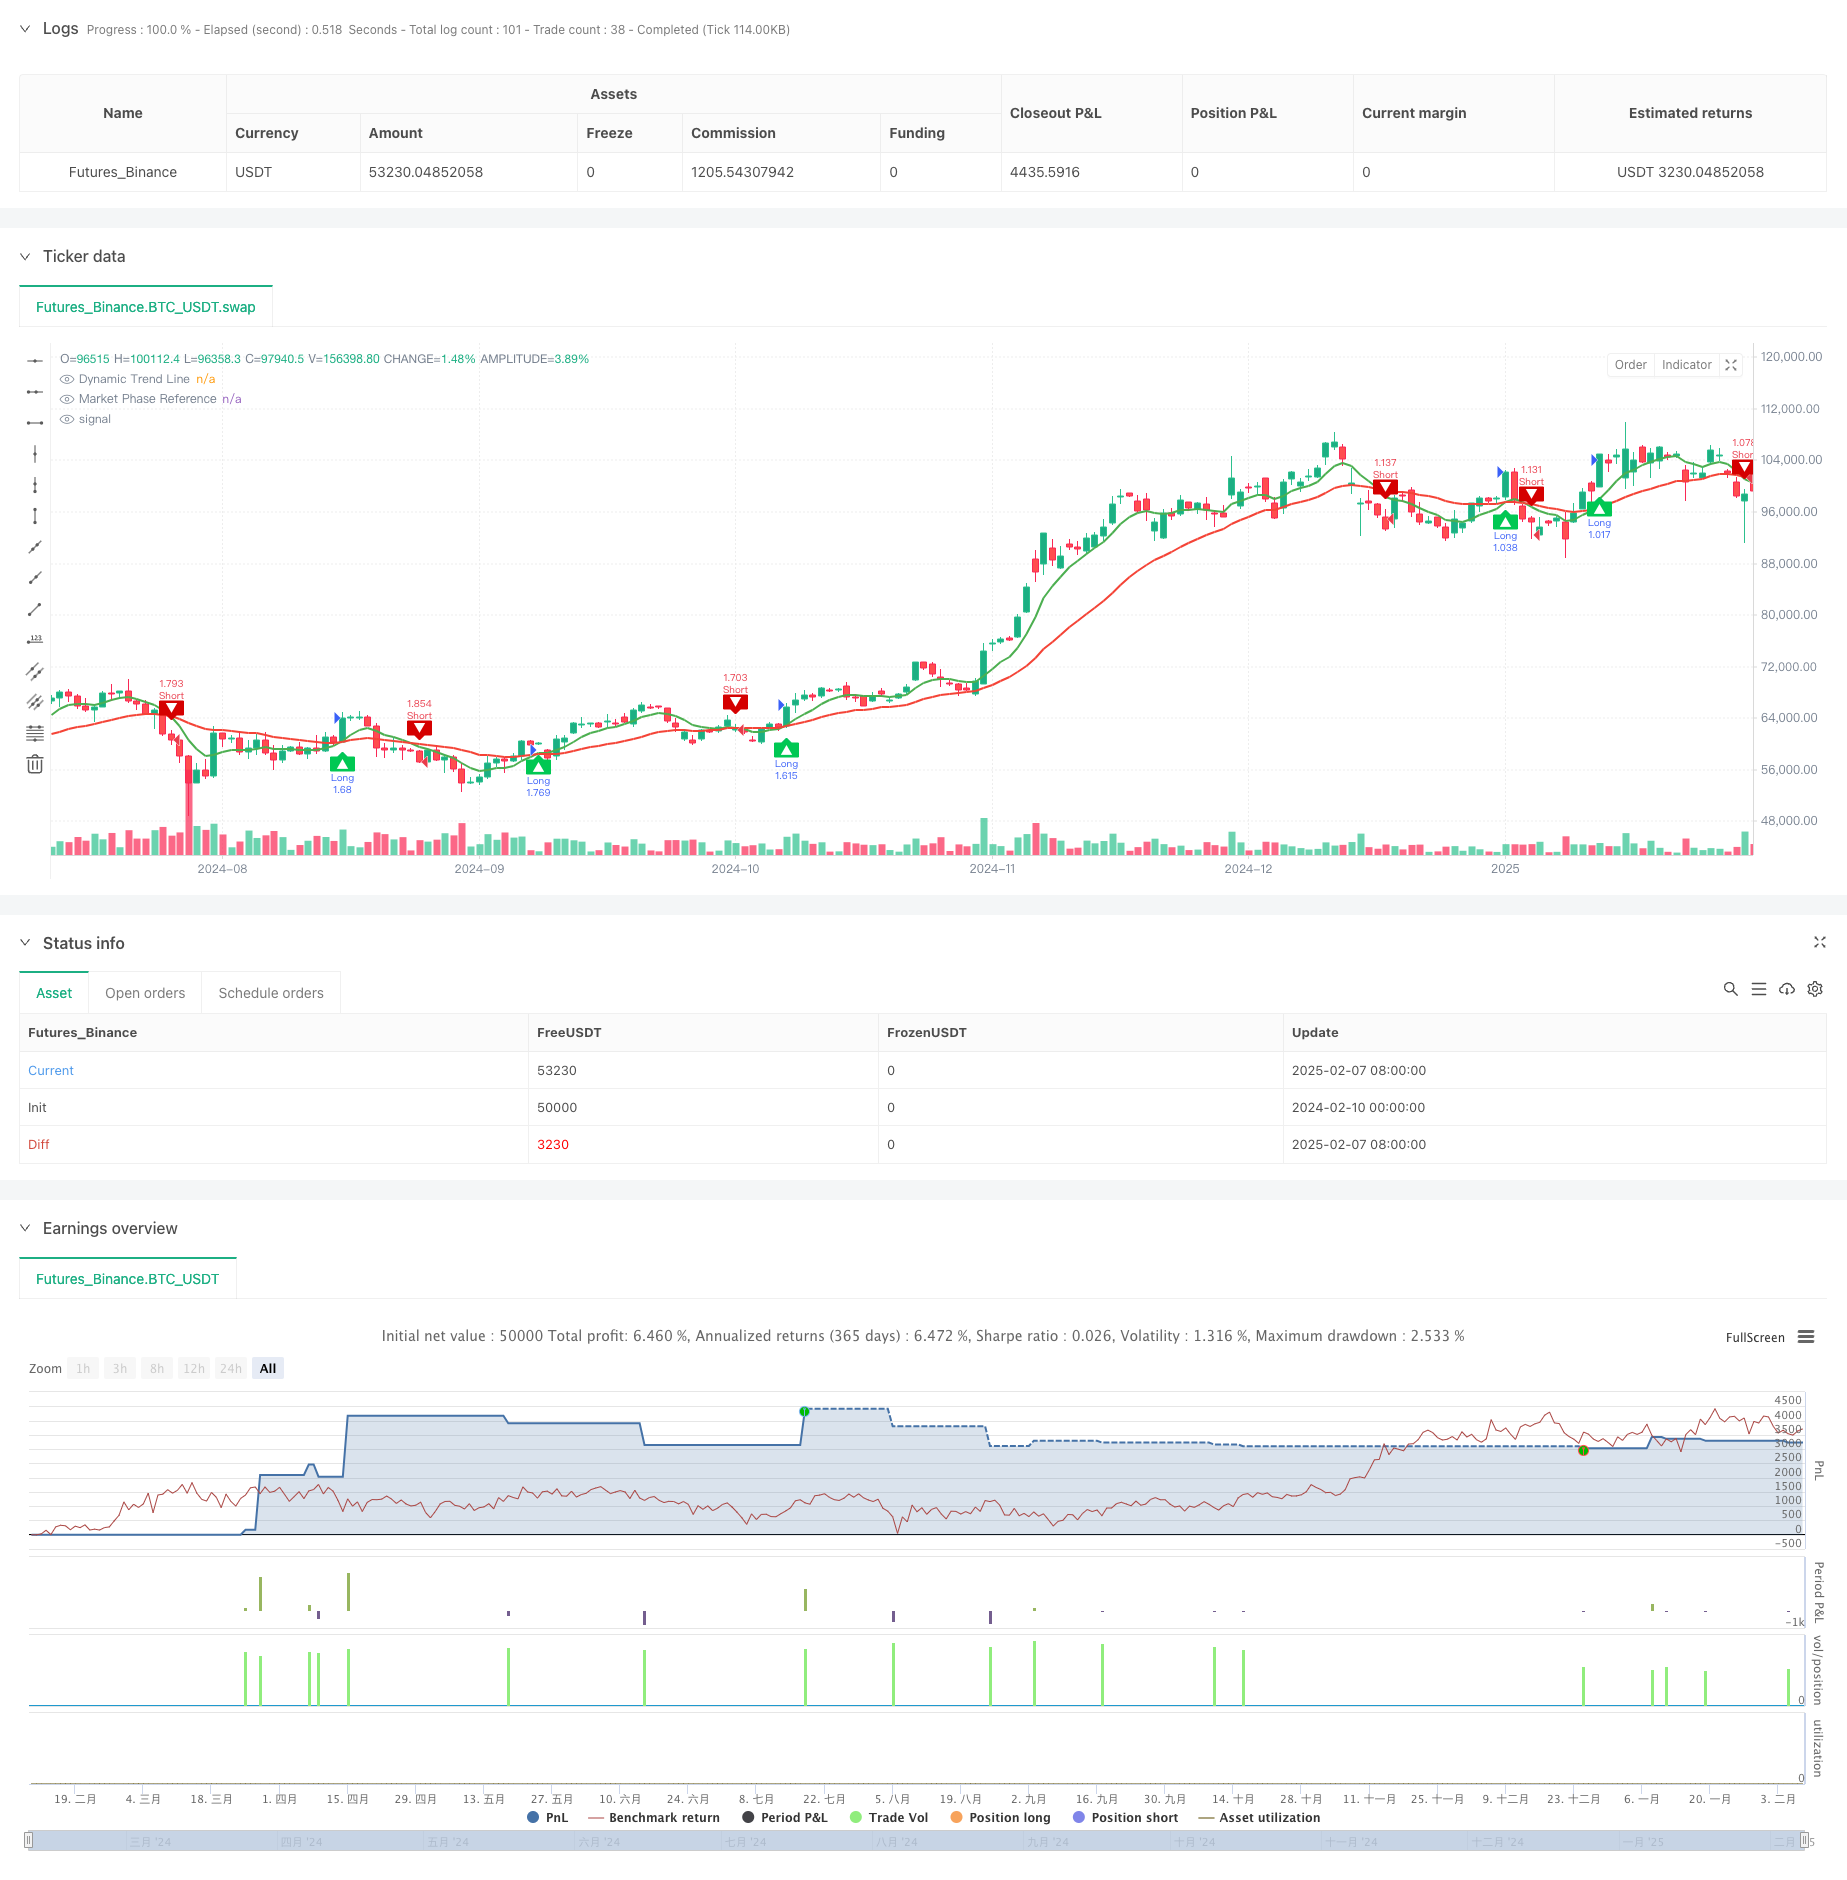
[trans]
概述
本策略是一个创新的趋势跟踪交易系统,采用了双层指数平滑技术来识别市场趋势。该系统通过对价格数据进行特殊的指数平滑处理,生成两条趋势线,用于捕捉市场的短期和长期走势。系统集成了完整的风险管理模块,包括止盈止损设置,以及灵活的仓位管理功能。
策略原理
策略的核心是其独特的双层指数平滑算法。首先,系统对收盘价进行加权处理,计算方法为(最高价+最低价+2*收盘价)/4,这样可以减少市场噪音的影响。然后通过自定义的指数平滑函数,分别计算9周期和30周期的平滑曲线。当短期曲线穿越长期曲线时,系统会产生交易信号。上穿生成做多信号,下穿生成做空信号。系统还包含了基于百分比的仓位管理系统,默认使用账户100%的资金进行交易。
策略优势
- 信号生成机制清晰,采用经典的趋势跟踪理念,易于理解和执行。
- 双层指数平滑技术能有效过滤市场噪音,提高信号质量。
- 集成了完整的风险管理体系,包括止盈止损和仓位管理。
- 系统可以自适应不同的市场环境,适用于多种交易品种。
- 提供了清晰的视觉指示器,方便交易者快速判断市场方向。
策略风险
- 在震荡市场中可能产生频繁的假信号,导致连续止损。
- 默认使用100%资金进行交易,杠杆率过高可能带来较大风险。
- 固定点数的止盈止损设置可能不适合所有市场环境。
- 系统可能在剧烈波动的市场中出现滑点,影响执行效果。
- 历史回测结果不能保证未来表现。
策略优化方向
- 引入波动率指标(如ATR)来动态调整止盈止损点位。
- 增加趋势强度过滤器,在弱趋势环境下降低交易频率。
- 加入市场环境识别模块,在震荡市场中自动调整策略参数。
- 开发动态仓位管理系统,根据市场情况自动调整交易规模。
- 集成基本面分析模块,提高交易决策的准确性。
总结
这是一个设计合理、逻辑清晰的趋势跟踪系统。通过双层指数平滑技术和完整的风险管理体系,该策略能够在趋势市场中取得良好表现。但是,使用者需要根据自己的风险承受能力调整仓位大小,并且建议在实盘交易前进行充分的回测验证。通过建议的优化方向,该策略还有进一步提升的空间。
||
Overview
This strategy is an innovative trend following trading system that employs dual-layer exponential smoothing technology to identify market trends. The system processes price data through a special exponential smoothing technique to generate two trend lines for capturing short-term and long-term market movements. It integrates a complete risk management module, including profit-taking and stop-loss settings, along with flexible position management capabilities.
Strategy Principle
The core of the strategy lies in its unique dual-layer exponential smoothing algorithm. First, the system applies weighted processing to the closing price, calculated as (High+Low+2*Close)/4, which helps reduce market noise. Then, through a custom exponential smoothing function, it calculates 9-period and 30-period smoothing curves. Trading signals are generated when the short-term curve crosses the long-term curve. An upward cross generates a long signal, while a downward cross generates a short signal. The system also includes a percentage-based position management system, defaulting to 100% of account equity for trading.
Strategy Advantages
- Clear signal generation mechanism based on classic trend-following principles, easy to understand and execute.
- Dual-layer exponential smoothing technology effectively filters market noise and improves signal quality.
- Integrated complete risk management system, including profit-taking, stop-loss, and position management.
- System can adapt to different market environments and is suitable for various trading instruments.
- Provides clear visual indicators for traders to quickly judge market direction.
Strategy Risks
- May generate frequent false signals in ranging markets, leading to consecutive stops.
- Default 100% equity usage for trading may carry excessive leverage risk.
- Fixed-point profit-taking and stop-loss settings may not suit all market environments.
- System may experience slippage in volatile markets, affecting execution quality.
- Historical backtest results cannot guarantee future performance.
Strategy Optimization Directions
- Introduce volatility indicators (like ATR) to dynamically adjust profit-taking and stop-loss levels.
- Add trend strength filters to reduce trading frequency in weak trend environments.
- Incorporate market environment recognition module to automatically adjust strategy parameters in ranging markets.
- Develop dynamic position management system to automatically adjust trading size based on market conditions.
- Integrate fundamental analysis module to improve trading decision accuracy.
Summary
This is a well-designed trend following system with clear logic. Through dual-layer exponential smoothing technology and a complete risk management system, the strategy can perform well in trending markets. However, users need to adjust position sizes according to their risk tolerance and are advised to conduct thorough backtesting before live trading. Through the suggested optimization directions, this strategy has room for further improvement.[/trans]
Source (PineScript)
/*backtest
start: 2024-02-10 00:00:00
end: 2025-02-08 08:00:00
period: 1d
basePeriod: 1d
exchanges: [{"eid":"Futures_Binance","currency":"BTC_USDT"}]
*/

//@version=5
strategy("Dynamic Trend Navigator AI [CodingView]", overlay=true, initial_capital=100000, default_qty_type=strategy.percent_of_equity , default_qty_value=200 )


// ==================================================================================================
// This source code is subject to the terms of the Mozilla Public License 2.0 at https://mozilla.org/MPL/2.0/
// © CodingView_23
//
// Script Name: Dynamic Trend Navigator
// Developed by: theCodingView Team
// Contact: support@theCodingView.com
// Website: www.theCodingView.com
//
// Description: Implements an adaptive trend-following strategy using proprietary smoothing algorithms.
// Features include:
// - Dual timeframe trend analysis
// - Custom exponential smoothing technique
// - Integrated risk management (profit targets & stop-loss)
// - Visual trend direction indicators
// ==================================================================================================


// ====== Enhanced Input Configuration ======
primaryLookbackWindow = input.int(9, "Primary Trend Window", minval=2)
secondaryLookbackWindow = input.int(30, "Secondary Trend Window", minval=5)

// ====== Custom Exponential Smoothing Implementation ======
customSmoothingFactor(periods) =>
    smoothingWeight = 2.0 / (periods + 1)
    smoothingWeight

adaptivePricePosition(priceSource, lookback) =>
    weightedSum = 0.0
    smoothingCoefficient = customSmoothingFactor(lookback)
    cumulativeWeight = 0.0
    for iteration = 0 to lookback - 1 by 1
        historicalWeight = math.pow(1 - smoothingCoefficient, iteration)
        weightedSum := weightedSum + priceSource[iteration] * historicalWeight
        cumulativeWeight := cumulativeWeight + historicalWeight
    weightedSum / cumulativeWeight

// ====== Price Transformation Pipeline ======
modifiedClose = (high + low + close * 2) / 4
smoothedSeries1 = adaptivePricePosition(modifiedClose, primaryLookbackWindow)
smoothedSeries2 = adaptivePricePosition(modifiedClose, secondaryLookbackWindow)

// ====== Signal Detection System ======
trendDirectionUp = smoothedSeries1 > smoothedSeries2 and smoothedSeries1[1] <= smoothedSeries2[1]
trendDirectionDown = smoothedSeries1 < smoothedSeries2 and smoothedSeries1[1] >= smoothedSeries2[1]

// ====== Visual Representation Module ======
plot(smoothedSeries1, "Dynamic Trend Line", #4CAF50, 2)
plot(smoothedSeries2, "Market Phase Reference", #F44336, 2)

// ====== Risk Management Configuration ======
enableRiskParameters = input.bool(true, "Activate Risk Controls")
profitTargetUnits = input.float(30, "Profit Target Points")
lossLimitUnits = input.float(30, "Stop-Loss Points")

// ====== Position Management Logic ======
var float entryPrice = na
var float profitTarget = na
var float stopLoss = na

// ====== Long Position Logic ======
if trendDirectionUp
    strategy.close("Short", comment="Short Close")
    strategy.entry("Long", strategy.long)
    entryPrice := close
    profitTarget := close + profitTargetUnits
    stopLoss := close - lossLimitUnits

if enableRiskParameters
    strategy.exit("Long Exit", "Long", limit=profitTarget, stop=stopLoss)

// ====== Short Position Logic ======
if trendDirectionDown
    strategy.close("Long", comment="Long Close")
    strategy.entry("Short", strategy.short)
    entryPrice := close
    profitTarget := close - profitTargetUnits
    stopLoss := close + lossLimitUnits

if enableRiskParameters
    strategy.exit("Short Exit", "Short", limit=profitTarget, stop=stopLoss)

// ====== Visual Signals ======
plotshape(trendDirectionUp, "Bullish", shape.labelup, location.belowbar, #00C853, text="▲", textcolor=color.white)
plotshape(trendDirectionDown, "Bearish", shape.labeldown, location.abovebar, #D50000, text="▼", textcolor=color.white)

// ====== Branding Module ======
var brandingTable = table.new(position.bottom_right, 1, 1)
if barstate.islast
    table.cell(brandingTable, 0, 0, "Trading System v2.0", text_color=color.new(#607D8B, 50))
Detail
https://www.fmz.com/strategy/481355
Last Modified
2025-02-10 14:46:36