
6.9 KiB
Name
双均线随机震荡策略系统趋势跟踪与动量结合的量化交易模型-Dual-EMA-Stochastic-Oscillator-System-A-Quantitative-Trading-Model-Combining-Trend-Following-and-Momentum
Author
ChaoZhang
Strategy Description
[trans]
概述
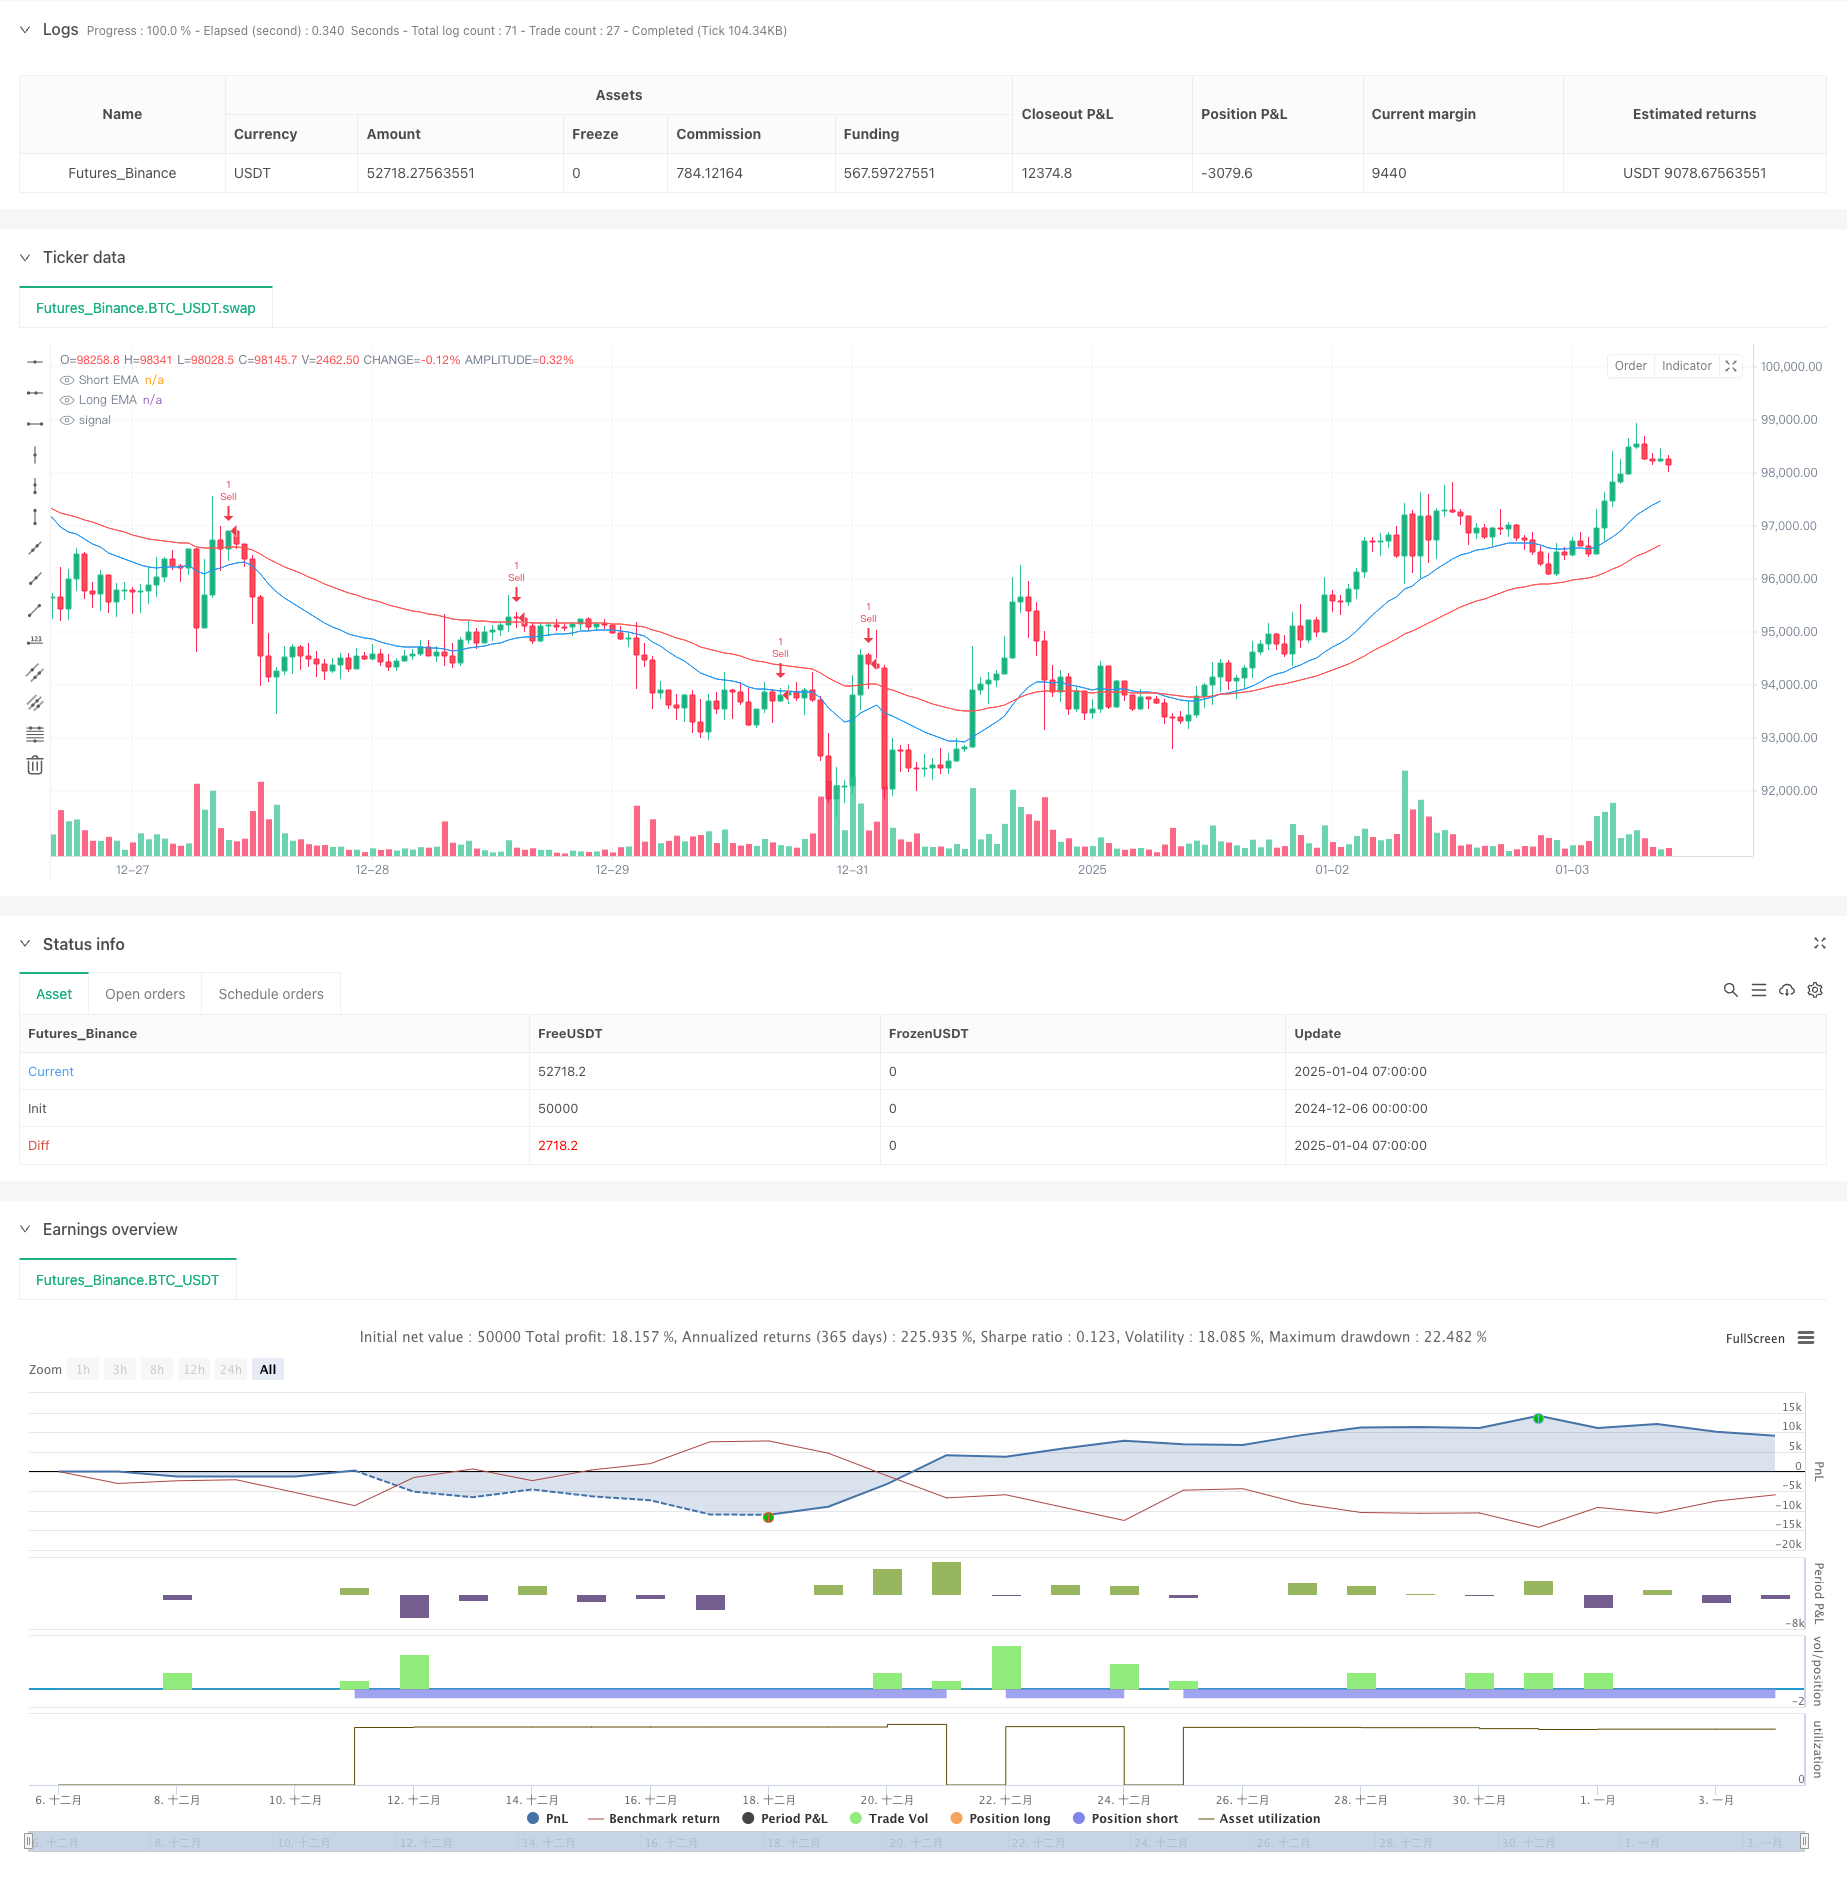
该策略是一个结合了双指数移动平均线(EMA)和随机震荡指标(Stochastic Oscillator)的量化交易系统。通过20周期和50周期EMA判断市场趋势,利用随机震荡指标在超买超卖区域寻找交易机会,实现趋势与动量的完美结合。策略采用了严格的风险管理措施,包括固定的止损和利润目标设置。
策略原理
策略的核心逻辑分为三个部分:趋势判断、入场时机和风险控制。趋势判断主要依靠快速EMA(20周期)和慢速EMA(50周期)的相对位置,当快线位于慢线上方时判断为上升趋势,反之为下降趋势。入场信号由随机震荡指标的交叉确认,在超买超卖区域寻找高胜率的交易机会。风险控制采用了固定百分比止损和2倍止盈比例的设置,确保每笔交易都有明确的风险收益比。
策略优势
- 结合趋势跟踪和动量指标,能够在趋势市场中获得稳定收益
- 采用了科学的资金管理方法,通过固定风险比例来控制每笔交易的损失
- 指标参数可根据不同市场特点灵活调整
- 策略逻辑清晰,易于理解和执行
- 适用于多个时间周期的交易
策略风险
- 在震荡市场中可能产生频繁的假信号
- EMA参数的选择会影响策略表现
- 随机震荡指标的超买超卖设置需要针对具体市场调整
- 在快速波动市场中止损位可能过宽
- 需要考虑交易成本对策略收益的影响
策略优化方向
- 增加成交量指标作为辅助确认
- 引入ATR指标动态调整止损位置
- 根据市场波动率自适应调整指标参数
- 加入趋势强度过滤器减少假信号
- 开发自适应的利润目标计算方法
总结
该策略通过结合趋势和动量指标,建立了一个完整的交易系统。策略的核心优势在于其清晰的逻辑框架和严格的风险控制,但在实际应用中仍需要根据具体市场情况进行参数优化。通过持续改进和优化,策略有望在各种市场环境下都能保持稳定的表现。
||
Overview
This strategy is a quantitative trading system that combines dual Exponential Moving Averages (EMA) with the Stochastic Oscillator. It utilizes 20-period and 50-period EMAs to determine market trends while using the Stochastic Oscillator to identify trading opportunities in overbought and oversold zones, achieving a perfect blend of trend and momentum. The strategy implements strict risk management measures, including fixed stop-loss and profit targets.
Strategy Principles
The core logic consists of three components: trend identification, entry timing, and risk control. Trend identification primarily relies on the relative position of fast EMA (20-period) and slow EMA (50-period), where an uptrend is confirmed when the fast line is above the slow line, and vice versa. Entry signals are confirmed by Stochastic Oscillator crossovers, seeking high-probability trades in overbought and oversold zones. Risk control employs fixed percentage stop-losses and 2:1 profit targets, ensuring clear risk-reward ratios for each trade.
Strategy Advantages
- Combines trend following and momentum indicators for consistent profits in trending markets
- Implements scientific money management through fixed risk percentages
- Indicator parameters can be flexibly adjusted for different markets
- Clear and easy-to-understand strategy logic
- Applicable across multiple timeframes
Strategy Risks
- May generate frequent false signals in ranging markets
- EMA parameter selection significantly impacts strategy performance
- Stochastic overbought/oversold levels need market-specific adjustment
- Stop-loss levels may be too wide in volatile markets
- Trading costs need to be considered for strategy profitability
Optimization Directions
- Add volume indicators for additional confirmation
- Incorporate ATR for dynamic stop-loss adjustment
- Develop adaptive parameter adjustment based on market volatility
- Implement trend strength filters to reduce false signals
- Develop adaptive profit target calculation methods
Summary
This strategy establishes a complete trading system by combining trend and momentum indicators. Its core strengths lie in its clear logical framework and strict risk control, though practical application requires parameter optimization based on specific market conditions. Through continuous improvement and optimization, the strategy has the potential to maintain stable performance across various market environments. [/trans]
Source (PineScript)
/*backtest
start: 2024-12-06 00:00:00
end: 2025-01-04 08:00:00
period: 1h
basePeriod: 1h
exchanges: [{"eid":"Futures_Binance","currency":"BTC_USDT"}]
*/

//@version=6
strategy("EMA + Stochastic Strategy", overlay=true)

// Inputs for EMA
emaShortLength = input.int(20, title="Short EMA Length")
emaLongLength = input.int(50, title="Long EMA Length")

// Inputs for Stochastic
stochK = input.int(14, title="Stochastic %K Length")
stochD = input.int(3, title="Stochastic %D Smoothing")
stochOverbought = input.int(85, title="Stochastic Overbought Level")
stochOversold = input.int(15, title="Stochastic Oversold Level")

// Inputs for Risk Management
riskRewardRatio = input.float(2.0, title="Risk-Reward Ratio")
stopLossPercent = input.float(1.0, title="Stop Loss (%)")

// EMA Calculation
emaShort = ta.ema(close, emaShortLength)
emaLong = ta.ema(close, emaLongLength)

// Stochastic Calculation
k = ta.stoch(high, low, close, stochK)
d = ta.sma(k, stochD)

// Trend Condition
isUptrend = emaShort > emaLong
isDowntrend = emaShort < emaLong

// Stochastic Signals
stochBuyCrossover = ta.crossover(k, d)
stochBuySignal = k < stochOversold and stochBuyCrossover
stochSellCrossunder = ta.crossunder(k, d)
stochSellSignal = k > stochOverbought and stochSellCrossunder

// Entry Signals
buySignal = isUptrend and stochBuySignal
sellSignal = isDowntrend and stochSellSignal

// Strategy Execution
if buySignal
    strategy.entry("Buy", strategy.long)
    stopLoss = close * (1 - stopLossPercent / 100)
    takeProfit = close * (1 + stopLossPercent * riskRewardRatio / 100)
    strategy.exit("Take Profit/Stop Loss", from_entry="Buy", stop=stopLoss, limit=takeProfit)

if sellSignal
    strategy.entry("Sell", strategy.short)
    stopLoss = close * (1 + stopLossPercent / 100)
    takeProfit = close * (1 - stopLossPercent * riskRewardRatio / 100)
    strategy.exit("Take Profit/Stop Loss", from_entry="Sell", stop=stopLoss, limit=takeProfit)

// Plotting
plot(emaShort, color=color.blue, title="Short EMA")
plot(emaLong, color=color.red, title="Long EMA")
Detail
https://www.fmz.com/strategy/477533
Last Modified
2025-01-06 11:48:55