
7.5 KiB
Name
双均线趋势跟踪与风险控制策略-Dual-Moving-Average-Trend-Following-Strategy-with-Risk-Management
Author
ChaoZhang
Strategy Description
[trans]
概述
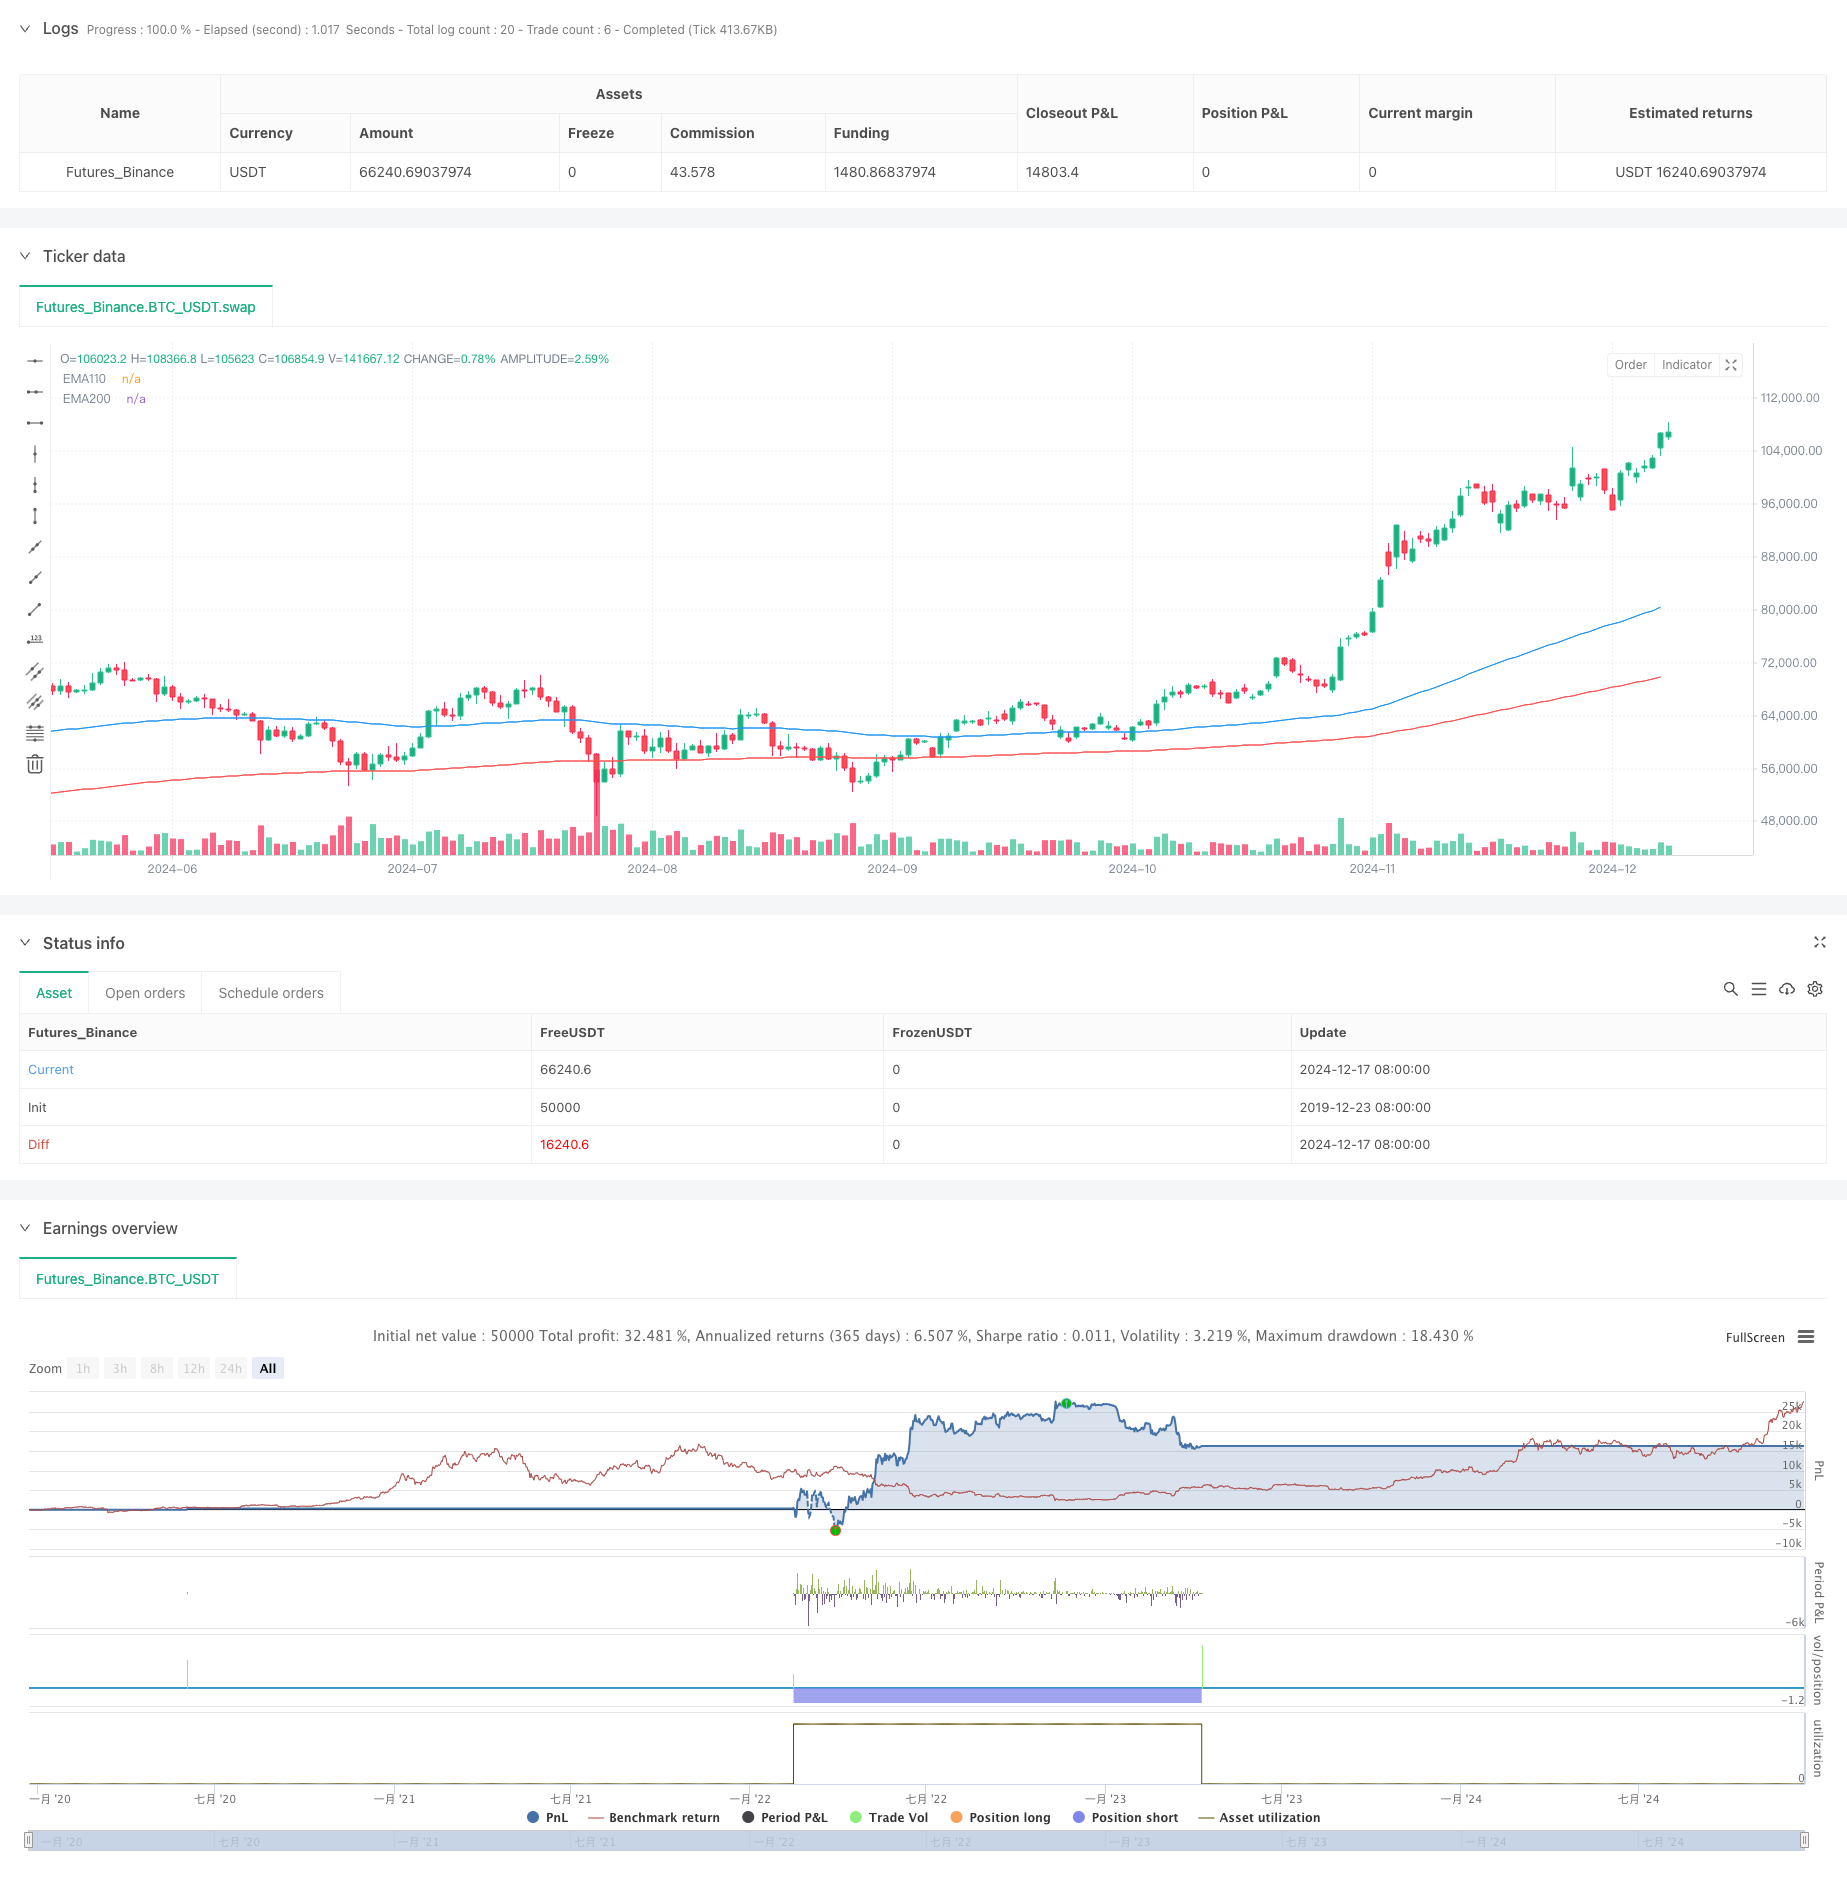
本策略是一个基于110日与200日指数移动平均线(EMA)交叉的趋势跟踪交易系统。策略通过观察短周期EMA对长周期EMA的穿越来判断市场趋势,并结合止损止盈机制来控制风险。系统在确认趋势信号后,会自动执行相应的多空交易操作,同时实时监控持仓风险。
策略原理
策略的核心逻辑基于价格趋势的延续性特征,通过EMA110与EMA200的交叉来捕捉趋势转换信号。当短期均线(EMA110)上穿长期均线(EMA200)时,表明上升趋势形成,系统发出做多信号;当短期均线下穿长期均线时,表明下降趋势形成,系统发出做空信号。为了控制风险,策略在每次开仓的同时都会设置1%的止损位和0.5%的止盈位,以保护既得利润和限制可能的损失。
策略优势
- 趋势把握能力强:通过双均线交叉捕捉中长期趋势,能有效过滤短期市场噪音
- 风险控制完善:集成了止损止盈机制,可以有效控制单笔交易风险
- 执行逻辑严谨:在开新仓位前会自动平掉反向持仓,避免重复建仓
- 信号提示清晰:通过界面右上角的信号提示表格,直观展示交易信号
- 参数设置合理:选择110日和200日作为均线周期,能较好地平衡灵敏度和稳定性
策略风险
- 震荡市场风险:在横盘震荡市场中可能频繁交易导致亏损
- 滑点风险:在市场波动剧烈时可能面临较大的成交滑点
- 趋势反转风险:趋势突然反转时止损可能不够及时
- 参数优化风险:过度优化参数可能导致策略过拟合
- 系统性风险:在市场剧烈波动时可能面临系统性风险
策略优化方向
- 引入成交量指标:结合成交量分析来确认趋势的有效性
- 优化止损机制:可考虑使用移动止损或ATR动态止损
- 增加趋势过滤器:加入趋势强度指标来过滤弱趋势信号
- 完善仓位管理:根据趋势强度动态调整持仓规模
- 加入回撤控制:设置最大回撤限制,在达到阈值时暂停交易
总结
该策略通过均线交叉捕捉趋势,并结合止损止盈机制来管理风险,整体设计合理,逻辑严谨。虽然在震荡市场中可能表现欠佳,但通过建议的优化方向,可以进一步提升策略的稳定性和盈利能力。策略适合追求稳健收益的中长期投资者使用。 ||
Overview
This strategy is a trend-following trading system based on the crossover of 110-day and 200-day Exponential Moving Averages (EMA). It identifies market trends through the intersection of short-term and long-term EMAs, incorporating stop-loss and take-profit mechanisms for risk control. The system automatically executes long and short positions upon trend confirmation while continuously monitoring position risk.
Strategy Principle
The core logic relies on the continuity of price trends, using EMA110 and EMA200 crossovers to capture trend reversal signals. When the shorter-term moving average (EMA110) crosses above the longer-term moving average (EMA200), it signals an uptrend formation, triggering a long position. Conversely, when the shorter-term moving average crosses below the longer-term moving average, it signals a downtrend formation, triggering a short position. For risk management, the strategy sets a 1% stop-loss and 0.5% take-profit level for each position to protect profits and limit potential losses.
Strategy Advantages
- Strong trend capture capability: Effectively filters short-term market noise through dual moving average crossovers
- Comprehensive risk control: Integrated stop-loss and take-profit mechanisms effectively control single-trade risk
- Rigorous execution logic: Automatically closes reverse positions before opening new ones, avoiding position overlap
- Clear signal indication: Trade signals are clearly displayed in the top-right corner table
- Reasonable parameter settings: 110-day and 200-day periods balance sensitivity and stability
Strategy Risks
- Sideways market risk: Frequent trading in range-bound markets may lead to losses
- Slippage risk: Significant slippage may occur during high market volatility
- Trend reversal risk: Stop-losses may not trigger quickly enough during sudden trend reversals
- Parameter optimization risk: Over-optimization may lead to strategy overfitting
- Systemic risk: Exposure to systemic risks during extreme market conditions
Strategy Optimization Directions
- Incorporate volume indicators: Confirm trend validity through volume analysis
- Optimize stop-loss mechanism: Consider implementing trailing stops or ATR-based dynamic stops
- Add trend filters: Integrate trend strength indicators to filter weak signals
- Improve position management: Dynamically adjust position sizes based on trend strength
- Implement drawdown control: Set maximum drawdown limits to pause trading when thresholds are reached
Summary
The strategy captures trends through moving average crossovers while managing risk through stop-loss and take-profit mechanisms, demonstrating sound design and logical rigor. Although it may underperform in ranging markets, the suggested optimizations can further enhance strategy stability and profitability. The strategy is suitable for medium to long-term investors seeking steady returns.[/trans]
Source (PineScript)
/*backtest
start: 2019-12-23 08:00:00
end: 2024-12-18 08:00:00
period: 1d
basePeriod: 1d
exchanges: [{"eid":"Futures_Binance","currency":"BTC_USDT"}]
*/

//@version=5
strategy("EMA110/200 Cross with Stop-Loss and Take-Profit", overlay=true)

// 定义EMA110和EMA200
ema110 = ta.ema(close, 110)
ema200 = ta.ema(close, 250)

// 画出EMA
plot(ema110, color=color.blue, title="EMA110")
plot(ema200, color=color.red, title="EMA200")

// 计算交叉信号
longCondition = ta.crossover(ema110, ema200)  // EMA110上穿EMA200,做多
shortCondition = ta.crossunder(ema110, ema200)  // EMA110下穿EMA200,做空

// 设置止损和止盈
stopLoss = 0.01  // 止损1%
takeProfit = 0.005  // 止盈0.5%

// 判断是否已有仓位
isLong = strategy.position_size > 0  // 当前是否为多头仓位
isShort = strategy.position_size < 0  // 当前是否为空头仓位

// 执行策略:做多时平空,做空时平多
if (longCondition and not isLong)  // 如果满足做多条件并且当前没有多头仓位
    if (isShort)  // 如果当前是空头仓位,先平空
        strategy.close("Short")
    strategy.entry("Long", strategy.long)  // 执行做多
    strategy.exit("Take Profit/Stop Loss", "Long", stop=close * (1 - stopLoss), limit=close * (1 + takeProfit))

if (shortCondition and not isShort)  // 如果满足做空条件并且当前没有空头仓位
    if (isLong)  // 如果当前是多头仓位,先平多
        strategy.close("Long")
    strategy.entry("Short", strategy.short)  // 执行做空
    strategy.exit("Take Profit/Stop Loss", "Short", stop=close * (1 + stopLoss), limit=close * (1 - takeProfit))

// 在表格中显示信号
var table myTable = table.new(position.top_right, 1, 1)
if (longCondition and not isLong)
    table.cell(myTable, 0, 0, "Buy Signal", text_color=color.green)
if (shortCondition and not isShort)
    table.cell(myTable, 0, 0, "Sell Signal", text_color=color.red)
Detail
https://www.fmz.com/strategy/475597
Last Modified
2024-12-20 14:30:29