
18 KiB
Name
双均线趋势回调自适应ATR止盈止损量化交易策略-Dual-MA-Trend-Pullback-Trading-Strategy-with-Adaptive-ATR-Based-Risk-Management
Author
ianzeng123
Strategy Description
[trans]
策略概述
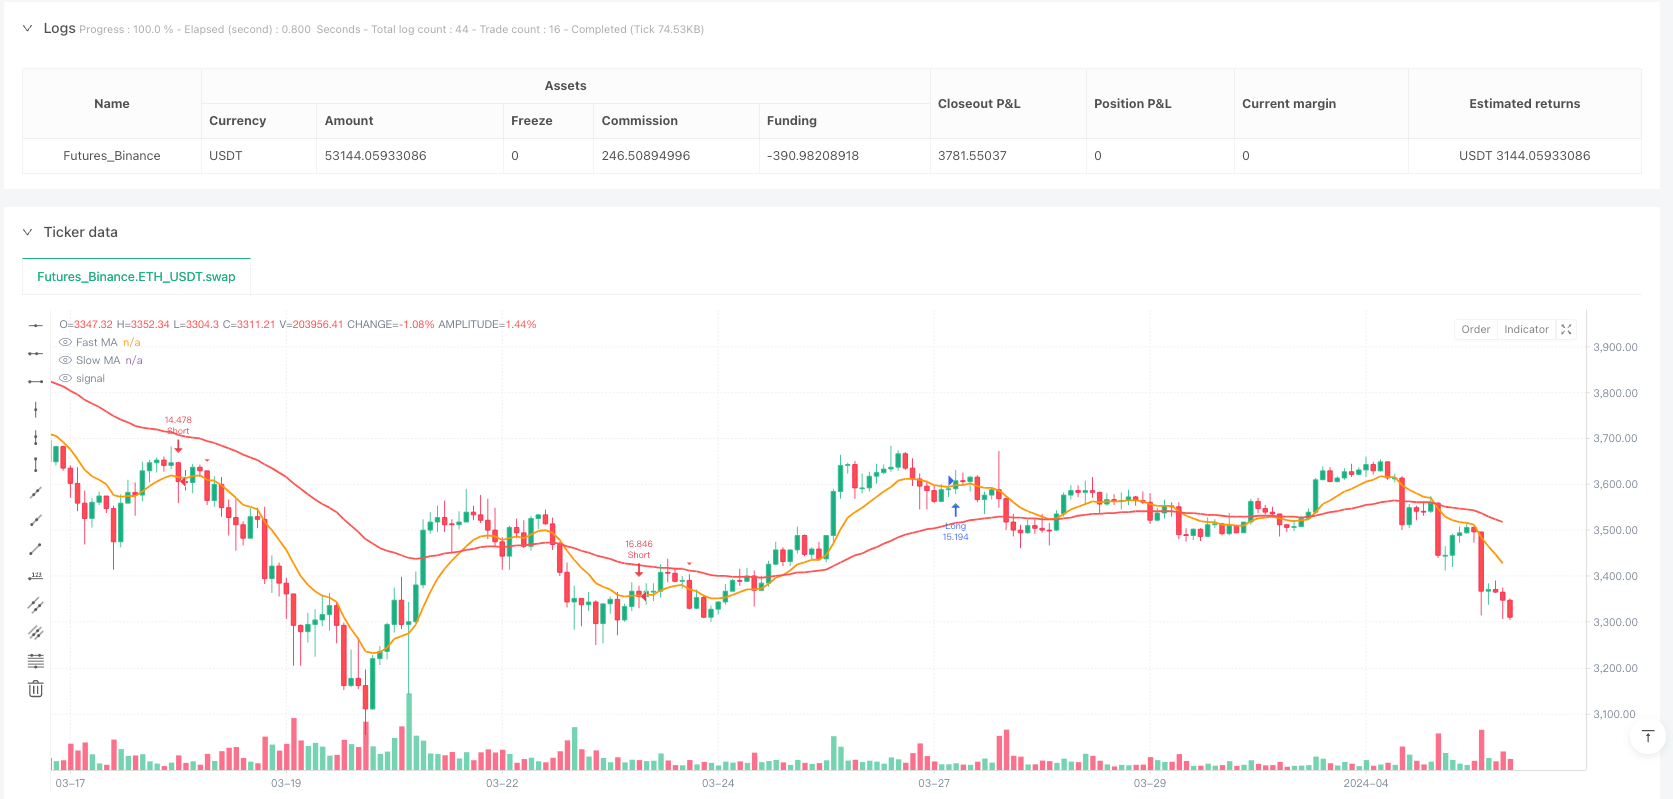
本策略是一种基于双均线系统的趋势跟踪回调交易策略,结合了自适应ATR止损和优化的止盈比例设计。策略核心是识别主趋势方向,然后在趋势回调并反转时进场交易,同时采用基于市场波动性的风险管理方法。该策略通过快速均线和慢速均线的位置关系判断市场趋势,在确认趋势后等待回调机会,当价格从回调中恢复并穿越快速均线时产生交易信号。策略应用了精心设计的风险管理模块,使用ATR指标动态调整止损位置,并采用1:2的风险收益比设置止盈目标。
策略原理
该策略基于以下核心原理构建:
-
趋势识别机制: 使用10周期EMA(快线)和50周期EMA(慢线)构建双均线系统。当快线位于慢线上方时,判定为上升趋势;当快线位于慢线下方时,判定为下降趋势。
-
回调确认逻辑: 在上升趋势中,当收盘价低于快速均线但最低价仍高于慢速均线时,视为潜在买入回调;在下降趋势中,当收盘价高于快速均线但最高价仍低于慢速均线时,视为潜在卖出反弹。
-
入场信号生成:
- 多头入场:上升趋势中,前一周期出现回调,且当前周期开盘低于快线但收盘高于快线,形成向上突破
- 空头入场:下降趋势中,前一周期出现反弹,且当前周期开盘高于快线但收盘低于快线,形成向下突破
-
风险管理系统:
- 止损设置:基于ATR值(14周期)乘以可调倍数(默认2.0)
- 止盈目标:采用1:2的风险收益比,止盈距离为止损距离的2倍
该策略实现了在趋势行情中寻找高概率回调入场点的机制,通过等待价格回调至均线附近,然后在回调结束信号出现时入场,最大化了趋势跟踪的优势同时降低了入场成本。
策略优势
-
趋势确认与回调结合: 策略不仅跟随主趋势方向交易,还通过等待回调降低了入场点位,提高了风险收益比。与简单趋势跟踪策略相比,这种方法可以避免在趋势高点或低点附近入场,减少了逆势风险。
-
自适应风险管理: 通过ATR指标动态调整止损水平,策略能够根据当前市场波动性自适应调整风险暴露。这意味着在波动性增加时自动扩大止损距离,在波动性减小时缩小止损距离,有效防止被市场噪音震出。
-
清晰的入场与出场规则: 策略具有明确的入场条件和出场规则,减少了主观判断和情绪干扰。快线与收盘价的交叉提供了清晰的信号,使策略执行更加简单直接。
-
风险收益比优化: 通过设置止盈为止损距离的2倍,策略确保了有利的风险收益比,即使胜率不高也能保持长期盈利能力。
-
资金管理集成: 策略默认使用总资金的100%进行交易,并考虑了0.01%的佣金成本,使回测结果更加接近实际交易情况。
策略风险
-
震荡市场表现欠佳: 在无明显趋势的震荡市场中,该策略可能产生频繁的错误信号,导致连续止损。当快速均线和慢速均线频繁交叉时,趋势判断准确性下降,建议在明确趋势形成前暂停策略运行。
-
参数优化风险: 均线周期(10和50)和ATR乘数(2.0)的选择会显著影响策略表现。过度拟合历史数据的风险较高,建议在不同市场条件和时间框架下进行稳健性测试,并考虑使用自适应或动态参数。
-
快速反转风险: 在强劲趋势突然反转的情况下,策略可能无法及时适应新趋势,造成较大损失。特别是当价格跳空超过止损范围时,实际止损可能比预期更差。
-
流动性风险: 在流动性较差的市场中,策略的实际执行价格可能与回测结果有显著差异,尤其是在波动性突然增加时,滑点可能导致止损和止盈执行不理想。
-
回调识别局限性: 当前回调识别机制相对简单,仅依赖价格与均线的关系,可能无法识别所有有效回调,或误判复杂的价格结构。
减轻风险的方法包括:增加过滤条件(如波动率过滤器),优化参数适应不同市场阶段,增加趋势强度确认指标,以及实施部分仓位管理而非全仓交易。
策略优化方向
- 增加趋势强度过滤器: 当前策略仅使用均线交叉判断趋势,可以考虑增加ADX、DMI等趋势强度指标作为过滤条件,仅在强趋势确认时执行交易,提高信号质量。优化代码示例:
adx = ta.adx(14)
strong_trend = adx > 25
long_entry = long_entry and strong_trend
short_entry = short_entry and strong_trend
-
动态调整风险收益比: 目前策略使用固定的1:2风险收益比,可以根据市场波动性或趋势强度动态调整,在强趋势中采用更大的收益目标,在弱趋势中采用更保守的设置。
-
增加多重时间框架分析: 将更大时间框架的趋势判断作为过滤条件,确保交易方向与更大周期趋势一致,减少逆势交易。可通过引入更大时间框架的均线数据实现。
-
优化回调识别机制: 当前回调识别相对简单,可考虑增加动量指标(如RSI、随机指标)辅助判断回调结束时机,或使用支撑/阻力水平作为额外参考。
-
实现部分仓位管理: 可以基于信号强度、市场波动性或趋势强度来调整每次交易的资金比例,而非总是使用100%资金,这有助于分散风险并优化资本效率。
-
引入时间过滤器: 避免在市场开盘、收盘或重要新闻发布前后交易,减少异常波动带来的风险。可以通过时间条件过滤信号实现。
-
增加盈利保护机制: 实现移动止损或在达到特定盈利目标后保护部分利润的功能,改善整体风险管理效果。
总结
"双均线趋势回调自适应ATR止盈止损量化交易策略"是一个结合趋势跟踪和回调入场优势的完整交易系统。该策略通过快慢均线确定趋势方向,等待价格回调至均线附近后,在回调结束迹象出现时入场,同时应用基于ATR的动态风险管理机制确保每笔交易的风险可控。
策略的主要优势在于低成本入场、自适应风险控制和明确的交易规则,使其适合在具有明确趋势的市场中应用。然而,在震荡市场中表现可能不佳,需要额外的过滤机制提高信号质量。
未来优化方向包括增加趋势强度过滤、动态调整风险收益比、多时间框架分析和改进回调识别机制等。通过这些优化,策略有望在不同市场环境中保持稳健表现,提高长期盈利能力。
该策略融合了技术分析中的多个关键概念,对于理解趋势跟踪、回调交易和风险管理的交易者具有很好的参考价值。它提供了一个可扩展的框架,可根据个人交易风格和目标市场特性进一步定制和优化。 ||
Strategy Overview
This strategy is a trend-following pullback trading system based on a dual moving average framework, combined with adaptive ATR stop-loss and optimized profit-taking ratio design. The core of the strategy is to identify the main trend direction, then enter trades when the price pulls back and reverses, while employing a risk management method based on market volatility. The strategy determines market trends through the positional relationship between fast and slow moving averages, waits for pullback opportunities after confirming the trend, and generates trading signals when the price recovers from the pullback and crosses the fast moving average. The strategy implements a carefully designed risk management module that uses the ATR indicator to dynamically adjust stop-loss positions and employs a 1:2 risk-reward ratio to set profit targets.
Strategy Principles
This strategy is built on the following core principles:
-
Trend Identification Mechanism: Uses a dual moving average system consisting of a 10-period EMA (fast line) and a 50-period EMA (slow line). When the fast line is above the slow line, an uptrend is identified; when the fast line is below the slow line, a downtrend is identified.
-
Pullback Confirmation Logic: In an uptrend, when the closing price falls below the fast moving average but the low remains above the slow moving average, it is considered a potential buying pullback; in a downtrend, when the closing price rises above the fast moving average but the high remains below the slow moving average, it is considered a potential selling rally.
-
Entry Signal Generation:
- Long entry: In an uptrend, a pullback occurs in the previous period, and the current period opens below the fast line but closes above it, forming an upward breakout
- Short entry: In a downtrend, a rally occurs in the previous period, and the current period opens above the fast line but closes below it, forming a downward breakout
-
Risk Management System:
- Stop-loss setting: Based on the ATR value (14-period) multiplied by an adjustable factor (default 2.0)
- Profit target: Uses a 1:2 risk-reward ratio, with the profit target set at twice the stop-loss distance
This strategy implements a mechanism for finding high-probability entry points during trending markets by waiting for price pullbacks near the moving averages, then entering when signals of pullback completion appear, maximizing the advantages of trend following while reducing entry costs.
Strategy Advantages
-
Combination of Trend Confirmation and Pullback: The strategy not only follows the main trend direction but also waits for pullbacks to lower entry points, improving the risk-reward ratio. Compared to simple trend-following strategies, this approach avoids entering near trend tops or bottoms, reducing counter-trend risk.
-
Adaptive Risk Management: By dynamically adjusting stop-loss levels using the ATR indicator, the strategy can adapt its risk exposure according to current market volatility. This means automatically widening stop-loss distances when volatility increases and narrowing them when volatility decreases, effectively preventing being shaken out by market noise.
-
Clear Entry and Exit Rules: The strategy has explicit entry conditions and exit rules, reducing subjective judgment and emotional interference. The crossover between the fast line and closing price provides clear signals, making strategy execution simpler and more direct.
-
Optimized Risk-Reward Ratio: By setting profit targets at twice the stop-loss distance, the strategy ensures a favorable risk-reward ratio, maintaining long-term profitability even with a moderate win rate.
-
Integrated Capital Management: The strategy defaults to using 100% of total funds for trading and considers a 0.01% commission cost, making backtesting results closer to actual trading conditions.
Strategy Risks
-
Poor Performance in Ranging Markets: In oscillating markets without clear trends, the strategy may generate frequent false signals, leading to consecutive stop-losses. When fast and slow moving averages frequently cross, trend judgment accuracy decreases. It is recommended to pause strategy operation until a clear trend forms.
-
Parameter Optimization Risk: The choice of moving average periods (10 and 50) and ATR multiplier (2.0) significantly affects strategy performance. There is a high risk of overfitting historical data. It is recommended to conduct robustness tests under different market conditions and timeframes, and consider using adaptive or dynamic parameters.
-
Rapid Reversal Risk: In cases of sudden trend reversals, the strategy may not adapt to the new trend in time, causing significant losses. Especially when prices gap beyond the stop-loss range, actual losses may be worse than expected.
-
Liquidity Risk: In markets with poor liquidity, actual execution prices may differ significantly from backtesting results, particularly when volatility suddenly increases, slippage may cause less-than-ideal execution of stops and targets.
-
Pullback Identification Limitations: The current pullback identification mechanism is relatively simple, relying only on price relationships with moving averages, and may not identify all effective pullbacks or may misjudge complex price structures.
Methods to mitigate risks include: adding filtering conditions (such as volatility filters), optimizing parameters for different market phases, adding trend strength confirmation indicators, and implementing partial position management rather than full position trading.
Strategy Optimization Directions
- Add Trend Strength Filter: The current strategy only uses moving average crossovers to determine trends. Consider adding trend strength indicators such as ADX or DMI as filtering conditions, executing trades only when strong trends are confirmed to improve signal quality. Optimization code example:
adx = ta.adx(14)
strong_trend = adx > 25
long_entry = long_entry and strong_trend
short_entry = short_entry and strong_trend
-
Dynamic Risk-Reward Ratio Adjustment: The strategy currently uses a fixed 1:2 risk-reward ratio. This can be dynamically adjusted based on market volatility or trend strength, adopting larger profit targets in strong trends and more conservative settings in weak trends.
-
Add Multiple Timeframe Analysis: Use trend judgments from larger timeframes as filtering conditions to ensure trade direction aligns with the larger cycle trend, reducing counter-trend trading. This can be implemented by introducing moving average data from larger timeframes.
-
Optimize Pullback Identification Mechanism: The current pullback identification is relatively simple. Consider adding momentum indicators (such as RSI or stochastic oscillators) to assist in judging pullback completion timing, or use support/resistance levels as additional references.
-
Implement Partial Position Management: Adjust the funding ratio for each trade based on signal strength, market volatility, or trend strength, rather than always using 100% funds. This helps diversify risk and optimize capital efficiency.
-
Introduce Time Filters: Avoid trading before and after market open, close, or important news releases to reduce risks from abnormal fluctuations. This can be implemented by filtering signals with time conditions.
-
Add Profit Protection Mechanism: Implement moving stop-loss or protect partial profits after reaching specific profit targets to improve overall risk management effectiveness.
Summary
The "Dual-MA Trend Pullback Trading Strategy with Adaptive ATR-Based Risk Management" is a complete trading system combining the advantages of trend following and pullback entry. The strategy determines trend direction through fast and slow moving averages, waits for price pullbacks near the moving averages, enters when signs of pullback completion appear, and applies an ATR-based dynamic risk management mechanism to ensure controllable risk for each trade.
The main advantages of the strategy lie in low-cost entry, adaptive risk control, and clear trading rules, making it suitable for application in markets with clear trends. However, performance may be poor in oscillating markets, requiring additional filtering mechanisms to improve signal quality.
Future optimization directions include adding trend strength filtering, dynamically adjusting risk-reward ratios, multi-timeframe analysis, and improving pullback identification mechanisms. Through these optimizations, the strategy has the potential to maintain robust performance in different market environments and improve long-term profitability.
This strategy integrates multiple key concepts in technical analysis and provides valuable reference for traders who understand trend following, pullback trading, and risk management. It provides an extensible framework that can be further customized and optimized according to individual trading styles and target market characteristics.[/trans]
Source (PineScript)
/*backtest
start: 2024-03-02 00:00:00
end: 2024-04-02 19:00:00
period: 2h
basePeriod: 2h
exchanges: [{"eid":"Futures_Binance","currency":"ETH_USDT"}]
*/

//@version=5
// Pullback Strategy
strategy("Pullback Strategy", overlay=true, initial_capital=100000, default_qty_type=strategy.percent_of_equity, default_qty_value=100, commission_type=strategy.commission.percent, commission_value=0.01)

// Inputs
i_fast_ma_length = input.int(10, "Fast MA Length", minval=1)
i_slow_ma_length = input.int(50, "Slow MA Length", minval=1)
i_atr_period = input.int(14, "ATR Period", minval=1)
i_sl_multiplier = input.float(2.0, "Stop Loss Multiplier", minval=0.1, step=0.1)

// Moving Averages
fast_ma = ta.ema(close, i_fast_ma_length)
slow_ma = ta.ema(close, i_slow_ma_length)

// Trend Determination
trend_up = fast_ma > slow_ma
trend_down = fast_ma < slow_ma

// ATR Calculation
atr = ta.atr(i_atr_period)

// Pullback in Progress for Long
pullback_in_progress = trend_up and close < fast_ma and low > slow_ma

// Long Entry Condition
long_entry = trend_up and pullback_in_progress[1] and open < fast_ma and close > fast_ma

// Rally in Progress for Short
rally_in_progress = trend_down and close > fast_ma and high < slow_ma

// Short Entry Condition
short_entry = trend_down and rally_in_progress[1] and open > fast_ma and close < fast_ma

// Long Entry and Exit
if long_entry
    entry_price = close
    stop_loss_price = entry_price - (atr * i_sl_multiplier)
    take_profit_price = entry_price + (2 * (entry_price - stop_loss_price))
    strategy.entry("Long", strategy.long)
    strategy.exit("Long Exit", "Long", stop=stop_loss_price, limit=take_profit_price)

// Short Entry and Exit
if short_entry
    entry_price = close
    stop_loss_price = entry_price + (atr * i_sl_multiplier)
    take_profit_price = entry_price - (2 * (stop_loss_price - entry_price))
    strategy.entry("Short", strategy.short)
    strategy.exit("Short Exit", "Short", stop=stop_loss_price, limit=take_profit_price)

// Plotting MAs
plot(fast_ma, color=color.orange, linewidth=2, title="Fast MA")
plot(slow_ma, color=color.red, linewidth=2, title="Slow MA")

// Plotting Entry Points
plotshape(long_entry, title="Long Entry", style=shape.triangleup, color=color.green, location=location.belowbar)
plotshape(short_entry, title="Short Entry", style=shape.triangledown, color=color.red, location=location.abovebar)
Detail
https://www.fmz.com/strategy/484578
Last Modified
2025-03-03 09:49:20