
13 KiB
Name
双均线滞后突破策略Dual-Moving-Average-Lagging-Breakout-Strategy
Author
ChaoZhang
Strategy Description
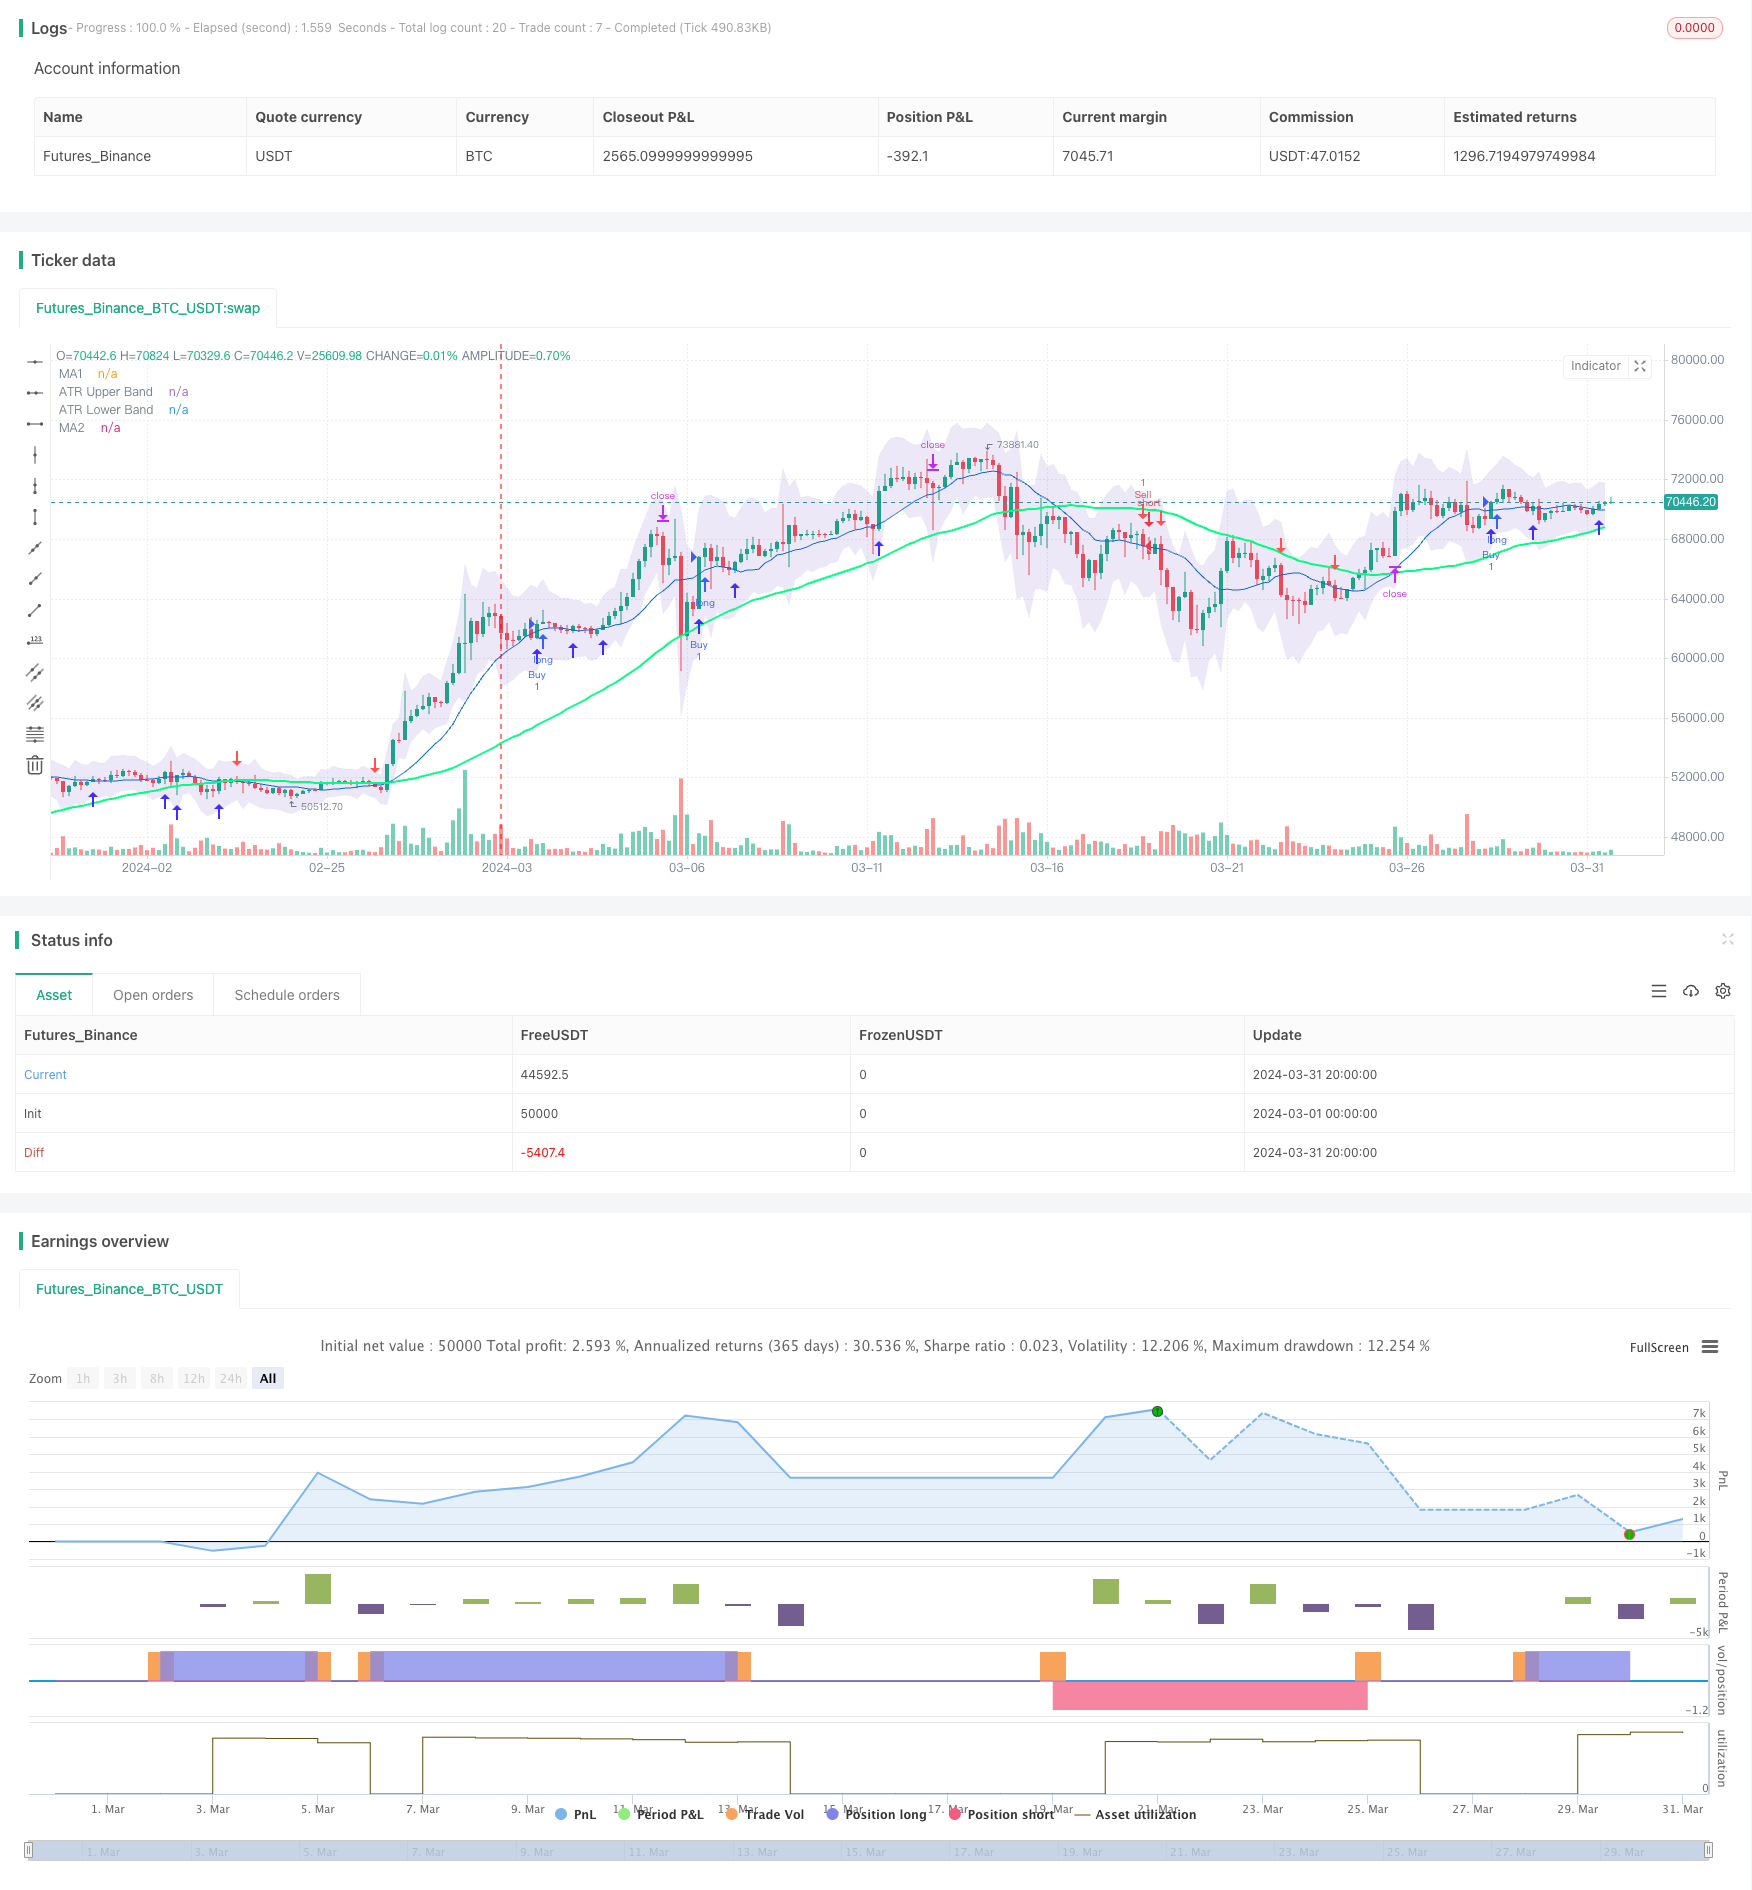
[trans]
概述
"双均线滞后突破策略"是一种常用的技术分析交易策略。该策略结合了两条不同周期的简单移动平均线(SMA)和平均真实波幅(ATR)指标,旨在捕捉市场趋势转折点,实现低风险高收益的交易。其核心思路是利用均线的滞后性和市场波动性,当价格突破均线且波动率处于可控范围内时产生交易信号。
策略原理
该策略的主要原理如下:
- 计算两条不同周期的简单移动平均线(SMA),默认周期分别为14和50。
- 计算ATR指标,用于衡量市场波动率,默认周期为14。
- 绘制ATR上下轨,作为价格波动的参考区间。上轨由最高价加上ATR乘以倍数(默认1.5)得到,下轨由最低价减去ATR乘以倍数得到。
- 当收盘价上穿短期均线且短期均线在长期均线之上时,产生做多信号,并在K线下方绘制向上箭头。
- 当收盘价下穿短期均线且短期均线在长期均线之下时,产生做空信号,并在K线上方绘制向下箭头。
- 设置止损和止盈位,止损位为最低价减去ATR乘以倍数,止盈位为开仓价加上(开仓价-止损位)乘以2倍。
通过以上原理可以看出,该策略结合均线系统的趋势判断和ATR指标的波动率衡量,以趋势跟踪为主,同时控制回撤风险,是一个趋势型策略。
优势分析
"双均线滞后突破策略"具有以下优势:
- 趋势跟踪:通过均线系统判断趋势方向,捕捉大的市场趋势,顺应市场。
- 风险控制:利用ATR指标衡量市场波动率,设置合理的止损位,将回撤控制在可接受范围内。
- 参数灵活:均线周期、ATR周期和倍数等参数可以根据不同市场和品种进行优化和调整,具有一定的普适性。
- 直观明了:交易信号简单明了,适合不同层次的投资者使用。
风险分析
尽管该策略具有一定优势,但仍存在以下风险:
- 频繁交易:当市场波动较大、趋势不明显时,该策略可能产生频繁的交易信号,增加交易成本。
- 滞后性:均线系统本质上具有一定的滞后性,在市场转折初期可能出现一定的回撤。
- 参数优化:不同参数设置对策略表现有较大影响,需要针对不同市场和品种进行参数优化,增加了实施难度。
针对以上风险,可以从以下方面进行优化和改进:
- 引入趋势过滤:在产生交易信号前,先判断大周期的趋势方向,只有在大周期趋势明确的情况下才进行交易,减少频繁交易。
- 优化止损止盈:可以考虑引入移动止损、波动率止损等动态止损方式,以及根据市场波动率动态调整止盈位,提高策略灵活性。
- 组合优化:将该策略与其他技术指标或者基本面因素相结合,提高策略稳健性。
优化方向
该策略可以从以下几个方面进行优化:
- 参数自适应优化:针对不同品种和周期,自动寻找最优参数组合,减少人工参数调试的工作量。可以采用遗传算法、网格搜索等方法进行优化。
- 信号过滤:在产生交易信号后,可以进一步引入其他技术指标或者基本面因素对信号进行二次确认,提高信号质量。比如加入成交量指标,判断趋势强度;加入宏观经济数据,判断大环境是否有利于趋势延续。
- 仓位管理:在开仓时,可以根据市场波动率、账户风险等因素动态调整仓位大小,控制单笔交易风险。比如采用凯利公式、固定比例法等方法进行仓位管理。
- 移动止损:初始止损位是固定的,随着价格向有利方向移动,可以考虑将止损位也向有利方向移动,降低回撤,提高资金利用效率。常见的有追踪止损、破位止损等方法。
以上优化可以提高策略的适应性、稳健性和盈利能力,但需要注意的是,过度优化可能导致策略曲线拟合,在样本外表现不佳,因此需要在样本内外进行充分的回测验证。
总结
"双均线滞后突破策略"是一个经典的趋势跟踪型策略,通过均线系统判断趋势方向,利用ATR指标控制风险,在捕捉趋势行情的同时兼顾风险管理。尽管存在一定的滞后性和频繁交易的问题,但通过优化止损止盈、引入信号过滤、参数自适应优化、仓位管理等方法,可以进一步提升该策略的表现,使其成为一个实用的量化交易策略。
||
Overview
The "Dual Moving Average Lagging Breakout Strategy" is a commonly used technical analysis trading strategy. This strategy combines two simple moving averages (SMAs) with different periods and the Average True Range (ATR) indicator, aiming to capture turning points in market trends and achieve low-risk, high-return trading. Its core idea is to utilize the lagging nature of moving averages and market volatility, generating trading signals when prices break through moving averages and the volatility is within a controllable range.
Strategy Principle
The main principles of this strategy are as follows:
- Calculate two simple moving averages (SMAs) with different periods, with default periods of 14 and 50.
- Calculate the ATR indicator to measure market volatility, with a default period of 14.
- Plot ATR upper and lower bands as reference ranges for price fluctuations. The upper band is obtained by adding the ATR multiplied by a factor (default 1.5) to the highest price, and the lower band is obtained by subtracting the ATR multiplied by the factor from the lowest price.
- When the closing price crosses above the short-term moving average and the short-term moving average is above the long-term moving average, a long signal is generated, and an upward arrow is drawn below the candlestick.
- When the closing price crosses below the short-term moving average and the short-term moving average is below the long-term moving average, a short signal is generated, and a downward arrow is drawn above the candlestick.
- Set stop-loss and take-profit levels. The stop-loss level is the lowest price minus the ATR multiplied by the factor, and the take-profit level is the entry price plus (entry price - stop-loss level) multiplied by 2.
From the above principles, it can be seen that this strategy combines the trend judgment of the moving average system and the volatility measurement of the ATR indicator, focusing on trend following while controlling drawdown risk, making it a trend-following strategy.
Advantage Analysis
The "Dual Moving Average Lagging Breakout Strategy" has the following advantages:
- Trend tracking: It judges the trend direction through the moving average system, captures major market trends, and follows the market.
- Risk control: It utilizes the ATR indicator to measure market volatility and sets reasonable stop-loss levels to keep drawdowns within an acceptable range.
- Flexible parameters: Parameters such as moving average periods, ATR period, and multiplier can be optimized and adjusted according to different markets and instruments, providing a certain degree of universality.
- Simple and straightforward: Trading signals are simple and clear, suitable for investors at different levels.
Risk Analysis
Although this strategy has certain advantages, it still has the following risks:
- Frequent trading: When the market is highly volatile and the trend is unclear, this strategy may generate frequent trading signals, increasing trading costs.
- Lag: The moving average system inherently has a certain lag, and there may be some drawdown at the beginning of market turning points.
- Parameter optimization: Different parameter settings have a significant impact on strategy performance, requiring parameter optimization for different markets and instruments, increasing the difficulty of implementation.
To address the above risks, the strategy can be optimized and improved from the following aspects:
- Introduce trend filtering: Before generating trading signals, first determine the trend direction of the larger timeframe, and only trade when the trend is clear in the larger timeframe, reducing frequent trading.
- Optimize stop-loss and take-profit: Consider introducing dynamic stop-loss methods such as trailing stop-loss and volatility stop-loss, as well as dynamically adjusting take-profit levels based on market volatility to improve strategy flexibility.
- Combination optimization: Combine this strategy with other technical indicators or fundamental factors to improve the robustness of the strategy.
Optimization Direction
This strategy can be optimized from the following aspects:
- Adaptive parameter optimization: For different instruments and timeframes, automatically find the optimal parameter combination to reduce the workload of manual parameter tuning. Methods such as genetic algorithms and grid search can be used for optimization.
- Signal filtering: After generating trading signals, further introduce other technical indicators or fundamental factors for secondary confirmation of signals to improve signal quality. For example, add volume indicators to judge trend strength; add macroeconomic data to determine whether the overall environment is conducive to trend continuation.
- Position management: When opening positions, dynamically adjust position size based on factors such as market volatility and account risk to control single-trade risk. Methods such as the Kelly formula and fixed ratio method can be used for position management.
- Trailing stop-loss: The initial stop-loss level is fixed. As the price moves in a favorable direction, consider moving the stop-loss level in the favorable direction as well to reduce drawdown and improve capital utilization efficiency. Common methods include trailing stop-loss and breakout stop-loss.
The above optimizations can improve the adaptability, robustness, and profitability of the strategy, but it should be noted that over-optimization may lead to curve fitting, resulting in poor out-of-sample performance. Therefore, sufficient backtesting and validation should be conducted both in-sample and out-of-sample.
Summary
The "Dual Moving Average Lagging Breakout Strategy" is a classic trend-following strategy that determines trend direction through the moving average system and controls risk using the ATR indicator, capturing trend movements while managing risk. Although it has certain lag and frequent trading issues, the strategy's performance can be further improved through methods such as optimizing stop-loss and take-profit levels, introducing signal filtering, adaptive parameter optimization, and position management, making it a practical quantitative trading strategy.
[/trans]
Strategy Arguments
| Argument | Default | Description |
|---|---|---|
| v_input_1 | 14 | Length MA1 |
| v_input_2_close | 0 | Source MA1: close |
| v_input_3 | 50 | Length MA2 |
| v_input_4_close | 0 | Source MA2: close |
| v_input_5 | 14 | ATR Length |
| v_input_6 | 1.5 | ATR Multiplier |
| v_input_7 | true | Hiển thị giao dịch |
Source (PineScript)
/*backtest
start: 2024-03-01 00:00:00
end: 2024-03-31 23:59:59
period: 4h
basePeriod: 15m
exchanges: [{"eid":"Futures_Binance","currency":"BTC_USDT"}]
*/

//@version=4
strategy(title="2 Moving Averages", shorttitle="2MA", overlay=true)

// Moving Averages
len = input(14, minval=1, title="Length MA1")
src = input(close, title="Source MA1")
ma1 = sma(src, len)

len2 = input(50, minval=1, title="Length MA2")
src2 = input(close, title="Source MA2")
ma2 = sma(src2, len2)

// Plotting Moving Averages
plot(ma1, color=#0b6ce5, title="MA1")
plot(ma2, color=#00ff80, linewidth=2, title="MA2")

// ATR Bands
atrLength = input(14, title="ATR Length")
atrMultiplier = input(1.5, title="ATR Multiplier")
upperBand = high + atr(atrLength) * atrMultiplier
lowerBand = low - atr(atrLength) * atrMultiplier

u =plot(upperBand, color=color.rgb(217, 220, 223, 84), title="ATR Upper Band")
l = plot(lowerBand, color=color.rgb(217, 220, 223, 84), title="ATR Lower Band")
fill(u, l, color=#471eb821, title="ATR Background")

// Conditions for plotting arrows
upArrowCondition = ma1 > ma2 and crossover(close, ma1)
downArrowCondition = ma1 < ma2 and crossunder(close, ma1)

// Plotting arrows
plotshape(upArrowCondition, style=shape.arrowup, color=color.rgb(66, 45, 255), size=size.normal, location=location.belowbar, title="Up Arrow")
plotshape(downArrowCondition, style=shape.arrowdown, color=color.red, size=size.normal, location=location.abovebar, title="Down Arrow")
// Checkbox for trade execution
showTrades = input(true, title="Hiển thị giao dịch")

// Buy Condition
if (upArrowCondition and showTrades)
    strategy.entry("Buy", strategy.long)

// Sell Condition
if (downArrowCondition and showTrades)
    strategy.entry("Sell", strategy.short)

// Stop Loss and Take Profit
stopLossBuy = low - atr(14) * atrMultiplier
takeProfitBuy = close + (close - stopLossBuy) * 2

stopLossSell = high + atr(14) * atrMultiplier
takeProfitSell = close - (stopLossSell - close) * 2

strategy.exit("Exit Buy", "Buy", stop=stopLossBuy, limit=takeProfitBuy)
strategy.exit("Exit Sell", "Sell", stop=stopLossSell, limit=takeProfitSell)
Detail
https://www.fmz.com/strategy/446764
Last Modified
2024-04-01 11:58:55