
8.8 KiB
Name
双均线止盈止损趋势交易策略-Dual-Moving-Average-Trend-Trading-Strategy-with-Stop-Loss-and-Take-Profit
Author
ianzeng123
Strategy Description
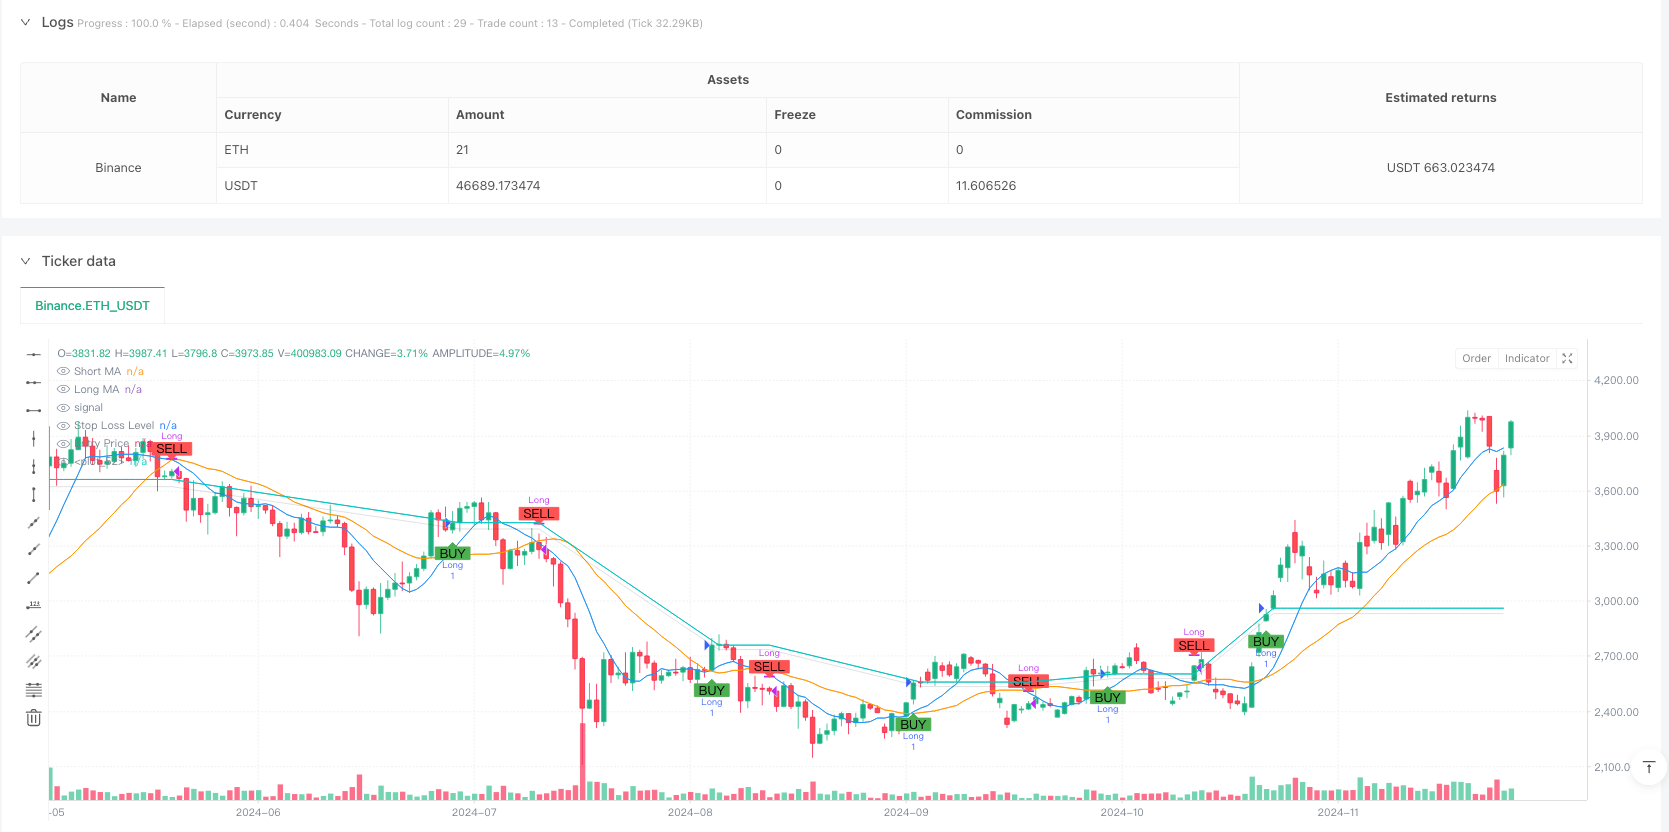
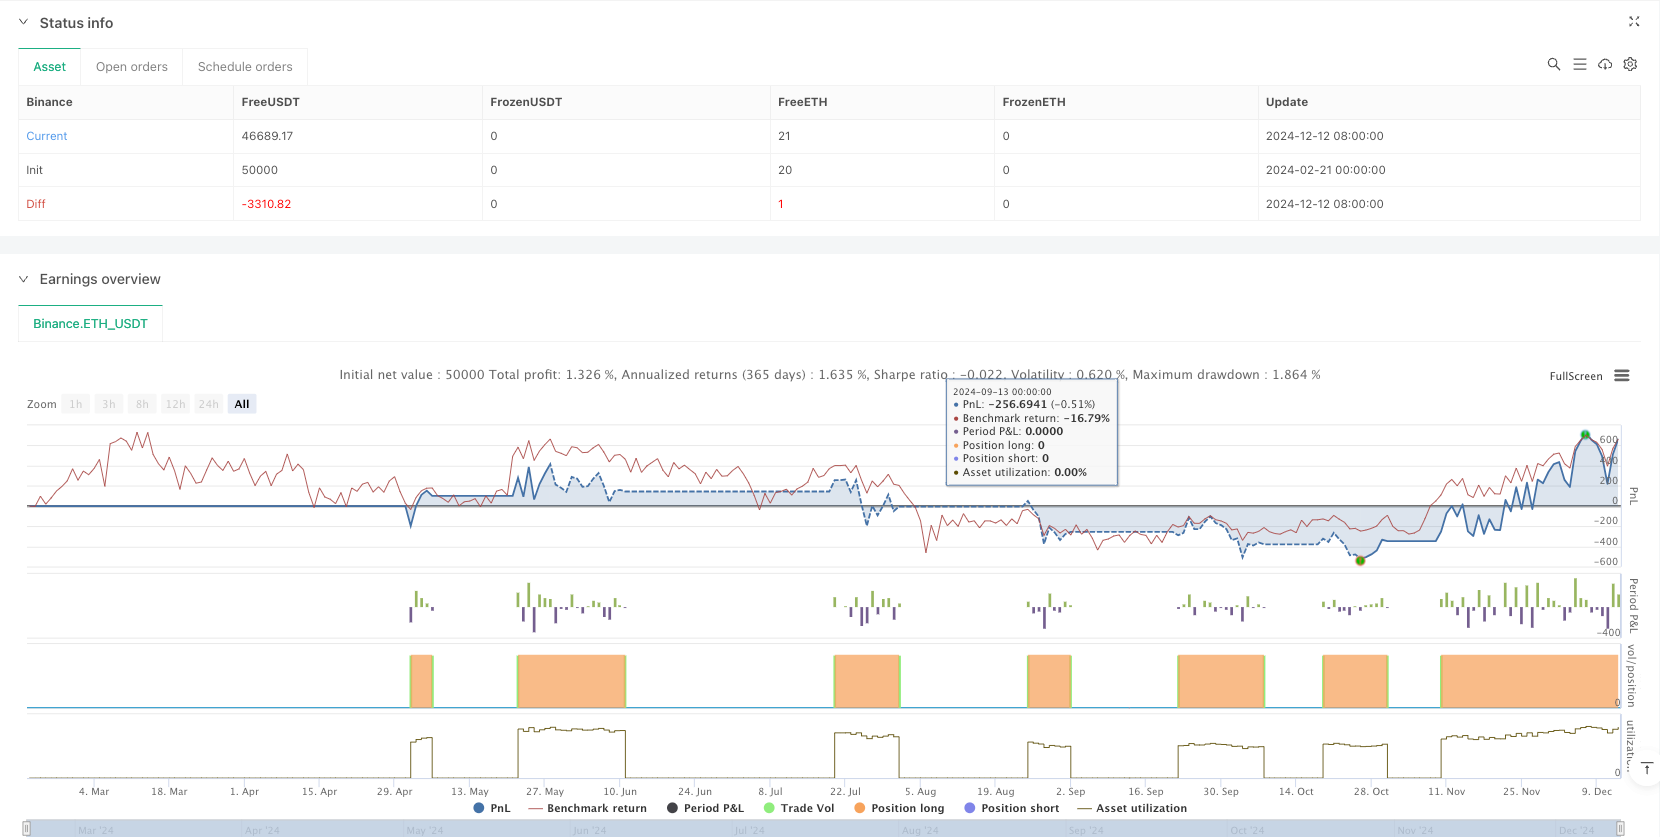
[trans]
概述
本策略是一个基于双均线交叉的趋势跟踪交易系统,结合了风险管理机制。策略使用9周期和21周期的简单移动平均线(SMA)来捕捉市场趋势,同时设置了1%的止损和止盈来控制风险。系统在短期均线上穿长期均线时进场做多,在短期均线下穿长期均线时平仓出场。
策略原理
策略的核心逻辑基于市场趋势的连续性特征。通过观察短期(9周期)和长期(21周期)移动平均线的交叉来判断趋势的转换点。当短期均线上穿长期均线时形成"金叉",表明上升趋势开始,系统发出做多信号;当短期均线下穿长期均线时形成"死叉",表明上升趋势可能结束,系统平仓出场。同时,策略引入了1%的止损和止盈机制,以便在市场出现不利走势时及时止损,或在获得预期收益时锁定利润。
策略优势
- 趋势把握能力强:通过双均线交叉捕捉趋势转换点,能够较好地把握市场主要趋势。
- 风险控制完善:设置了固定比例的止损和止盈,有效控制单笔交易的风险。
- 自动化程度高:系统完全自动化运行,无需人工干预。
- 可视化效果好:通过图形界面清晰展示交易信号和风险控制区间。
- 参数优化灵活:均线周期和止损止盈比例可根据不同市场特征进行调整。
策略风险
- 震荡市场风险:在横盘震荡市场中,频繁的均线交叉可能导致虚假信号。
- 滑点风险:在市场波动剧烈时,实际成交价格可能与信号价格产生较大偏差。
- 趋势反转风险:强趋势突然反转时,固定止损可能不足以应对大幅波动。
- 参数依赖性:策略表现对均线周期和止损止盈参数设置较为敏感。
策略优化方向
- 引入趋势过滤器:可添加ADX等趋势强度指标,在趋势明确时才开仓。
- 动态止损机制:可使用ATR或波动率来动态调整止损幅度。
- 增加成交量确认:将成交量作为交易信号的辅助确认指标。
- 优化参数自适应:根据市场波动特征动态调整均线周期。
- 增加趋势强度过滤:可结合RSI等指标判断趋势强度。
总结
该策略通过双均线交叉捕捉趋势,并结合止损止盈机制进行风险控制,是一个较为完整的趋势跟踪交易系统。虽然在震荡市场中可能产生虚假信号,但通过合理的参数优化和增加辅助指标,可以进一步提高策略的稳定性和盈利能力。策略的核心优势在于自动化程度高、风险控制完善,适合作为中长期趋势跟踪的基础策略框架。 ||
Overview
This strategy is a trend-following trading system based on dual moving average crossovers combined with risk management mechanisms. The strategy uses 9-period and 21-period Simple Moving Averages (SMA) to capture market trends, with 1% stop-loss and take-profit levels for risk control. The system enters long positions when the short-term MA crosses above the long-term MA and exits when the short-term MA crosses below the long-term MA.
Strategy Principles
The core logic is based on market trend continuity characteristics. By observing crossovers between short-term (9-period) and long-term (21-period) moving averages, the strategy identifies trend reversal points. A "Golden Cross" occurs when the short-term MA crosses above the long-term MA, signaling an uptrend and generating a long entry signal. A "Death Cross" occurs when the short-term MA crosses below the long-term MA, indicating potential trend reversal and triggering position closure. The strategy incorporates 1% stop-loss and take-profit mechanisms to limit losses during adverse market movements and secure profits at target levels.
Strategy Advantages
- Strong trend capture capability: Effectively identifies trend reversal points through dual MA crossovers.
- Comprehensive risk control: Fixed percentage stop-loss and take-profit levels effectively control per-trade risk.
- High automation level: System runs fully automatically without manual intervention.
- Good visualization: Clear graphical interface displaying trade signals and risk control zones.
- Flexible parameter optimization: MA periods and risk management levels can be adjusted for different market characteristics.
Strategy Risks
- Sideways market risk: Frequent MA crossovers in ranging markets may generate false signals.
- Slippage risk: Actual execution prices may significantly deviate from signal prices during high volatility.
- Trend reversal risk: Fixed stop-loss may be insufficient for sudden strong trend reversals.
- Parameter dependency: Strategy performance is sensitive to MA periods and risk management parameter settings.
Optimization Directions
- Implement trend filters: Add indicators like ADX to trade only in strong trends.
- Dynamic stop-loss mechanism: Use ATR or volatility to adjust stop-loss levels dynamically.
- Volume confirmation: Include volume as a confirmatory indicator for trade signals.
- Adaptive parameter optimization: Dynamically adjust MA periods based on market volatility characteristics.
- Add trend strength filtering: Incorporate RSI or similar indicators to assess trend strength.
Summary
This strategy captures trends through dual MA crossovers while incorporating risk management mechanisms, forming a comprehensive trend-following trading system. While it may generate false signals in ranging markets, the strategy's stability and profitability can be enhanced through proper parameter optimization and additional confirmatory indicators. Its core strengths lie in high automation and robust risk control, making it suitable as a foundation for medium to long-term trend-following strategies.[/trans]
Source (PineScript)
/*backtest
start: 2024-02-21 00:00:00
end: 2024-12-13 00:00:00
period: 1d
basePeriod: 1d
exchanges: [{"eid":"Binance","currency":"ETH_USDT"}]
*/

//@version=6
strategy("Moving Average Crossover with Stop Loss and Take Profit", overlay=true)

// Parameters for moving averages
short_length = input.int(9, title="Short Moving Average Length")  // Optimized for 15-minute time frame
long_length = input.int(21, title="Long Moving Average Length")   // Optimized for 15-minute time frame

// Parameters for risk management
stop_loss_percent = input.float(1.0, title="Stop Loss (%)") / 100  // 1% stop loss
take_profit_percent = input.float(1.0, title="Take Profit (%)") / 100  // 1% take profit

// Calculate moving averages
short_ma = ta.sma(close, short_length)
long_ma = ta.sma(close, long_length)

// Plot moving averages
plot(short_ma, color=color.blue, title="Short MA")
plot(long_ma, color=color.orange, title="Long MA")

// Entry and exit conditions
long_condition = ta.crossover(short_ma, long_ma)  // Golden Cross
short_condition = ta.crossunder(short_ma, long_ma)  // Death Cross

// Execute strategy with stop loss and take profit
if (long_condition)
    strategy.entry("Long", strategy.long)
    strategy.exit("Take Profit/Stop Loss", "Long", stop=strategy.position_avg_price * (1 - stop_loss_percent), limit=strategy.position_avg_price * (1 + take_profit_percent)  )

if (short_condition)
    strategy.close("Long")  // Close long position on Death Cross

// Plot Buy/Sell Signals
plotshape(series=long_condition, title="Buy Signal", location=location.belowbar, color=color.green, style=shape.labelup, text="BUY")
plotshape(series=short_condition, title="Sell Signal", location=location.abovebar, color=color.red, style=shape.labeldown, text="SELL")

// Draw 1% stop loss level as a transparent red rectangle
var float stop_loss_level = na
var float entry_price = na
if (strategy.position_size > 0)  // Only update when in a trade
    stop_loss_level := strategy.position_avg_price * (1 - stop_loss_percent)
    entry_price := strategy.position_avg_price

// Create transparent colors
transparent_red = color.new(color.black, 90)  // 90% transparency
transparent_green = color.new(color.green, 90)  // 90% transparency

// Plot stop loss and entry levels conditionally
plot(strategy.position_size > 0 ? stop_loss_level : na, color=transparent_red, title="Stop Loss Level", linewidth=1)
plot(strategy.position_size > 0 ? entry_price : na, color=transparent_green, title="Entry Price", linewidth=1)

// Fill the area between stop loss and entry price conditionally
fill( plot(strategy.position_size > 0 ? stop_loss_level : na),  plot(strategy.position_size > 0 ? entry_price : na),  color=transparent_red)
Detail
https://www.fmz.com/strategy/482846
Last Modified
2025-02-27 17:36:23