
11 KiB
Name
双均线均值回归策略结合风险控制-Dual-Moving-Average-Mean-Reversion-Strategy-with-Risk-Control
Author
ChaoZhang
Strategy Description
[trans]
概述
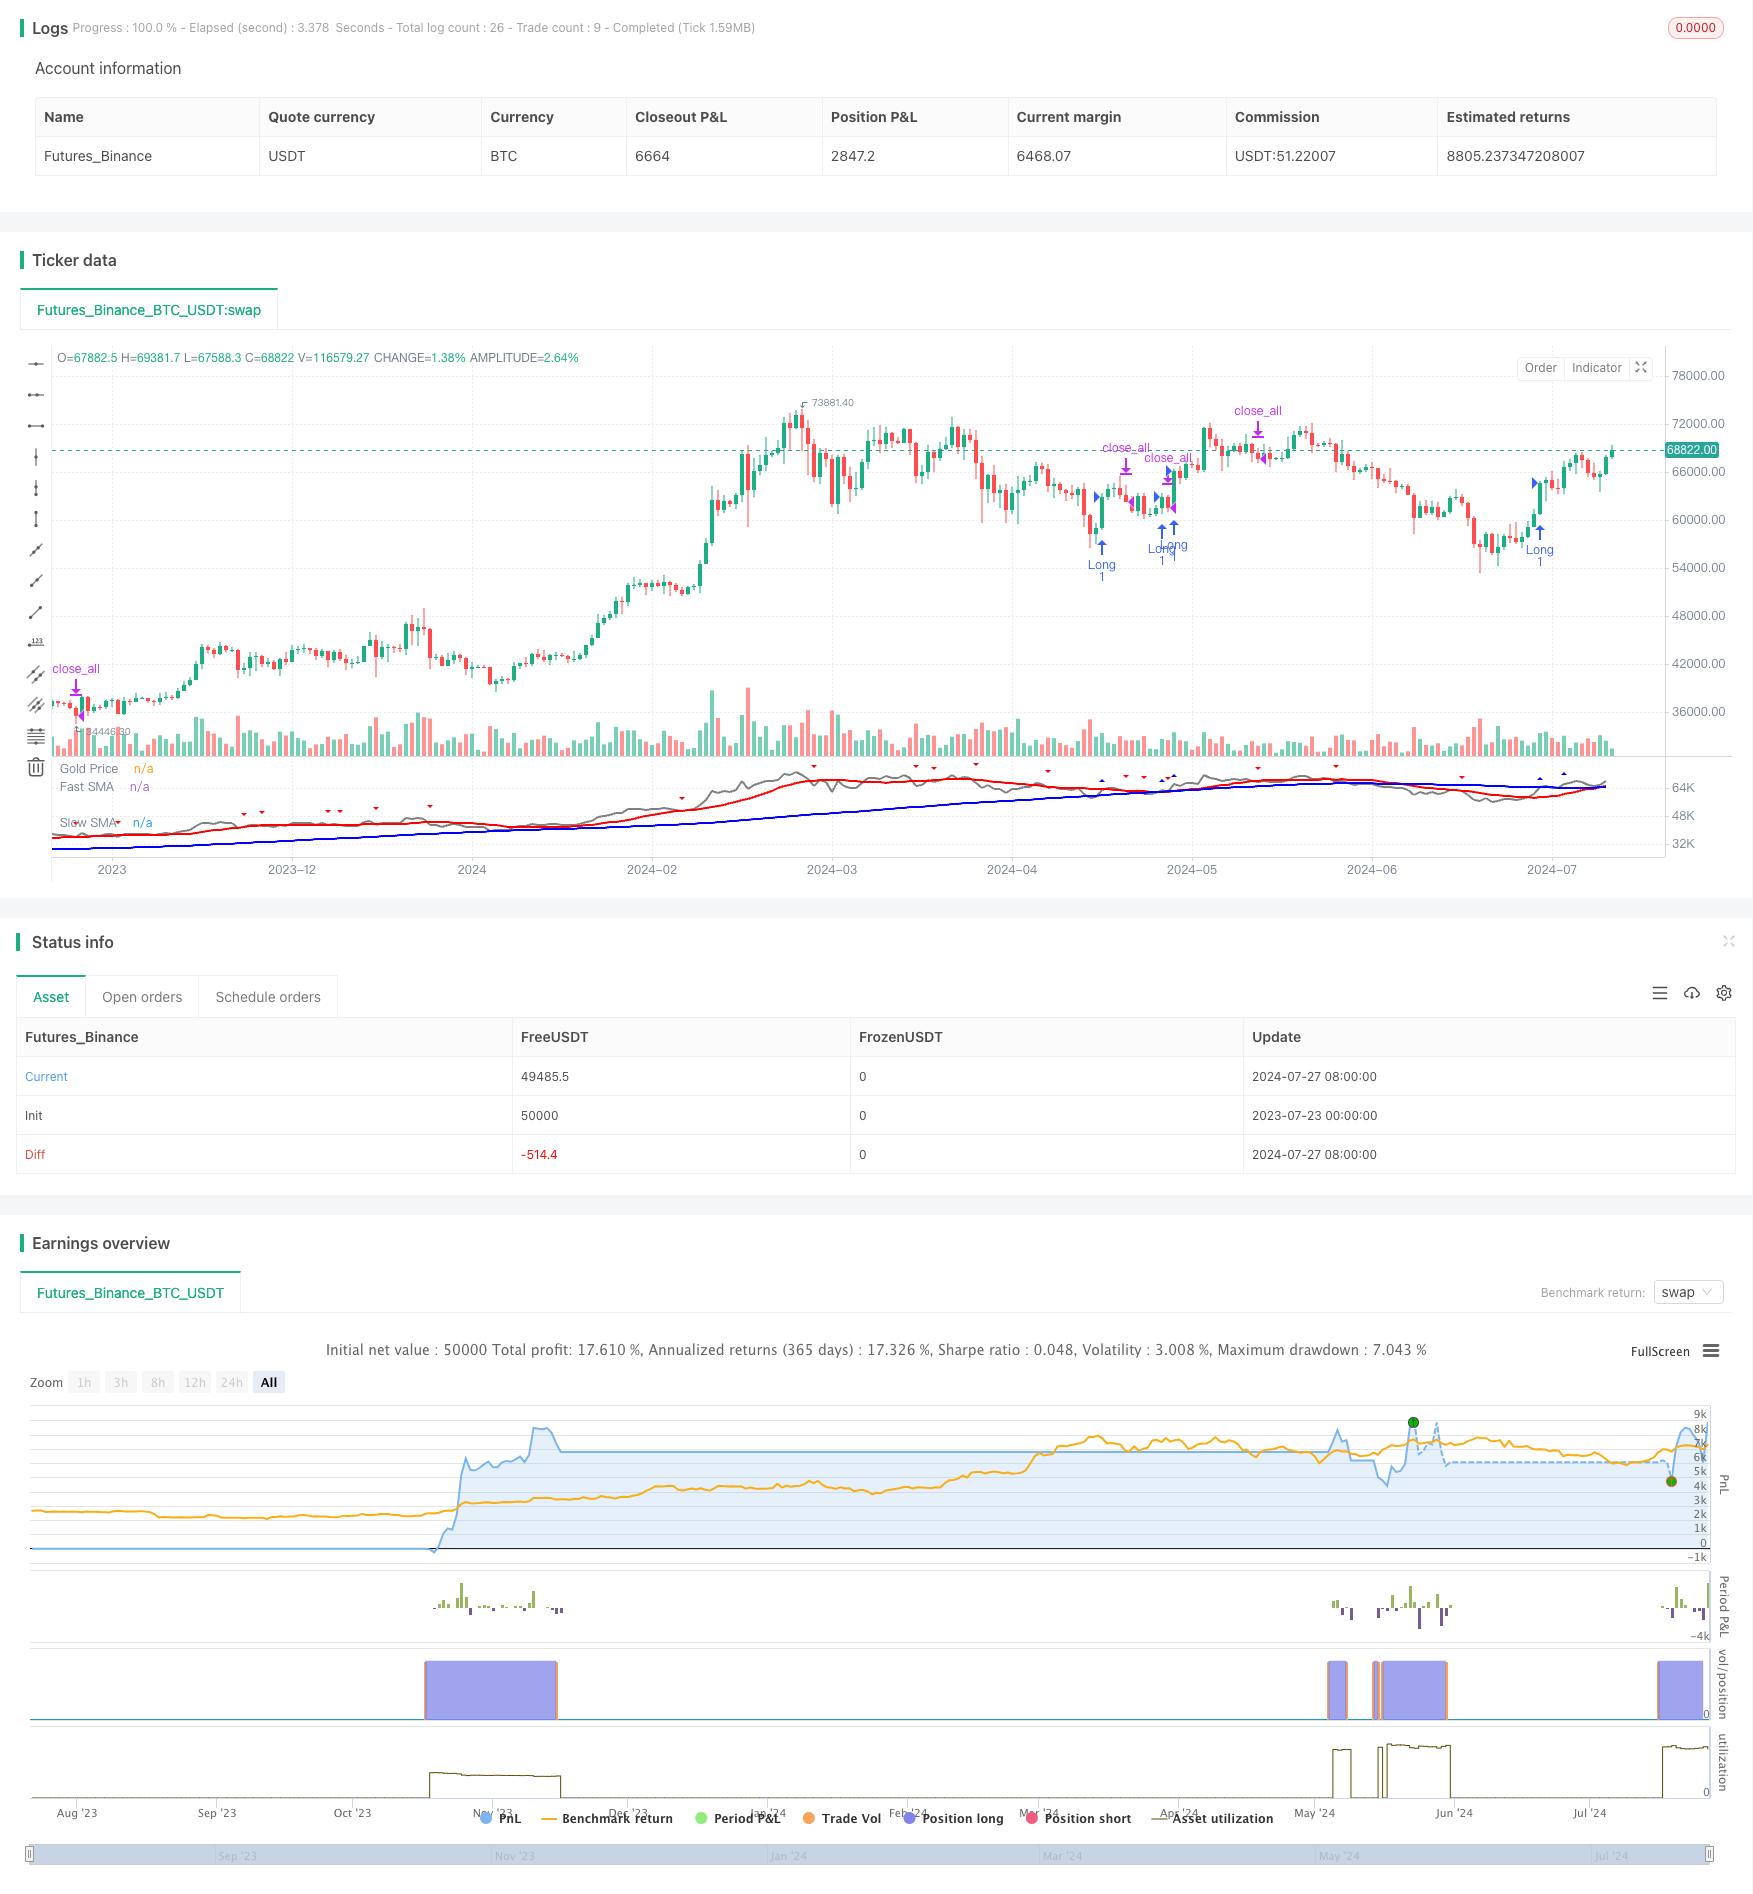
本策略是一个基于双均线交叉和均值回归原理的交易系统,结合了动态风险控制机制。该策略利用快速和慢速简单移动平均线(SMA)的交叉来产生交易信号,同时使用平均真实范围(ATR)指标来设置动态止损,实现对每笔交易风险的精确控制。这种方法旨在捕捉市场趋势,同时在市场反转时及时退出,以平衡收益和风险。
策略原理
-
信号生成:
- 使用两个不同周期的简单移动平均线(SMA):快速SMA(14周期)和慢速SMA(100周期)。
- 当价格上穿慢速SMA时,触发买入信号。
- 当价格下穿快速SMA时,触发卖出信号。
-
风险控制:
- 使用10周期的ATR来计算动态止损水平。
- 止损设置为入场价格减去ATR乘以风险百分比(默认为2%)。
-
交易执行:
- 在买入信号出现时,以市价开仓做多,同时设置动态止损。
- 在卖出信号出现时,平掉所有持仓。
-
可视化:
- 在图表上绘制价格、快速SMA和慢速SMA。
- 使用三角形标记买入和卖出信号。
策略优势
-
趋势跟踪与均值回归的结合:通过使用双均线系统,策略能够在捕捉长期趋势的同时,对短期价格波动做出反应,实现趋势跟踪和均值回归的平衡。
-
动态风险控制:使用基于ATR的动态止损,使得止损水平能够根据市场波动性自动调整,提供了更精确的风险管理。
-
简单而有效:策略逻辑清晰,易于理解和实施,同时又包含了足够的复杂性来应对不同市场环境。
-
可视化支持:通过在图表上直观显示交易信号和移动平均线,帮助交易者更好地理解和评估策略表现。
-
参数可调:允许用户根据个人风险偏好和市场特征调整关键参数,如移动平均线周期和风险百分比。
策略风险
-
假突破风险:在横盘市场中,价格可能频繁穿越均线,导致过多的假信号和不必要的交易。
-
滞后性:由于使用移动平均线,策略在趋势转折点的反应可能会滞后,导致入场或出场时机不够及时。
-
过度交易:在高波动性市场中,可能会产生过多的交易信号,增加交易成本。
-
固定风险百分比的局限性:尽管使用ATR动态调整止损,但固定的风险百分比可能不适用于所有市场条件。
-
缺乏利润目标:策略仅依赖均线交叉来平仓,可能导致在强劲趋势中过早退出,错失更多潜在利润。
策略优化方向
-
引入趋势过滤器:可以添加长期趋势指标(如200日均线)来过滤交易信号,只在主趋势方向上交易,减少假突破。
-
优化入场时机:考虑结合其他技术指标(如RSI或MACD)来确认入场信号,提高交易准确性。
-
动态调整风险参数:可以根据市场波动性或其他市场状态指标动态调整风险百分比,使风险管理更加灵活。
-
添加利润目标:设置基于ATR或固定比例的动态利润目标,在趋势强劲时允许更大的利润空间。
-
实现部分平仓机制:在达到某些盈利水平时执行部分平仓,既可以锁定部分利润,又能让剩余仓位继续获利。
-
优化均线周期:可以通过回测不同的均线周期组合,找到更适合特定市场的参数设置。
-
加入交易量过滤:考虑将成交量指标纳入信号生成过程,以提高信号的可靠性。
总结
双均线均值回归策略结合风险控制是一个兼顾趋势跟踪和风险管理的交易系统。通过利用快速和慢速移动平均线的交叉来捕捉市场动向,结合ATR based的动态止损机制,策略实现了对每笔交易风险的精确控制。这种方法在捕捉市场趋势的同时,也能在市场反转时及时退出,为交易者提供了一个平衡收益和风险的工具。
然而,该策略也存在一些局限性,如假突破风险、信号滞后和可能的过度交易等。通过引入趋势过滤器、优化入场时机、动态调整风险参数等方式,策略还有很大的优化空间。未来的改进可以集中在提高信号质量、优化风险管理和增加利润管理机制等方面。
总的来说,这个策略为量化交易提供了一个坚实的基础框架,具有良好的可扩展性和适应性。通过持续的优化和调整,它有潜力成为一个强大而可靠的交易系统,适用于不同的市场环境和交易品种。
||
Overview
This strategy is a trading system based on dual moving average crossovers and mean reversion principles, combined with a dynamic risk control mechanism. The strategy utilizes the crossover of fast and slow Simple Moving Averages (SMA) to generate trading signals, while using the Average True Range (ATR) indicator to set dynamic stop-losses, enabling precise control of risk for each trade. This approach aims to capture market trends while exiting timely during market reversals, balancing profitability and risk.
Strategy Principles
-
Signal Generation:
- Uses two Simple Moving Averages (SMA) of different periods: a fast SMA (14 periods) and a slow SMA (100 periods).
- A buy signal is triggered when the price crosses above the slow SMA.
- A sell signal is triggered when the price crosses below the fast SMA.
-
Risk Control:
- Uses a 10-period ATR to calculate dynamic stop-loss levels.
- Stop-loss is set at the entry price minus the ATR multiplied by the risk percentage (default 2%).
-
Trade Execution:
- Opens a long position at market price when a buy signal occurs, setting a dynamic stop-loss.
- Closes all positions when a sell signal occurs.
-
Visualization:
- Plots the price, fast SMA, and slow SMA on the chart.
- Uses triangle markers to indicate buy and sell signals.
Strategy Advantages
-
Combination of Trend Following and Mean Reversion: By using a dual moving average system, the strategy can capture long-term trends while responding to short-term price fluctuations, balancing trend following and mean reversion.
-
Dynamic Risk Control: The use of ATR-based dynamic stop-losses allows the stop level to automatically adjust according to market volatility, providing more precise risk management.
-
Simple yet Effective: The strategy logic is clear, easy to understand and implement, while containing sufficient complexity to handle different market environments.
-
Visual Support: By intuitively displaying trading signals and moving averages on the chart, it helps traders better understand and evaluate strategy performance.
-
Adjustable Parameters: Allows users to adjust key parameters such as moving average periods and risk percentage based on personal risk preferences and market characteristics.
Strategy Risks
-
False Breakout Risk: In sideways markets, price may frequently cross the moving averages, leading to excessive false signals and unnecessary trades.
-
Lag: Due to the use of moving averages, the strategy may react slowly at trend turning points, resulting in untimely entries or exits.
-
Overtrading: In highly volatile markets, too many trading signals may be generated, increasing transaction costs.
-
Limitations of Fixed Risk Percentage: Although ATR is used to dynamically adjust stop-losses, a fixed risk percentage may not be suitable for all market conditions.
-
Lack of Profit Targets: The strategy relies solely on moving average crossovers for closing positions, which may lead to premature exits in strong trends, missing out on more potential profits.
Strategy Optimization Directions
-
Introduce Trend Filters: Add long-term trend indicators (such as 200-day moving average) to filter trading signals, trading only in the direction of the main trend to reduce false breakouts.
-
Optimize Entry Timing: Consider combining other technical indicators (such as RSI or MACD) to confirm entry signals, improving trading accuracy.
-
Dynamically Adjust Risk Parameters: Adjust the risk percentage dynamically based on market volatility or other market state indicators, making risk management more flexible.
-
Add Profit Targets: Set dynamic profit targets based on ATR or fixed ratios, allowing for larger profit margins when trends are strong.
-
Implement Partial Position Closing: Execute partial position closures when certain profit levels are reached, both locking in partial profits and allowing remaining positions to continue profiting.
-
Optimize Moving Average Periods: Backtest different combinations of moving average periods to find parameter settings more suitable for specific markets.
-
Add Volume Filters: Consider incorporating volume indicators into the signal generation process to improve signal reliability.
Conclusion
The Dual Moving Average Mean Reversion Strategy with Risk Control is a trading system that balances trend following and risk management. By utilizing the crossover of fast and slow moving averages to capture market directions, combined with an ATR-based dynamic stop-loss mechanism, the strategy achieves precise risk control for each trade. This method captures market trends while exiting timely during market reversals, providing traders with a tool that balances profitability and risk.
However, the strategy also has some limitations, such as false breakout risks, signal lag, and potential overtrading. There is significant room for optimization through introducing trend filters, optimizing entry timing, dynamically adjusting risk parameters, and other methods. Future improvements can focus on enhancing signal quality, optimizing risk management, and adding profit management mechanisms.
Overall, this strategy provides a solid foundation framework for quantitative trading, with good scalability and adaptability. Through continuous optimization and adjustment, it has the potential to become a powerful and reliable trading system suitable for different market environments and trading instruments.
[/trans]
Source (PineScript)
/*backtest
start: 2023-07-23 00:00:00
end: 2024-07-28 00:00:00
period: 1d
basePeriod: 1h
exchanges: [{"eid":"Futures_Binance","currency":"BTC_USDT"}]
*/

//@version=5
strategy('TAMMY V2')

// Define the parameters
fast_len = input.int(14, minval=1, title='Fast SMA Length')
slow_len = input.int(100, minval=1, title='Slow SMA Length')
risk_per_trade = input.float(2.0, minval=0.1, maxval=10.0, step=0.1, title='Risk Per Trade (%)')

// Calculate the moving averages
fast_sma = ta.sma(close, fast_len)
slow_sma = ta.sma(close, slow_len)

// Generate the trading signals
buy_signal = ta.crossover(close, slow_sma)
sell_signal = ta.crossunder(close, fast_sma)

// Calculate the stop loss level
atr = ta.sma(ta.tr, 10)
sl = close - atr * (risk_per_trade / 100)

// Execute the trades
if buy_signal
    strategy.entry('Long', strategy.long, stop=sl)
if sell_signal
    strategy.close_all()

// Plot the signals and price
plot(close, color=color.new(#808080, 0), linewidth=2, title='Gold Price')
plot(fast_sma, color=color.new(#FF0000, 0), linewidth=2, title='Fast SMA')
plot(slow_sma, color=color.new(#0000FF, 0), linewidth=2, title='Slow SMA')
plotshape(buy_signal, style=shape.triangleup, color=color.new(#0000FF, 0), size=size.small, title='Buy Signal')
plotshape(sell_signal, style=shape.triangledown, color=color.new(#FF0000, 0), size=size.small, title='Sell Signal')
Detail
https://www.fmz.com/strategy/458065
Last Modified
2024-07-29 16:47:54