
19 KiB
Name
双均线回调反转交易策略基于EMA穿越与回测容差的趋势跟踪系统-Dual-EMA-Retest-Reversal-Strategy-A-Trend-Following-System-Based-on-EMA-Crossovers-and-Retest-Tolerance
Author
ianzeng123
Strategy Description
[trans]
概述
双均线回调反转交易策略是一种基于指数移动平均线(EMA)的趋势跟踪系统,其核心理念是"不追逐每一次均线交叉,而是等待市场回调至快速EMA线进行确认后再入场"。该策略结合了技术分析中的均线交叉信号和价格回调确认机制,通过设定合理的回测容差、风险回报比和每日交易次数限制,在趋势转变后的回调点位进行高概率交易。策略使用200周期和800周期的EMA作为基准,当快速EMA(200周期)上穿慢速EMA(800周期)形成多头信号后,等待价格回调至快速EMA附近(默认容差0.2%)时买入;反之形成空头信号后等待回调做空。同时,每笔交易都设置了基于百分比的止损和止盈水平,风险回报比默认为4:1,确保资金管理的合理性。
策略原理
该策略的核心原理建立在以下几个技术分析概念之上:
-
均线交叉信号识别:策略使用200周期和800周期的EMA来确定市场的总体趋势方向。当快速EMA(200)上穿慢速EMA(800)时,系统识别为多头趋势开始;当快速EMA下穿慢速EMA时,系统识别为空头趋势开始。这一阶段仅确定趋势,不触发交易。
-
趋势状态追踪:策略通过布尔变量(in_bullish_trend和in_bearish_trend)持续追踪当前趋势状态,确保只在已确认的趋势方向上进行交易。
-
回调确认机制:与传统均线交叉策略不同,本策略不在交叉点直接入场,而是等待价格回调至快速EMA附近。具体来说,当价格与快速EMA之间的偏差百分比小于预设的回测容差(默认0.2%)时,系统认为回调确认完成,此时才触发交易信号。
-
风险控制机制:策略为每笔交易设置固定比例的止损(默认0.5%)和基于风险回报比(默认4:1)的止盈水平。同时,通过限制每日最大交易次数(默认2次)来避免过度交易。
-
日期切换重置:策略在每日交易开始时重置交易计数器,确保交易频率限制按日计算。
策略优势
通过深入分析代码,该策略具有以下显著优势:
-
趋势确认后交易:策略只在均线交叉确认趋势方向后才考虑入场,避免了在盘整市场中频繁交易带来的亏损。
-
回调入场提高胜率:通过等待价格回调至关键支撑/阻力位(快速EMA)再入场,提高了交易的成功概率,避免了在价格过度延伸时入场带来的风险。
-
明确的风险管理:每笔交易都有预定义的止损和止盈水平,风险回报比设定为4:1,保证了长期盈利的可能性即使胜率不高。
-
过度交易保护:通过每日最大交易次数限制,防止在波动市场中过度交易,这有助于降低交易成本并提高整体策略稳定性。
-
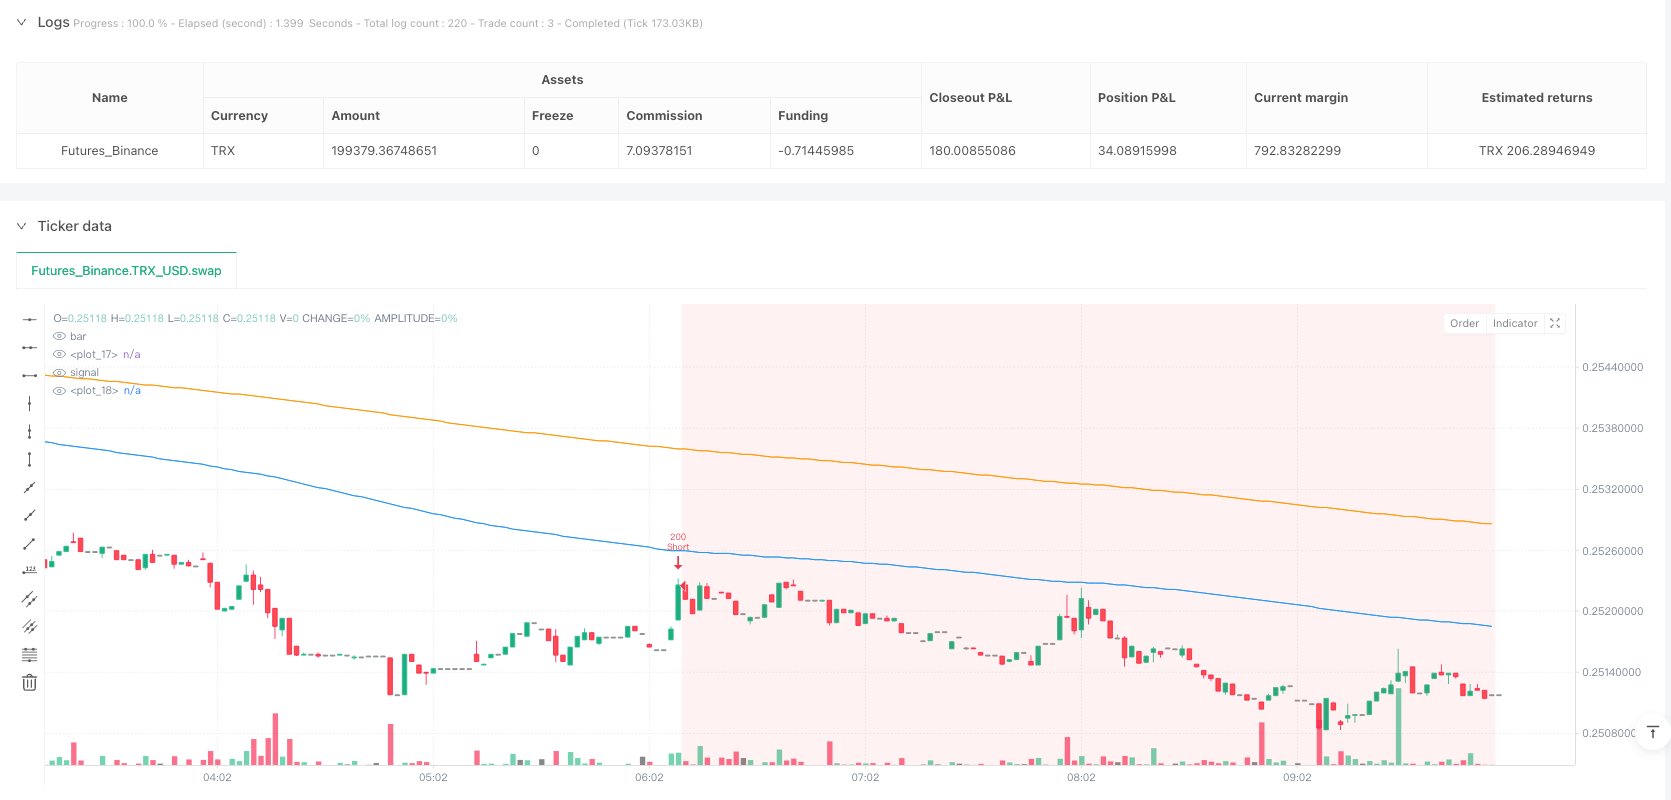
可视化交易信号:策略使用标签和背景颜色变化直观地显示交易信号和持仓状态,便于回测分析和实时监控。
-
参数可调整性:所有关键参数如EMA周期、回测容差、风险回报比、止损比例和每日最大交易次数都是可以通过输入框调整的,使策略具有很强的适应性。
策略风险
尽管该策略设计合理,但仍存在以下潜在风险:
-
趋势反转滞后识别:由于使用较长周期的EMA(200和800),策略在识别趋势反转时可能存在显著滞后,导致错过趋势初期的部分行情。解决方法:可以考虑结合更短周期的指标辅助判断,或者根据市场特性调整EMA周期。
-
假突破风险:在震荡市场中,EMA交叉可能频繁出现假突破,导致错误信号。解决方法:可以增加交叉确认机制,如要求价格在交叉后保持一定时间的趋势方向,或增加交易量确认。
-
窄幅波动下的频繁触发:在低波动率环境下,价格可能频繁在EMA附近波动,满足回测条件后又迅速离开,形成无效信号。解决方法:考虑增加波动率过滤器,或在低波动环境下增加回测容差要求。
-
固定止损风险:策略使用固定百分比止损,未考虑市场波动性差异,可能导致在高波动市场中止损过小而频繁触发。解决方法:可以考虑使用ATR(平均真实波幅)动态调整止损水平。
-
单一技术指标依赖:策略主要依赖EMA指标,缺乏多维度的市场分析。解决方法:考虑结合其他类型的指标(如动量指标、波动率指标)进行信号确认。
策略优化方向
基于上述分析,策略可在以下方向进行优化:
-
动态参数调整:将固定的回测容差和止损比例改为基于市场波动率(如ATR)动态调整,以适应不同市场环境。这样做的原因是市场波动特性会随时间变化,固定参数可能不适用于所有市场条件。
-
多时间框架分析:增加对更高时间框架趋势的判断,只在整体趋势方向上交易,避免在盘整大趋势中做反向交易。这种优化能提高信号质量,减少逆势交易的风险。
-
交易量确认:在入场信号生成时增加交易量确认条件,如要求在回调点位出现放量支撑/阻力突破。交易量是价格变动的动力来源,结合交易量分析可以提高信号有效性。
-
盈亏比动态调整:根据市场波动特性和历史价格结构动态调整风险回报比,而不是使用固定的4:1比例。这可以让策略更好地适应市场的不同阶段和特性。
-
增加过滤条件:加入市场趋势强度指标(如ADX)作为过滤器,只在强趋势市场中开启策略。这样可以避免在弱趋势或震荡市场中产生过多虚假信号。
-
部分利润锁定机制:增加分批止盈功能,当价格达到一定盈利水平时锁定部分利润,剩余部分继续持有以追踪趋势。这种机制可以平衡短期获利和长期趋势追踪的需求。
-
回测时间段优化:添加交易时段过滤,避开市场开盘和收盘前的高波动时段,或者专注于特定的高效交易时段。不同时段市场效率和特性差异很大,选择最适合策略逻辑的时段交易可以提高整体表现。
总结
双均线回调反转交易策略通过结合均线交叉信号和价格回调确认机制,创建了一个完整的趋势跟踪交易系统。该策略不仅包含清晰的入场、出场逻辑,还具备良好的资金管理和风险控制机制。其核心优势在于"等待确认"的理念,通过避免直接追逐均线交叉信号,而是等待价格回调至关键技术位置后再入场,从而提高交易的成功概率。
然而,策略仍存在对长周期EMA的依赖、单一技术指标判断、固定参数设置等局限性。通过引入动态参数调整、多时间框架分析、交易量确认和趋势强度过滤等优化措施,可以进一步提高策略的适应性和稳健性。特别是在高波动或趋势不明确的市场环境中,这些优化措施将发挥更大作用。
最终,该策略代表了一种平衡进取与稳健的交易思路,适合具有一定风险承受能力且追求中长期稳定收益的交易者。通过合理设置参数和持续的策略优化,它可以在各种市场环境中保持相对稳定的表现。 ||
Overview
The Dual EMA Retest Reversal Strategy is a trend following system based on Exponential Moving Averages (EMA), with the core philosophy of "not chasing every EMA cross, but waiting for the market to retest the fast EMA for confirmation before entering." This strategy combines technical analysis concepts of EMA crossovers with price retest confirmation mechanisms. By setting reasonable retest tolerances, risk-reward ratios, and daily trade limits, it executes high-probability trades at retracement points after trend changes. The strategy uses 200-period and 800-period EMAs as benchmarks. When the fast EMA (200-period) crosses above the slow EMA (800-period) forming a bullish signal, it waits for price to pull back to near the fast EMA (default tolerance 0.2%) before buying; conversely, it waits for pullbacks to short after bearish signals. Each trade is equipped with percentage-based stop-loss and take-profit levels, with a default risk-reward ratio of 4:1, ensuring sound money management.
Strategy Principles
The core principles of this strategy are built upon several technical analysis concepts:
-
EMA Crossover Signal Identification: The strategy uses 200-period and 800-period EMAs to determine the overall market trend direction. When the fast EMA (200) crosses above the slow EMA (800), the system identifies this as the beginning of a bullish trend; when the fast EMA crosses below the slow EMA, the system identifies this as the beginning of a bearish trend. This stage only determines the trend and does not trigger trades.
-
Trend State Tracking: The strategy continuously tracks the current trend state through boolean variables (in_bullish_trend and in_bearish_trend), ensuring trades are only executed in the confirmed trend direction.
-
Retest Confirmation Mechanism: Unlike traditional EMA crossover strategies, this strategy does not enter directly at the crossover point but waits for the price to pull back to near the fast EMA. Specifically, when the percentage deviation between price and fast EMA is less than the preset retest tolerance (default 0.2%), the system considers the retest confirmation complete and triggers a trading signal.
-
Risk Control Mechanism: The strategy sets a fixed percentage stop-loss (default 0.5%) and a risk-reward ratio-based take-profit level (default 4:1) for each trade. At the same time, it limits the maximum number of trades per day (default 2) to avoid overtrading.
-
Daily Reset: The strategy resets the trade counter at the beginning of each trading day, ensuring the trade frequency limit is calculated on a daily basis.
Strategy Advantages
Through in-depth code analysis, this strategy has the following significant advantages:
-
Trading After Trend Confirmation: The strategy only considers entry after EMA crossovers confirm the trend direction, avoiding losses from frequent trading in consolidating markets.
-
Retest Entry Improves Win Rate: By waiting for price to pull back to key support/resistance levels (fast EMA) before entering, it improves the probability of successful trades and avoids the risk of entering when price is overextended.
-
Clear Risk Management: Each trade has predefined stop-loss and take-profit levels with a risk-reward ratio set at 4:1, ensuring the possibility of long-term profitability even with a moderate win rate.
-
Overtrading Protection: Through daily maximum trade limits, it prevents excessive trading in volatile markets, which helps reduce trading costs and enhance overall strategy stability.
-
Visualization of Trading Signals: The strategy uses labels and background color changes to intuitively display trading signals and position status, facilitating backtest analysis and real-time monitoring.
-
Parameter Adjustability: All key parameters such as EMA periods, retest tolerance, risk-reward ratio, stop-loss percentage, and maximum daily trades are adjustable through input fields, giving the strategy strong adaptability.
Strategy Risks
Despite its reasonable design, the strategy still has the following potential risks:
-
Delayed Trend Reversal Recognition: Due to the use of longer-period EMAs (200 and 800), the strategy may experience significant lag in identifying trend reversals, causing missed opportunities in the early stages of trends. Solution: Consider incorporating shorter-period indicators for auxiliary judgment, or adjust EMA periods according to market characteristics.
-
False Breakout Risk: In oscillating markets, EMA crossovers may frequently produce false breakouts, leading to erroneous signals. Solution: Add crossover confirmation mechanisms, such as requiring price to maintain a certain trend direction after crossing, or add volume confirmation.
-
Frequent Triggers in Narrow Range Fluctuations: In low-volatility environments, price may frequently fluctuate near the EMA, meeting retest conditions but quickly departing, forming invalid signals. Solution: Consider adding volatility filters, or increase retest tolerance requirements in low-volatility environments.
-
Fixed Stop-Loss Risk: The strategy uses fixed percentage stop-losses without considering market volatility differences, potentially leading to too-small stops that trigger frequently in high-volatility markets. Solution: Consider using ATR (Average True Range) to dynamically adjust stop-loss levels.
-
Single Technical Indicator Dependency: The strategy primarily relies on EMA indicators, lacking multi-dimensional market analysis. Solution: Consider combining other types of indicators (such as momentum indicators, volatility indicators) for signal confirmation.
Strategy Optimization Directions
Based on the above analysis, the strategy can be optimized in the following directions:
-
Dynamic Parameter Adjustment: Change fixed retest tolerance and stop-loss percentages to be dynamically adjusted based on market volatility (such as ATR) to adapt to different market environments. This is done because market volatility characteristics change over time, and fixed parameters may not be suitable for all market conditions.
-
Multi-Timeframe Analysis: Add assessment of higher timeframe trends, only trading in the direction of the overall trend to avoid counter-trend trading in consolidating major trends. This optimization can improve signal quality and reduce the risk of counter-trend trading.
-
Volume Confirmation: Add volume confirmation conditions when generating entry signals, such as requiring volume support/resistance breakouts at retest points. Volume is the source of price movement dynamics, and incorporating volume analysis can improve signal effectiveness.
-
Dynamic Profit-Loss Ratio Adjustment: Dynamically adjust the risk-reward ratio based on market volatility characteristics and historical price structure, rather than using a fixed 4:1 ratio. This allows the strategy to better adapt to different market phases and characteristics.
-
Add Filtering Conditions: Incorporate market trend strength indicators (such as ADX) as filters, only activating the strategy in strong trend markets. This can avoid generating too many false signals in weak trend or oscillating markets.
-
Partial Profit Locking Mechanism: Add partial profit-taking functionality, locking in some profits when price reaches certain profit levels while continuing to hold the remainder to track the trend. This mechanism can balance short-term profit-taking and long-term trend-following needs.
-
Backtest Time Period Optimization: Add trading session filters to avoid high-volatility periods around market open and close, or focus on specific high-efficiency trading sessions. Different sessions have significant differences in market efficiency and characteristics; selecting the most suitable periods for the strategy logic can improve overall performance.
Summary
The Dual EMA Retest Reversal Strategy creates a complete trend-following trading system by combining EMA crossover signals with price retest confirmation mechanisms. The strategy not only includes clear entry and exit logic but also features sound money management and risk control mechanisms. Its core advantage lies in the "wait for confirmation" philosophy, improving the probability of successful trades by avoiding direct pursuit of EMA crossover signals and instead waiting for price to pull back to key technical levels before entering.
However, the strategy still has limitations such as dependence on long-period EMAs, single technical indicator judgment, and fixed parameter settings. By introducing dynamic parameter adjustments, multi-timeframe analysis, volume confirmation, and trend strength filtering, the strategy's adaptability and robustness can be further enhanced. These optimization measures will be particularly effective in highly volatile or trend-unclear market environments.
Ultimately, this strategy represents a trading approach that balances aggression with stability, suitable for traders with certain risk tolerance who pursue medium to long-term stable returns. Through reasonable parameter settings and continuous strategy optimization, it can maintain relatively stable performance in various market environments. [/trans]
Source (PineScript)
/*backtest
start: 2025-04-13 00:00:00
end: 2025-04-15 10:00:00
period: 2m
basePeriod: 2m
exchanges: [{"eid":"Futures_Binance","currency":"TRX_USD"}]
*/

//@version=6
strategy("200/500 EMA Retest Strategy", overlay=true, default_qty_type=strategy.percent_of_equity, default_qty_value=1)

// INPUTS
ema_fast_length = input.int(200, title="Fast EMA Length")
ema_slow_length = input.int(500, title="Slow EMA Length")
retest_tolerance = input.float(0.002, title="Retest Tolerance (%)") // 0.2% by default
risk_reward_ratio = input.float(4.0, title="Risk-Reward Ratio (TP:SL)")
stop_loss_perc = input.float(0.005, title="Stop Loss % (e.g., 0.5%)") // 0.5% default
max_trades_per_day = input.int(2, title="Max Trades Per Day")

// EMA CALCULATIONS
ema_fast = ta.ema(close, ema_fast_length)
ema_slow = ta.ema(close, ema_slow_length)

// PLOT EMAs
plot(ema_fast, color=color.blue)
plot(ema_slow, color=color.orange)

// CROSS DETECTION
bullish_cross = ta.crossover(ema_fast, ema_slow)
bearish_cross = ta.crossunder(ema_fast, ema_slow)

// STATE TRACKING
var bool in_bullish_trend = false
var bool in_bearish_trend = false
var int trades_today = 0

if ta.change(time("D")) != 0

    trades_today := 0

if bullish_cross
    in_bullish_trend := true
    in_bearish_trend := false

if bearish_cross
    in_bullish_trend := false
    in_bearish_trend := true

// RETEST CONDITION
bullish_retest = in_bullish_trend and (math.abs(close - ema_fast) / ema_fast <= retest_tolerance)
bearish_retest = in_bearish_trend and (math.abs(close - ema_fast) / ema_fast <= retest_tolerance)

// ENTRIES WITH SL/TP AND TRADE LIMIT
if bullish_retest and trades_today < max_trades_per_day
    strategy.entry("Long", strategy.long)
    strategy.exit("Long TP/SL", from_entry="Long", stop=close * (1 - stop_loss_perc), limit=close * (1 + stop_loss_perc * risk_reward_ratio))
    label.new(bar_index, low, "BUY", color=color.green, style=label.style_label_up, textcolor=color.white, size=size.small)
    trades_today += 1

if bearish_retest and trades_today < max_trades_per_day
    strategy.entry("Short", strategy.short)
    strategy.exit("Short TP/SL", from_entry="Short", stop=close * (1 + stop_loss_perc), limit=close * (1 - stop_loss_perc * risk_reward_ratio))
    label.new(bar_index, high, "SELL", color=color.red, style=label.style_label_down, textcolor=color.white, size=size.small)
    trades_today += 1

// BACKGROUND COLOR WHEN IN POSITION
bgcolor(strategy.position_size > 0 ? color.new(color.green, 90) : na)
bgcolor(strategy.position_size < 0 ? color.new(color.red, 90) : na)

// ALERTS
if bullish_retest
    alert("BUY Retest Triggered!", alert.freq_once_per_bar)

if bearish_retest
    alert("SELL Retest Triggered!", alert.freq_once_per_bar)
Detail
https://www.fmz.com/strategy/491506
Last Modified
2025-04-21 15:58:18