
14 KiB
Name
双均线动量交易策略基于时间优化的趋势跟踪系统-Dual-Moving-Average-Momentum-Trading-Strategy-Time-Optimized-Trend-Following-System
Author
ChaoZhang
Strategy Description
[trans]
概述
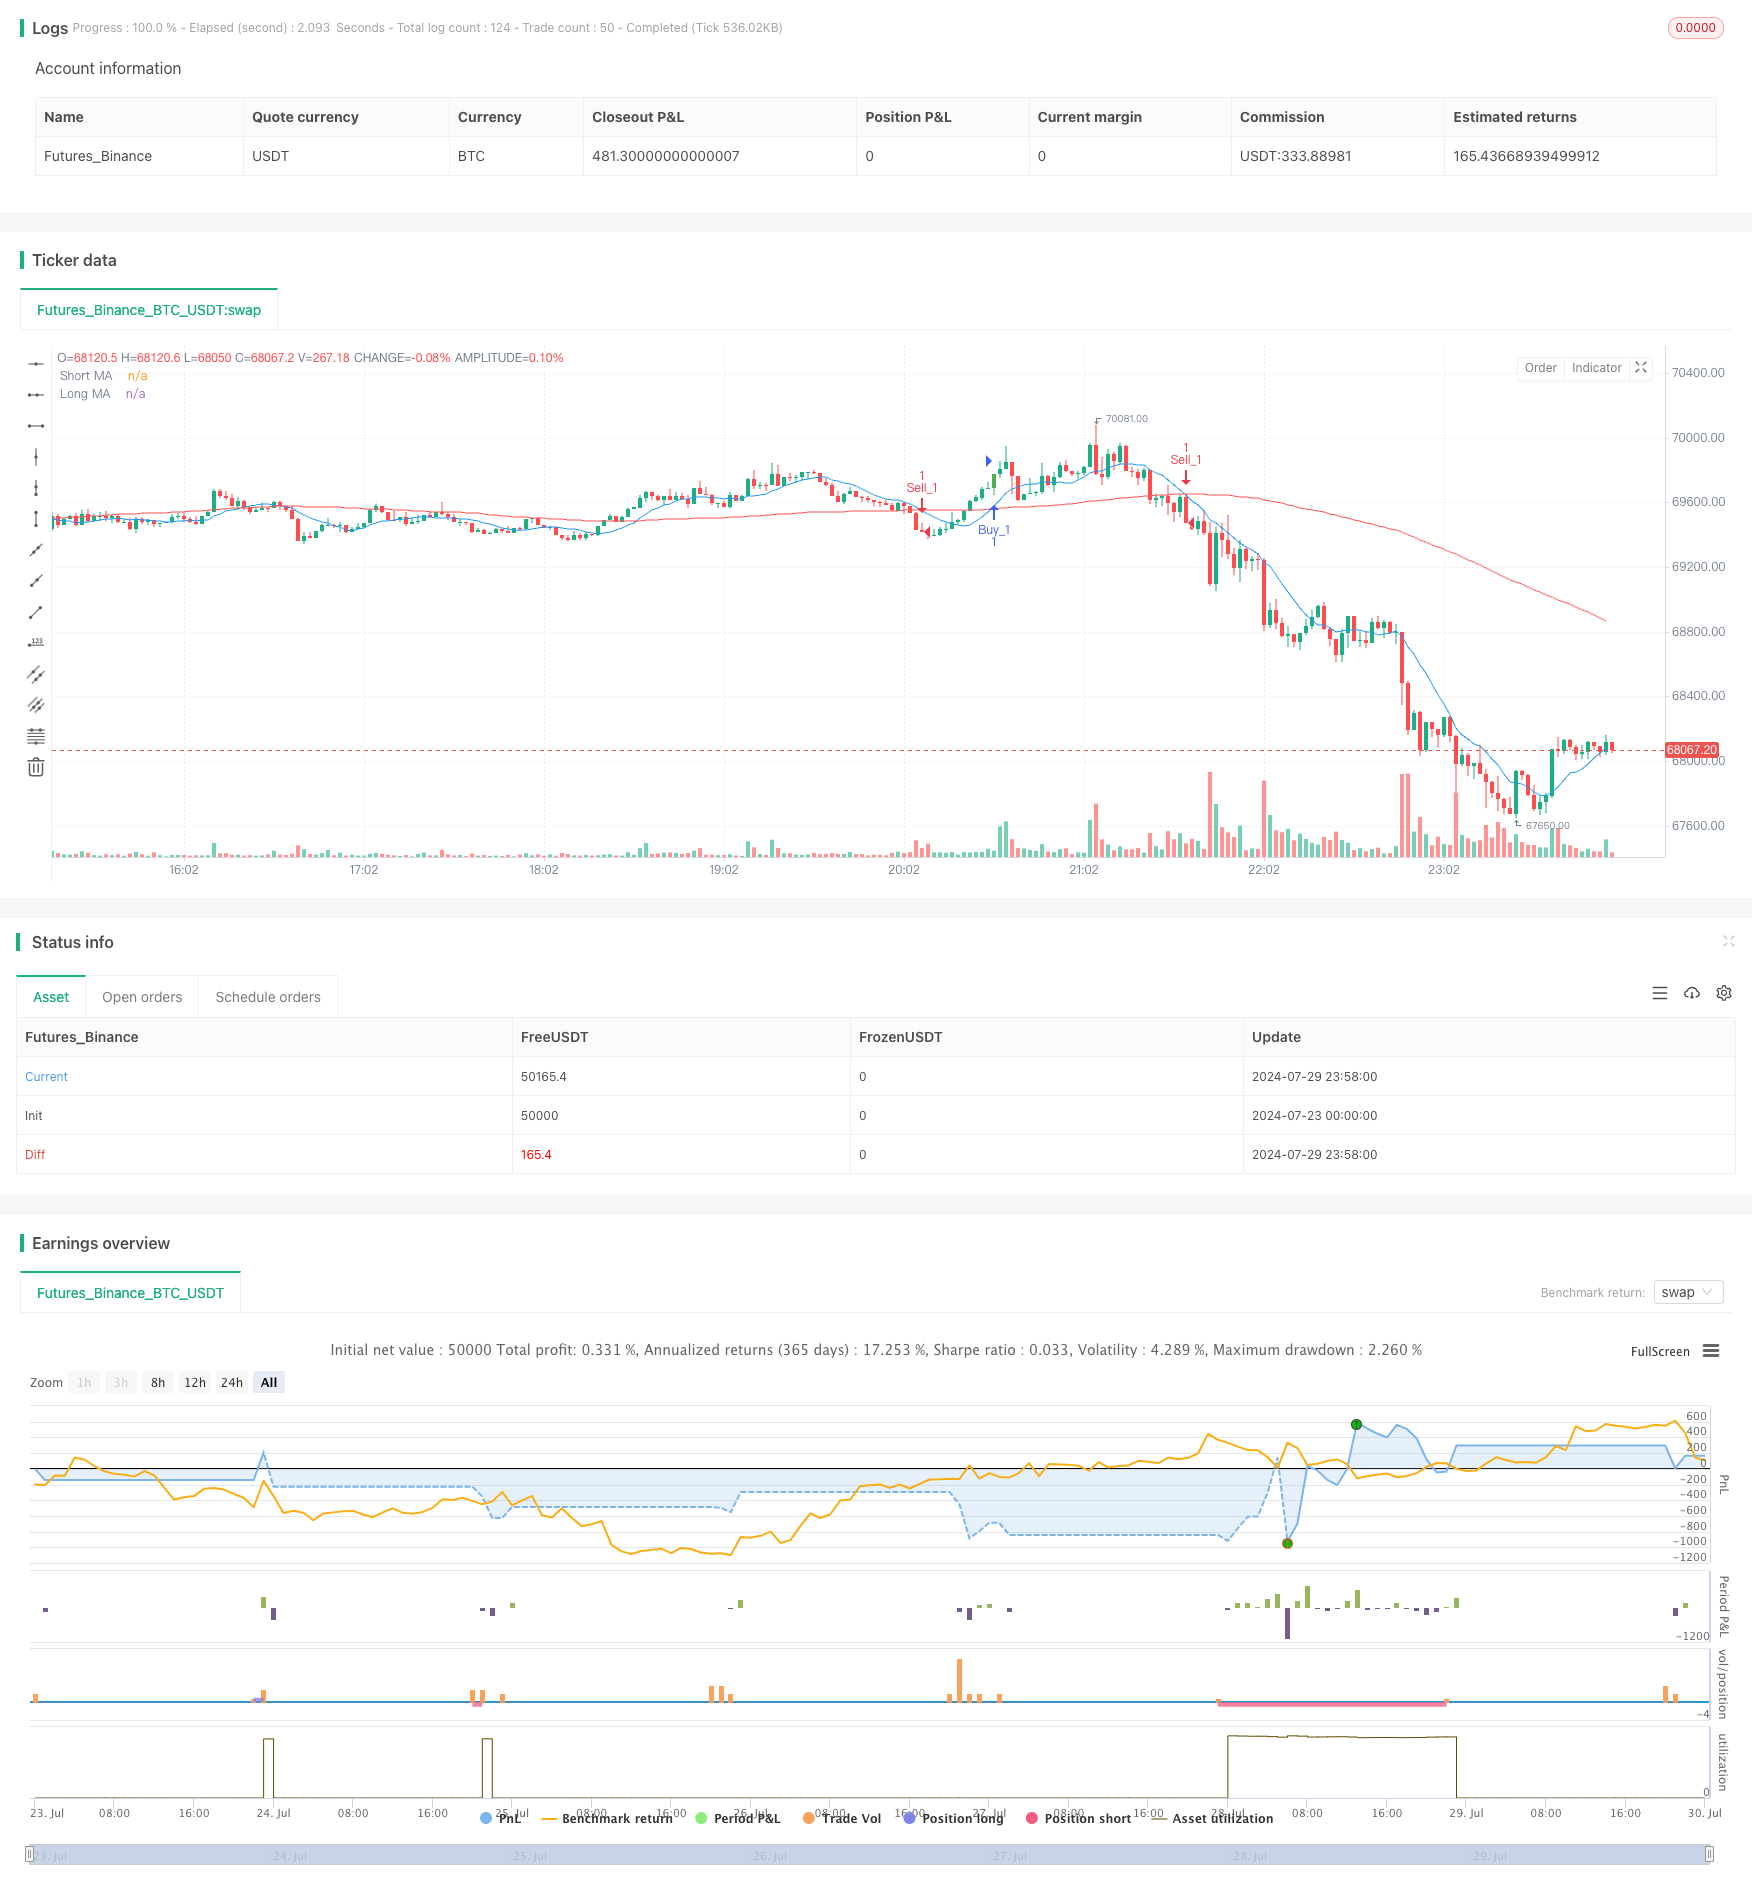
该策略是一个基于双均线交叉和时间优化的趋势跟踪交易系统。它利用短期和长期移动平均线的交叉来生成买入和卖出信号,同时结合了特定的交易时间窗口来优化交易执行。该策略还包括了多个目标价位和止损水平,以管理风险和获利。
策略原理
这个策略的核心原理是利用两条不同周期的移动平均线(MA)来识别市场趋势和产生交易信号。具体来说:
-
短期MA和长期MA:策略使用两个用户自定义的移动平均线周期,分别代表短期和长期市场趋势。
-
交叉信号:当短期MA向上穿过长期MA时,产生买入信号;当短期MA向下穿过长期MA时,产生卖出信号。
-
时间优化:策略引入了交易时间窗口概念,只在用户指定的UTC时间范围内执行交易,这有助于避开市场波动较大或流动性较差的时段。
-
多重目标价位:策略为每个交易设置了两个目标价位(Target_1和Target_2),允许分步获利。
-
风险管理:每个交易都设置了止损点,以限制潜在损失。
-
可视化:策略在图表上标示出买卖信号和价格达到目标位的标签,便于交易者直观理解市场动态。
策略优势
-
趋势跟踪:通过使用移动平均线交叉,策略能够有效捕捉市场趋势,提高盈利机会。
-
时间优化:通过限定交易时间窗口,策略可以专注于市场最活跃和最有利可图的时段,提高交易效率。
-
风险管理:多重目标价位和止损设置有助于平衡风险和回报,保护资金安全。
-
灵活性:用户可以根据个人偏好和市场特性调整MA周期、目标价位和交易时间窗口。
-
可视化辅助:通过在图表上标注买卖信号和目标价位达成情况,交易者可以更直观地理解策略表现。
-
双向交易:策略同时支持做多和做空,能够在各种市场环境下寻找机会。
策略风险
-
震荡市场风险:在横盘震荡市场中,频繁的MA交叉可能导致过多的假信号和交易成本。
-
滑点风险:在快速市场中,实际成交价格可能与信号生成时的价格有显著差异。
-
过度依赖历史数据:移动平均线是滞后指标,可能在市场急剧转向时反应不及时。
-
时间窗口限制:严格的交易时间限制可能导致错过重要的市场机会。
-
固定止损风险:使用固定点数的止损可能在高波动性时期不够灵活。
-
过度交易:在某些市场条件下,策略可能产生过多的交易信号,增加交易成本。
策略优化方向
-
动态参数调整:考虑引入自适应机制,根据市场波动性动态调整MA周期和交易参数。
-
加入波动率过滤:在生成交易信号前,先评估市场波动率,避免在低波动期过度交易。
-
改进止损机制:可以考虑使用基于ATR(平均真实范围)的动态止损,以适应不同的市场条件。
-
整合其他技术指标:如RSI或MACD,用于确认趋势强度,提高信号质量。
-
回测优化:进行更广泛的历史数据回测,找出最优的参数组合和时间窗口设置。
-
资金管理优化:实施更复杂的仓位管理策略,如基于账户规模和市场波动性动态调整交易规模。
-
考虑基本面因素:在重要经济数据发布前后调整策略行为,避免在高不确定性期间交易。
-
机器学习整合:探索使用机器学习算法优化参数选择和信号生成过程。
总结
双均线动量交易策略是一个结合了技术分析和时间优化的趋势跟踪系统。通过利用移动平均线交叉和精心设计的交易时间窗口,该策略旨在捕捉市场趋势并优化交易执行。虽然策略具有直观性和灵活性等优势,但也面临着市场波动和过度交易等风险。通过持续优化和改进,如引入动态参数调整、改进风险管理机制和整合更多技术指标,该策略有潜力成为一个更加稳健和高效的交易系统。交易者在使用此策略时,应当充分理解其原理,并根据个人风险偏好和市场环境进行适当的参数调整。
||
Overview
This strategy is a trend-following trading system based on dual moving average crossovers and time optimization. It utilizes the intersection of short-term and long-term moving averages to generate buy and sell signals, while incorporating a specific trading time window to optimize trade execution. The strategy also includes multiple target prices and stop-loss levels to manage risk and profit-taking.
Strategy Principles
The core principle of this strategy is to use two moving averages (MAs) with different periods to identify market trends and generate trading signals. Specifically:
-
Short-term and Long-term MAs: The strategy uses two user-defined moving average periods, representing short-term and long-term market trends.
-
Crossover Signals: A buy signal is generated when the short-term MA crosses above the long-term MA; a sell signal is generated when the short-term MA crosses below the long-term MA.
-
Time Optimization: The strategy introduces a trading time window concept, executing trades only within a user-specified UTC time range, helping to avoid periods of high market volatility or low liquidity.
-
Multiple Target Prices: The strategy sets two target prices (Target_1 and Target_2) for each trade, allowing for stepped profit-taking.
-
Risk Management: Each trade is set with a stop-loss point to limit potential losses.
-
Visualization: The strategy marks buy and sell signals and labels price targets on the chart, allowing traders to intuitively understand market dynamics.
Strategy Advantages
-
Trend Following: By using moving average crossovers, the strategy can effectively capture market trends, increasing profit opportunities.
-
Time Optimization: By limiting the trading time window, the strategy can focus on the most active and profitable market periods, improving trading efficiency.
-
Risk Management: Multiple target prices and stop-loss settings help balance risk and reward, protecting capital safety.
-
Flexibility: Users can adjust MA periods, target prices, and trading time windows according to personal preferences and market characteristics.
-
Visual Assistance: By annotating buy/sell signals and target price achievements on the chart, traders can more intuitively understand strategy performance.
-
Bi-directional Trading: The strategy supports both long and short positions, seeking opportunities in various market environments.
Strategy Risks
-
Choppy Market Risk: In sideways markets, frequent MA crossovers may lead to excessive false signals and trading costs.
-
Slippage Risk: In fast markets, actual execution prices may differ significantly from prices at signal generation.
-
Over-reliance on Historical Data: Moving averages are lagging indicators and may not react timely to sudden market reversals.
-
Time Window Limitations: Strict trading time restrictions may cause missed important market opportunities.
-
Fixed Stop-Loss Risk: Using fixed-point stop-losses may not be flexible enough during high volatility periods.
-
Overtrading: Under certain market conditions, the strategy may generate too many trading signals, increasing transaction costs.
Strategy Optimization Directions
-
Dynamic Parameter Adjustment: Consider introducing adaptive mechanisms to dynamically adjust MA periods and trading parameters based on market volatility.
-
Volatility Filtering: Evaluate market volatility before generating trading signals to avoid overtrading during low volatility periods.
-
Improved Stop-Loss Mechanism: Consider using dynamic stop-losses based on ATR (Average True Range) to adapt to different market conditions.
-
Integration of Other Technical Indicators: Such as RSI or MACD, to confirm trend strength and improve signal quality.
-
Backtesting Optimization: Conduct more extensive historical data backtesting to find optimal parameter combinations and time window settings.
-
Capital Management Optimization: Implement more sophisticated position sizing strategies, such as dynamically adjusting trade size based on account size and market volatility.
-
Consideration of Fundamental Factors: Adjust strategy behavior before and after important economic data releases to avoid trading during high uncertainty periods.
-
Machine Learning Integration: Explore using machine learning algorithms to optimize parameter selection and signal generation processes.
Conclusion
The Dual Moving Average Momentum Trading Strategy is a trend-following system that combines technical analysis with time optimization. By leveraging moving average crossovers and a carefully designed trading time window, the strategy aims to capture market trends and optimize trade execution. While the strategy has advantages such as intuitiveness and flexibility, it also faces risks like market volatility and overtrading. Through continuous optimization and improvement, such as introducing dynamic parameter adjustments, improving risk management mechanisms, and integrating more technical indicators, this strategy has the potential to become a more robust and efficient trading system. Traders using this strategy should fully understand its principles and make appropriate parameter adjustments based on personal risk preferences and market environments.
[/trans]
Source (PineScript)
/*backtest
start: 2024-07-23 00:00:00
end: 2024-07-30 00:00:00
period: 2m
basePeriod: 1m
exchanges: [{"eid":"Futures_Binance","currency":"BTC_USDT"}]
*/

//@version=5
strategy("Gold Trend Trader", shorttitle="Gold Trader", overlay=true)

// User-defined input for moving averages
shortMA = input.int(10, minval=1, title="Short MA Period")
longMA = input.int(100, minval=1, title="Long MA Period")
target_1 = input.int(100, minval=1, title="Target_1")
target_2 = input.int(150, minval=1, title="Target_2")

// User-defined input for the start and end times with default values
startTimeInput = input.int(12, title="Start Time for Session (UTC, in hours)", minval=0, maxval=23)
endTimeInput = input.int(17, title="End Time Session (UTC, in hours)", minval=0, maxval=23)
// Convert the input hours to minutes from midnight
startTime = startTimeInput * 60
endTime = endTimeInput * 60

// Function to convert the current exchange time to UTC time in minutes
toUTCTime(exchangeTime) =>
    exchangeTimeInMinutes = exchangeTime / 60000
    // Adjust for UTC time
    utcTime = exchangeTimeInMinutes % 1440
    utcTime

// Get the current time in UTC in minutes from midnight
utcTime = toUTCTime(time)

// Check if the current UTC time is within the allowed timeframe
isAllowedTime = (utcTime >= startTime and utcTime < endTime)

// Calculating moving averages
shortMAValue = ta.sma(close, shortMA)
longMAValue = ta.sma(close, longMA)

// Plotting the MAs
plot(shortMAValue, title="Short MA", color=color.blue)
plot(longMAValue, title="Long MA", color=color.red)

// Tracking buy and sell signals
var float buyEntryPrice_1 = na
var float buyEntryPrice_2 = na
var float sellEntryPrice_1 = na
var float sellEntryPrice_2 = na

// Logic for Buy and Sell signals
buySignal = ta.crossover(shortMAValue, longMAValue) and isAllowedTime
sellSignal = ta.crossunder(shortMAValue, longMAValue) and isAllowedTime

// Entry conditions for long and short trades
if (buySignal)
    strategy.entry("Buy_1", strategy.long)
    strategy.exit("TP_1", "Buy_1", limit=close + target_1, stop=close - 100)

    strategy.entry("Buy_2", strategy.long)
    strategy.exit("TP_2", "Buy_2", limit=close + target_2, stop=close - 1500)

if (sellSignal)
    strategy.entry("Sell_1", strategy.short)
    strategy.exit("TP_3", "Sell_1", limit=close - target_1, stop=close + 100)

    strategy.entry("Sell_2", strategy.short)
    strategy.exit("TP_4", "Sell_2", limit=close - target_2, stop=close + 150)

// Apply background color for entry candles
barcolor(buySignal ? color.green : sellSignal ? color.red : na)

// Creating buy and sell labels
if (buySignal)
    label.new(bar_index, low, text="BUY", style=label.style_label_up, color=color.green, textcolor=color.white, yloc=yloc.belowbar)

if (sellSignal)
    label.new(bar_index, high, text="SELL", style=label.style_label_down, color=color.red, textcolor=color.white, yloc=yloc.abovebar)

// Creating labels for 100-point movement
if (not na(buyEntryPrice_1) and close >= buyEntryPrice_1 + target_1)
    label.new(bar_index, high, text=str.tostring(target_1), style=label.style_label_down, color=color.green, textcolor=color.white, yloc=yloc.abovebar)
    buyEntryPrice_1 := na // Reset after label is created

if (not na(buyEntryPrice_2) and close >= buyEntryPrice_2 + target_2)
    label.new(bar_index, high, text=str.tostring(target_2), style=label.style_label_down, color=color.green, textcolor=color.white, yloc=yloc.abovebar)
    buyEntryPrice_2 := na // Reset after label is created

if (not na(sellEntryPrice_1) and close <= sellEntryPrice_1 - target_1)
    label.new(bar_index, low, text=str.tostring(target_1), style=label.style_label_up, color=color.red, textcolor=color.white, yloc=yloc.belowbar)
    sellEntryPrice_1 := na // Reset after label is created

if (not na(sellEntryPrice_2) and close <= sellEntryPrice_2 - target_2)
    label.new(bar_index, low, text=str.tostring(target_2), style=label.style_label_up, color=color.red, textcolor=color.white, yloc=yloc.belowbar)
    sellEntryPrice_2 := na // Reset after label is created
Detail
https://www.fmz.com/strategy/458276
Last Modified
2024-07-31 14:50:26