
8.9 KiB
Name
双均线动态区域趋势跟踪策略-Dual-EMA-Dynamic-Zone-Trend-Following-Strategy
Author
ChaoZhang
Strategy Description
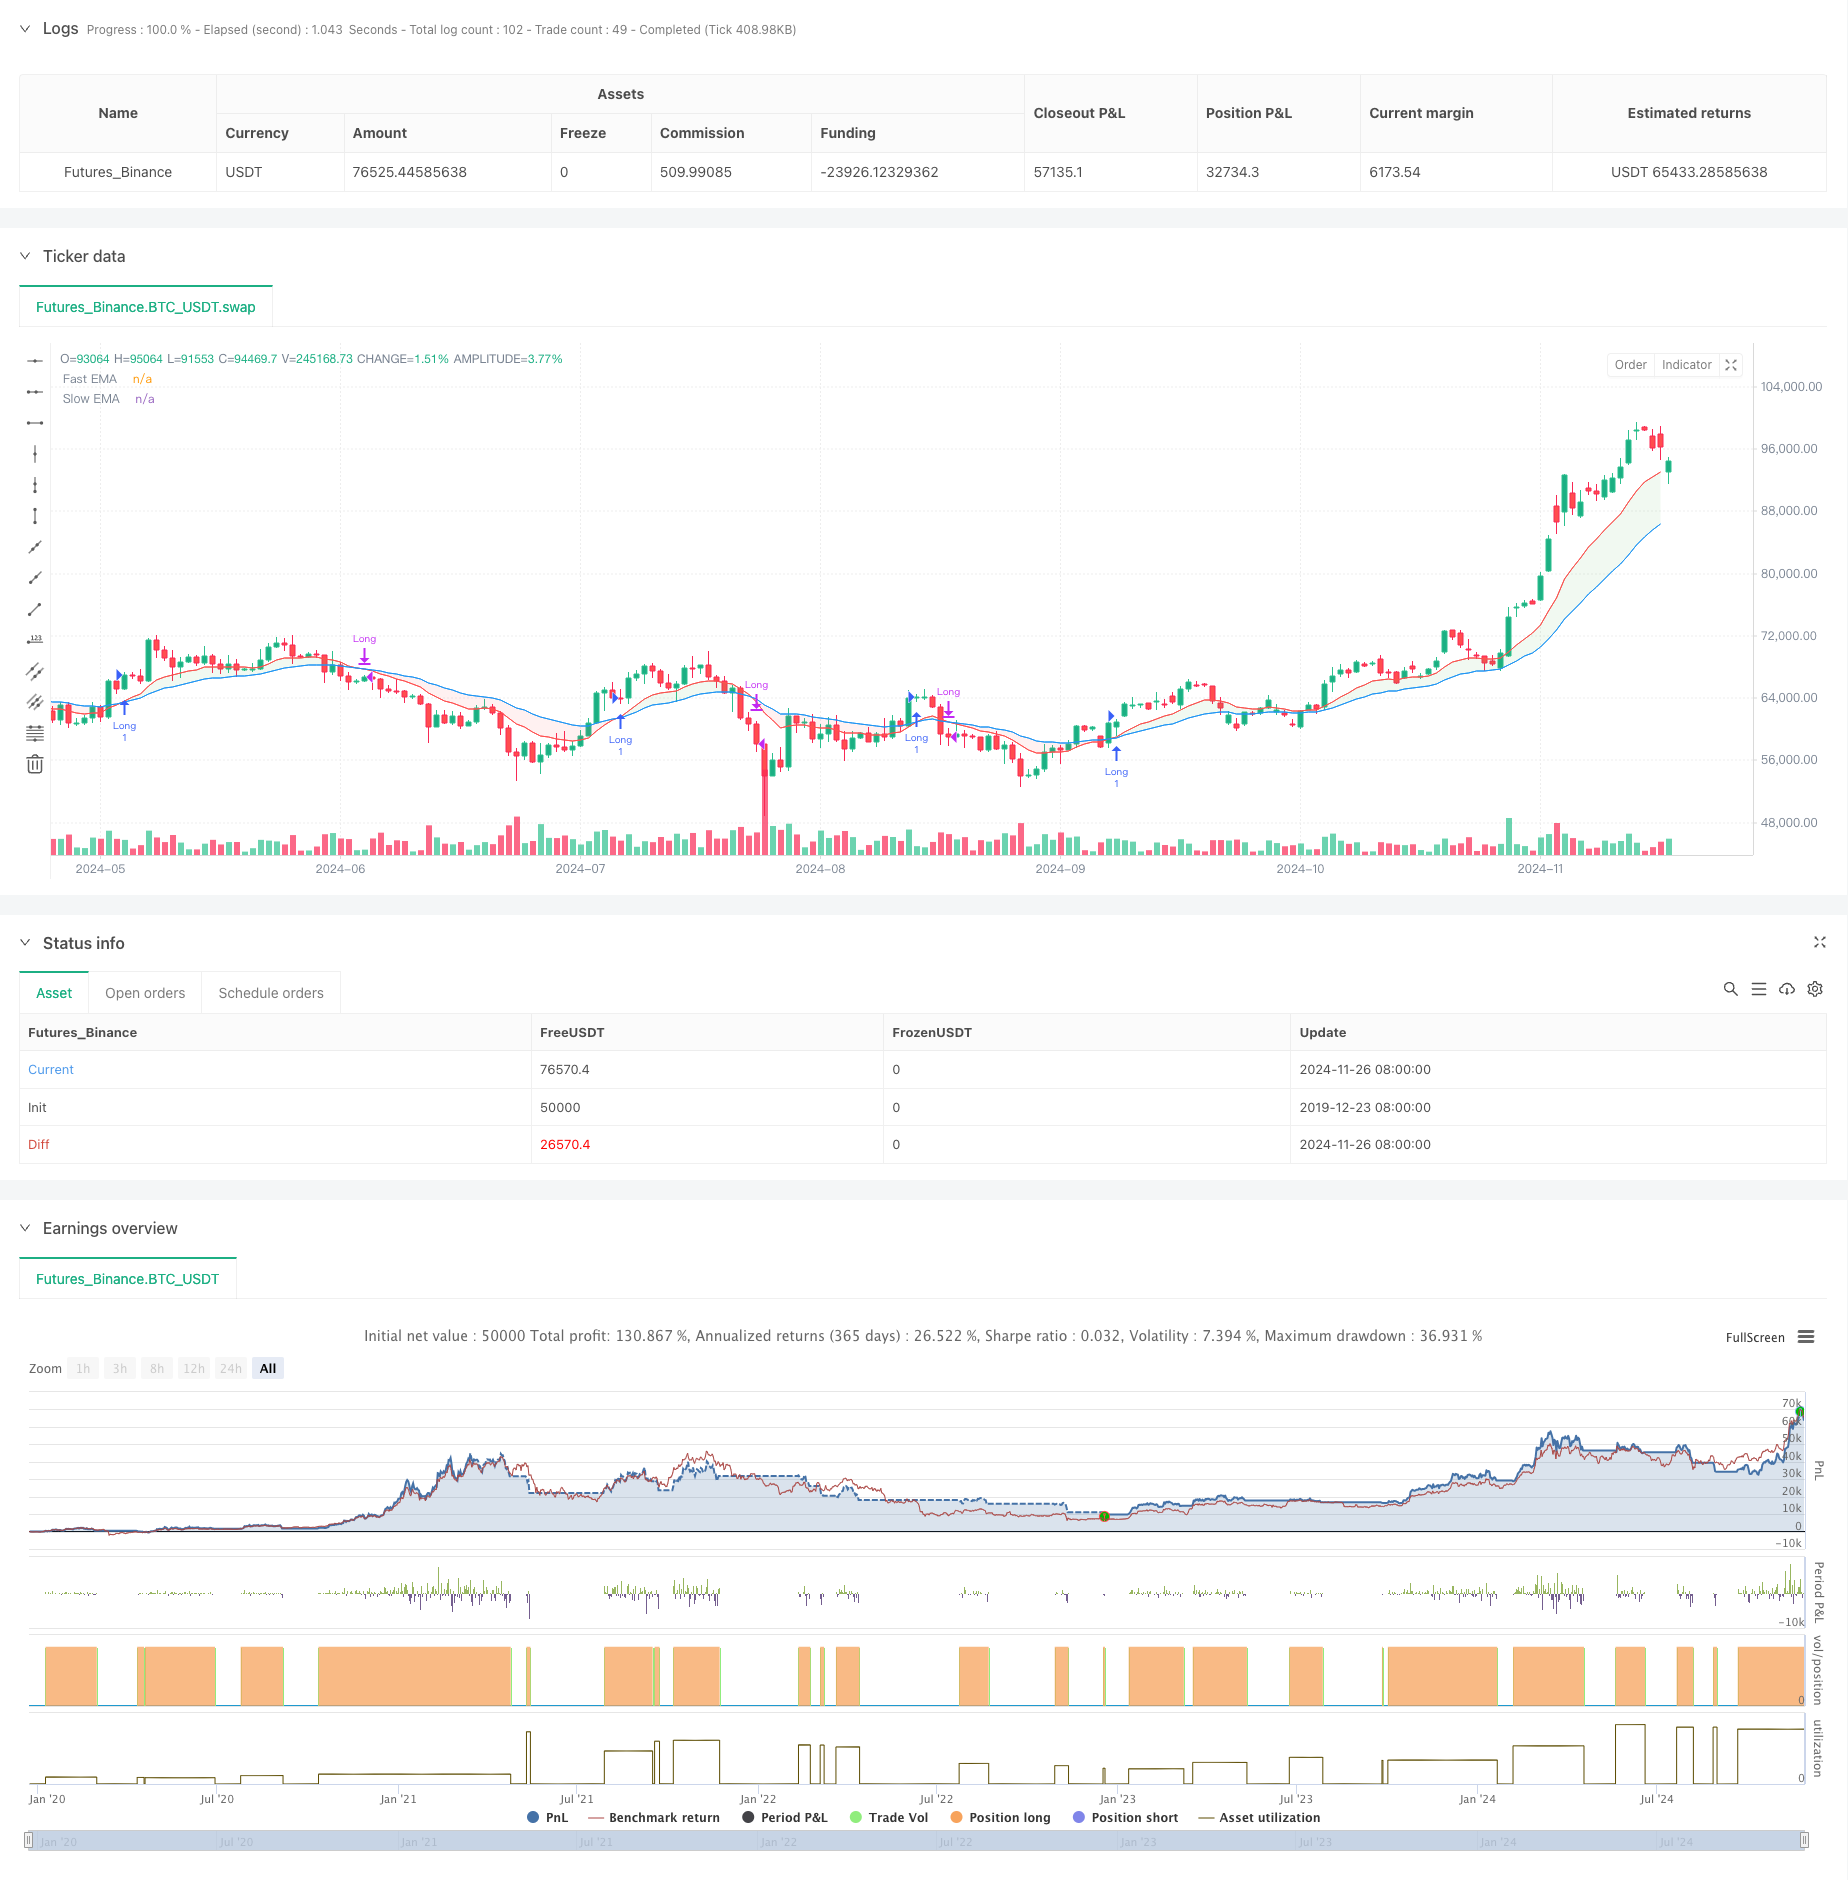
[trans]
概述
该策略是一个基于双均线(快速EMA和慢速EMA)的动态区域趋势跟踪系统。通过对价格与双均线之间的位置关系划分出不同的交易区域,结合动态颜色指示系统,为交易者提供清晰的买卖信号。策略采用经典的均线交叉理论,并通过区域划分的创新方式,提高了传统双均线系统的可操作性。
策略原理
策略的核心是通过快速EMA(默认12周期)和慢速EMA(默认26周期)的交叉关系,结合价格位置,将市场状态划分为六个不同的区域。当快线在慢线之上时,市场被认为处于多头趋势;反之则被视为空头趋势。价格相对于这两条均线的位置进一步细分出具体的交易区域:绿色区域(买入)、蓝色区域(潜在买入)、红色区域(卖出)以及黄色区域(潜在卖出)。买入信号在价格进入绿色区域且出现首个绿色蜡烛时触发,而卖出信号则在价格进入红色区域且出现首个红色蜡烛时触发。
策略优势
- 视觉直观性:通过颜色区域的动态变化,交易者可以直观地判断市场状态和潜在交易机会。
- 趋势确认:双均线系统提供了可靠的趋势确认机制,减少假信号。
- 风险管理:清晰的区域划分有助于制定止损止盈策略。
- 适应性强:策略可应用于不同的时间周期,适合各类市场环境。
- 参数可调:均线周期和平滑参数可根据不同市场特征进行优化。
策略风险
- 滞后性:均线指标本质上具有滞后性,可能导致入场或出场时机延迟。
- 震荡市不适用:在横盘震荡市场中可能产生频繁的假信号。
- 趋势反转风险:在趋势突然反转时,策略反应可能不够迅速。
- 参数依赖:不同市场环境下最优参数可能存在显著差异。
策略优化方向
- 引入波动率过滤:在高波动率环境下调整交易条件,避免假信号。
- 增加成交量确认:结合成交量指标提高信号可靠性。
- 动态参数调整:根据市场状态自动调整均线周期。
- 加入趋势强度指标:引入ADX等指标评估趋势强度。
- 优化止损策略:设计基于ATR的动态止损方案。
总结
这是一个结合了传统双均线系统和现代区域划分理念的趋势跟踪策略。通过直观的视觉反馈和清晰的交易规则,为交易者提供了一个可靠的交易框架。虽然存在均线系统固有的滞后性问题,但通过合理的参数优化和风险管理,该策略能够在趋势市场中取得稳定的表现。建议交易者在实际应用中结合市场特征进行参数优化,并始终保持适当的风险控制。 ||
Overview
This strategy is a dynamic zone trend following system based on dual EMAs (Fast and Slow). It classifies different trading zones based on the relative positions of price and EMAs, combined with a dynamic color indication system to provide clear buy/sell signals. The strategy adopts classical moving average crossover theory while innovating through zone classification to enhance the operability of traditional dual EMA systems.
Strategy Principle
The core of the strategy lies in dividing market conditions into six distinct zones using the crossover relationship between Fast EMA (default 12 periods) and Slow EMA (default 26 periods), combined with price position. When the fast line is above the slow line, the market is considered bullish; conversely, it's considered bearish. The price position relative to these two moving averages further subdivides into specific trading zones: Green Zone (Buy), Blue Zone (Potential Buy), Red Zone (Sell), and Yellow Zone (Potential Sell). Buy signals are triggered when price enters the green zone and the first green candle appears, while sell signals are triggered when price enters the red zone and the first red candle appears.
Strategy Advantages
- Visual Intuitiveness: Dynamic color zone changes allow traders to visually assess market conditions and potential trading opportunities.
- Trend Confirmation: The dual EMA system provides reliable trend confirmation mechanisms, reducing false signals.
- Risk Management: Clear zone classification aids in setting stop-loss and take-profit strategies.
- High Adaptability: The strategy can be applied to different timeframes and is suitable for various market environments.
- Adjustable Parameters: EMA periods and smoothing parameters can be optimized for different market characteristics.
Strategy Risks
- Lag: Moving averages are inherently lagging indicators, potentially leading to delayed entry or exit timing.
- Ineffective in Ranging Markets: May generate frequent false signals in sideways markets.
- Trend Reversal Risk: Strategy may not respond quickly enough to sudden trend reversals.
- Parameter Dependency: Optimal parameters may vary significantly across different market environments.
Strategy Optimization Directions
- Introduce Volatility Filtering: Adjust trading conditions in high volatility environments to avoid false signals.
- Add Volume Confirmation: Incorporate volume indicators to enhance signal reliability.
- Dynamic Parameter Adjustment: Automatically adjust EMA periods based on market conditions.
- Include Trend Strength Indicators: Introduce ADX or similar indicators to evaluate trend strength.
- Optimize Stop Loss Strategy: Design dynamic stop-loss solutions based on ATR.
Summary
This is a trend following strategy that combines traditional dual EMA systems with modern zone classification concepts. Through intuitive visual feedback and clear trading rules, it provides traders with a reliable trading framework. While inherent lag issues exist with moving average systems, the strategy can achieve stable performance in trending markets through proper parameter optimization and risk management. Traders are advised to optimize parameters based on market characteristics and maintain appropriate risk control in practical applications.[/trans]
Source (PineScript)
/*backtest
start: 2019-12-23 08:00:00
end: 2024-11-27 08:00:00
period: 1d
basePeriod: 1d
exchanges: [{"eid":"Futures_Binance","currency":"BTC_USDT"}]
*/

//@version=5
strategy("NUTJP CDC ActionZone 2024", overlay=true, precision=6, commission_value=0.1, slippage=3)

//****************************************************************************//
// CDC Action Zone is based on a simple EMA crossover
// between [default] EMA12 and EMA26
//****************************************************************************//

// Define User Input Variables
xsrc = input.source(title='Source Data', defval=close)
xprd1 = input.int(title='Fast EMA period', defval=12)
xprd2 = input.int(title='Slow EMA period', defval=26)
xsmooth = input.int(title='Smoothing period (1 = no smoothing)', defval=1)
fillSW = input.bool(title='Paint Bar Colors', defval=true)
fastSW = input.bool(title='Show fast moving average line', defval=true)
slowSW = input.bool(title='Show slow moving average line', defval=true)

xfixtf = input.bool(title='** Use Fixed time frame Mode (advanced) **', defval=false)
xtf = input.timeframe(title='** Fix chart to which time frame? **', defval='D')

startDate = input(timestamp("2018-01-01 00:00"), title="Start Date")
endDate = input(timestamp("2069-12-31 23:59"), title="End Date")

//****************************************************************************//
// Calculate Indicators
f_secureSecurity(_symbol, _res, _src) => request.security(_symbol, _res, _src[1], lookahead=barmerge.lookahead_on)

xPrice = ta.ema(xsrc, xsmooth)

FastMA = xfixtf ? ta.ema(f_secureSecurity(syminfo.tickerid, xtf, ta.ema(xsrc, xprd1)), xsmooth) : ta.ema(xPrice, xprd1)

SlowMA = xfixtf ? ta.ema(f_secureSecurity(syminfo.tickerid, xtf, ta.ema(xsrc, xprd2)), xsmooth) : ta.ema(xPrice, xprd2)

Bull = FastMA > SlowMA
Bear = FastMA < SlowMA

// Define Color Zones
Green = Bull and xPrice > FastMA
Red = Bear and xPrice < FastMA

// Buy and Sell Conditions
buycond = Green and not Green[1]
sellcond = Red and not Red[1]

inDateRange = true

if inDateRange
    if buycond
        strategy.entry("Long", strategy.long, qty=1)
    if sellcond
        strategy.close("Long")

//****************************************************************************//
// Display color on chart
bColor = Green ? color.green :
         Red ? color.red :
         color.black
barcolor(color=fillSW ? bColor : na)

// Display MA lines
FastL = plot(fastSW ? FastMA : na, "Fast EMA", color=color.new(color.red, 0), style=xfixtf ? plot.style_stepline : plot.style_line)
SlowL = plot(slowSW ? SlowMA : na, "Slow EMA", color=color.new(color.blue, 0), style=xfixtf ? plot.style_stepline : plot.style_line)
fill(FastL, SlowL, Bull ? color.new(color.green, 90) : (Bear ? color.new(color.red, 90) : na))
Detail
https://www.fmz.com/strategy/473386
Last Modified
2024-11-29 16:12:58