
9.0 KiB
Name
双均线交叉RSI动量策略与风险收益优化系统-Dual-Moving-Average-Cross-RSI-Momentum-Strategy-with-Risk-Reward-Optimization-System
Author
ChaoZhang
Strategy Description
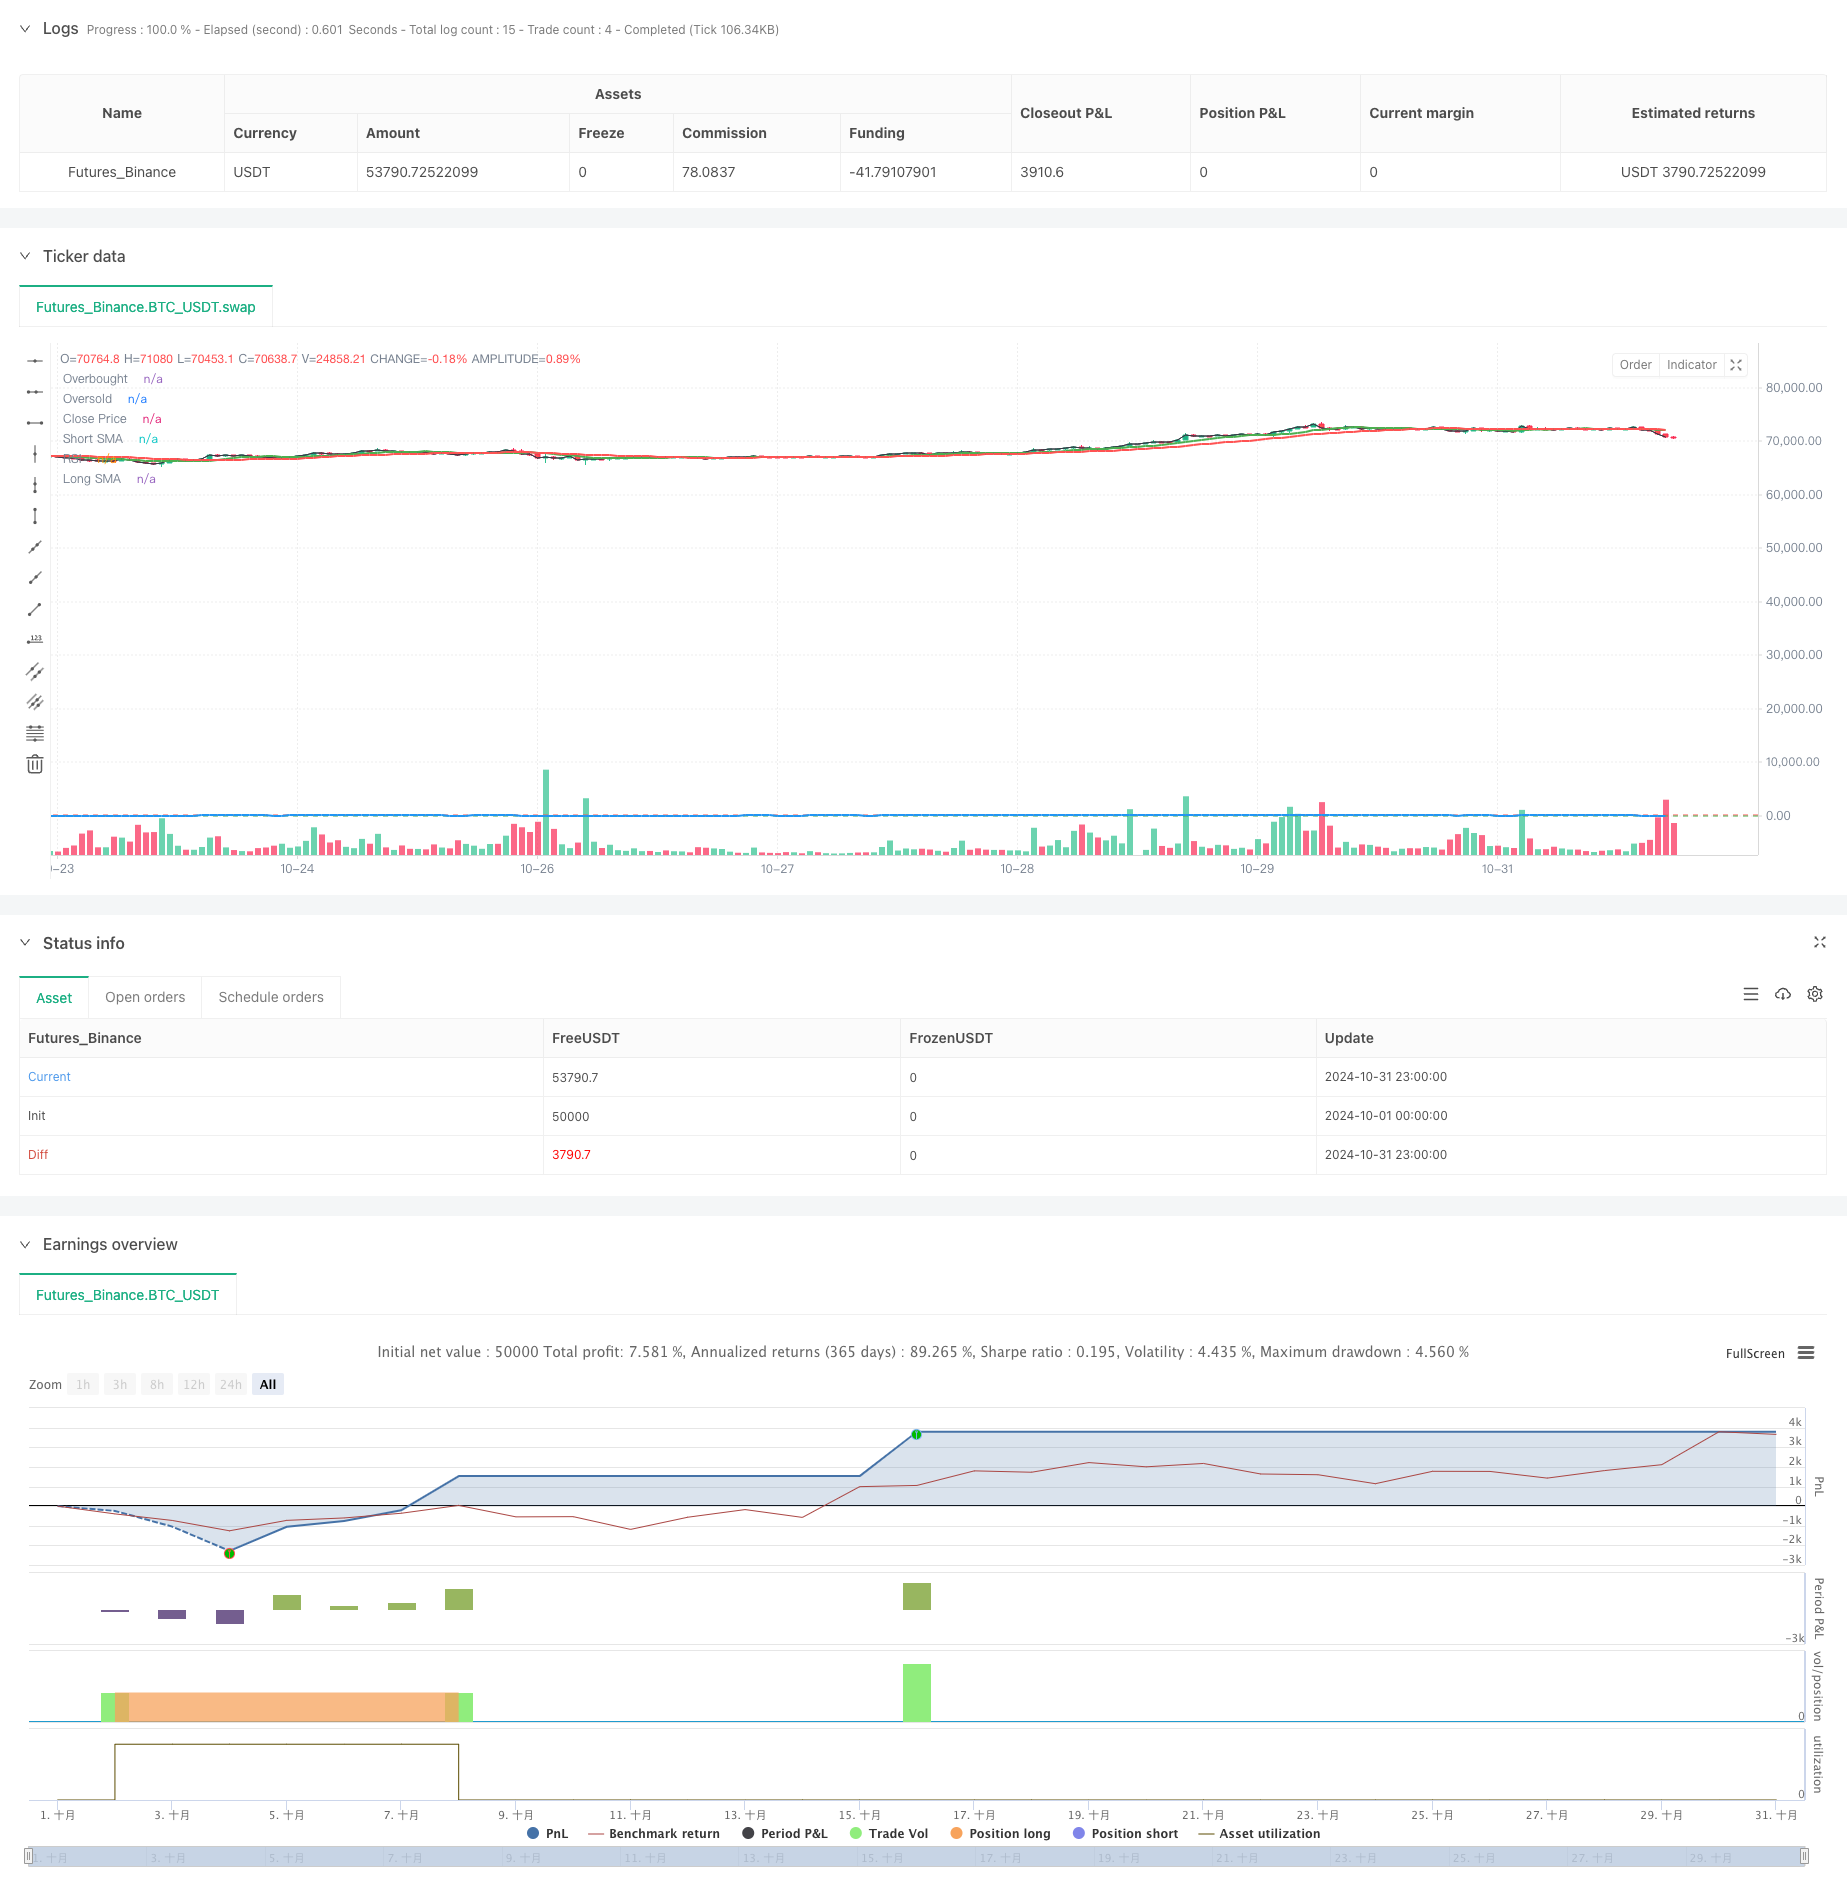
[trans]
概述
这是一个结合双均线交叉、RSI超买超卖以及风险收益比的量化交易策略。该策略通过短期和长期移动平均线的交叉来确定市场趋势方向,同时利用RSI指标识别超买超卖区域,实现更精准的交易信号过滤。策略还集成了基于ATR的动态止损设置和固定风险收益比的获利目标管理系统。
策略原理
策略采用9日和21日两条移动平均线作为趋势判断的基础,通过RSI指标的超买超卖区域(35/65)进行信号确认。在多头入场条件下,要求短期均线位于长期均线之上且RSI处于超卖区域(低于35);空头入场则需要短期均线位于长期均线之下且RSI处于超买区域(高于65)。策略使用1.5倍ATR值设置止损距离,并基于2:1的风险收益比自动计算获利目标。为防止过度持仓,策略设置了最短3小时的持仓时间限制。
策略优势
- 多重信号确认机制显著提升了交易的可靠性
- 动态止损设置能够根据市场波动性自适应调整
- 固定风险收益比有助于长期稳定获利
- 最短持仓时间限制有效避免了过度交易
- 可视化标记系统便于策略监控和回测分析
- 背景颜色变化直观显示当前持仓状态
策略风险
- 双均线系统在震荡市可能产生假信号
- RSI指标在强势趋势中可能错过部分交易机会
- 固定的风险收益比可能在某些市场环境下不够灵活
- ATR止损在波动性突变时可能不够及时
- 最短持仓时间可能导致错过及时止损机会
策略优化方向
- 引入自适应的均线周期选择机制,根据市场状态动态调整
- 增加趋势强度过滤器,提高信号质量
- 开发动态风险收益比调整系统,适应不同市场环境
- 整合成交量指标,提升信号可靠性
- 添加市场波动性分析模块,优化交易时机选择
- 引入机器学习算法优化参数选择
总结
本策略通过多重技术指标的协同配合,构建了一个相对完整的交易系统。它不仅关注入场信号的质量,还注重风险管理和利润目标的设定。虽然存在一些需要优化的地方,但整体框架设计合理,具有良好的实用价值和扩展空间。策略的模块化设计也为后续优化提供了便利条件。
||
Overview
This is a quantitative trading strategy that combines dual moving average crossover, RSI overbought/oversold conditions, and risk-reward ratio management. The strategy determines market trend direction through short-term and long-term moving average crossovers while using RSI indicator to identify overbought/oversold zones for more precise trade signal filtering. It also integrates ATR-based dynamic stop-loss settings and a fixed risk-reward ratio profit target management system.
Strategy Principles
The strategy employs 9-day and 21-day moving averages as the foundation for trend determination, with RSI indicator's overbought/oversold zones (35/65) for signal confirmation. Long entry conditions require the short-term MA above the long-term MA and RSI in oversold territory (below 35); short entry requires the short-term MA below the long-term MA and RSI in overbought territory (above 65). The strategy uses 1.5 times ATR value for stop-loss distance and automatically calculates profit targets based on a 2:1 risk-reward ratio. To prevent overtrading, a minimum 3-hour holding period is implemented.
Strategy Advantages
- Multiple signal confirmation mechanism significantly improves trade reliability
- Dynamic stop-loss settings adapt to market volatility
- Fixed risk-reward ratio aids in long-term stable profitability
- Minimum holding period effectively prevents overtrading
- Visual marking system facilitates strategy monitoring and backtest analysis
- Background color changes intuitively display current position status
Strategy Risks
- Dual MA system may generate false signals in ranging markets
- RSI indicator might miss trading opportunities in strong trends
- Fixed risk-reward ratio may lack flexibility in certain market conditions
- ATR stops may not respond quickly enough to volatility spikes
- Minimum holding period might cause missed stop-loss opportunities
Strategy Optimization Directions
- Introduce adaptive moving average period selection based on market conditions
- Add trend strength filters to improve signal quality
- Develop dynamic risk-reward ratio adjustment system for different market environments
- Integrate volume indicators to enhance signal reliability
- Add market volatility analysis module to optimize trade timing
- Incorporate machine learning algorithms for parameter optimization
Summary
This strategy constructs a relatively complete trading system through the coordination of multiple technical indicators. It focuses not only on entry signal quality but also on risk management and profit target setting. While there are areas for optimization, the overall framework design is reasonable with good practical value and room for expansion. The modular design also provides convenience for subsequent optimizations. [/trans]
Source (PineScript)
/*backtest
start: 2024-10-01 00:00:00
end: 2024-10-31 23:59:59
period: 1h
basePeriod: 1h
exchanges: [{"eid":"Futures_Binance","currency":"BTC_USDT"}]
*/

//@version=5
strategy("JakeJohn", overlay=true)

// Input parameters
smaShortLength = input(9, title="Short SMA Length")
smaLongLength = input(21, title="Long SMA Length")
lengthRSI = input(14, title="RSI Length")
rsiOverbought = input(65, title="RSI Overbought Level")
rsiOversold = input(35, title="RSI Oversold Level")
riskRewardRatio = input(2, title="Risk/Reward Ratio") // 2:1
atrMultiplier = input(1.5, title="ATR Multiplier") // Multiplier for ATR to set stop loss

// Calculate indicators
smaShort = ta.sma(close, smaShortLength)
smaLong = ta.sma(close, smaLongLength)
rsi = ta.rsi(close, lengthRSI)
atr = ta.atr(14)

// Entry conditions
longCondition = (smaShort > smaLong) and (rsi < rsiOversold) // Buy when short SMA is above long SMA and RSI is oversold
shortCondition = (smaShort < smaLong) and (rsi > rsiOverbought) // Sell when short SMA is below long SMA and RSI is overbought

// Variables for trade management
var float entryPrice = na
var float takeProfit = na
var int entryBarIndex = na

// Entry logic for long trades
if (longCondition and (strategy.position_size == 0))
    entryPrice := close
    takeProfit := entryPrice + (entryPrice - (entryPrice - (atr * atrMultiplier))) * riskRewardRatio
    strategy.entry("Buy", strategy.long)
    entryBarIndex := bar_index // Record the entry bar index
    label.new(bar_index, high, "BUY", style=label.style_label_up, color=color.green, textcolor=color.white, size=size.small)

// Entry logic for short trades
if (shortCondition and (strategy.position_size == 0))
    entryPrice := close
    takeProfit := entryPrice - (entryPrice - (entryPrice + (atr * atrMultiplier))) * riskRewardRatio
    strategy.entry("Sell", strategy.short)
    entryBarIndex := bar_index // Record the entry bar index
    label.new(bar_index, low, "SELL", style=label.style_label_down, color=color.red, textcolor=color.white, size=size.small)

// Manage trade duration and exit after a minimum of 3 hours
if (strategy.position_size != 0)
    // Check if the trade has been open for at least 3 hours (180 minutes)
    if (bar_index - entryBarIndex >= 180) // 3 hours in 1-minute bars
        if (strategy.position_size > 0)
            strategy.exit("Take Profit Long", from_entry="Buy", limit=takeProfit)
        else
            strategy.exit("Take Profit Short", from_entry="Sell", limit=takeProfit)

// Background colors for active trades
var color tradeColor = na
if (strategy.position_size > 0)
    tradeColor := color.new(color.green, 90) // Light green for long trades
else if (strategy.position_size < 0)
    tradeColor := color.new(color.red, 90) // Light red for short trades
else
    tradeColor := na // No color when no trade is active

bgcolor(tradeColor, title="Trade Background")

// Plotting position tools
if (strategy.position_size > 0)
    // Plot long position tool
    strategy.exit("TP Long", limit=takeProfit)

if (strategy.position_size < 0)
    // Plot short position tool
    strategy.exit("TP Short", limit=takeProfit)

// Plotting indicators
plot(smaShort, color=color.green, title="Short SMA", linewidth=2)
plot(smaLong, color=color.red, title="Long SMA", linewidth=2)

// Visual enhancements for RSI
hline(rsiOverbought, "Overbought", color=color.red)
hline(rsiOversold, "Oversold", color=color.green)
plot(rsi, color=color.blue, title="RSI", linewidth=2)

// Ensure there's at least one plot function
plot(close, color=color.black, title="Close Price", display=display.none) // Hidden plot for compliance
Detail
https://www.fmz.com/strategy/471707
Last Modified
2024-11-12 16:00:58