
12 KiB
Name
双均线交叉确认策略与量价结合优化模型-Dual-Moving-Average-Crossover-Confirmation-Strategy-with-Volume-Price-Integration-Optimization-Model
Author
ChaoZhang
Strategy Description
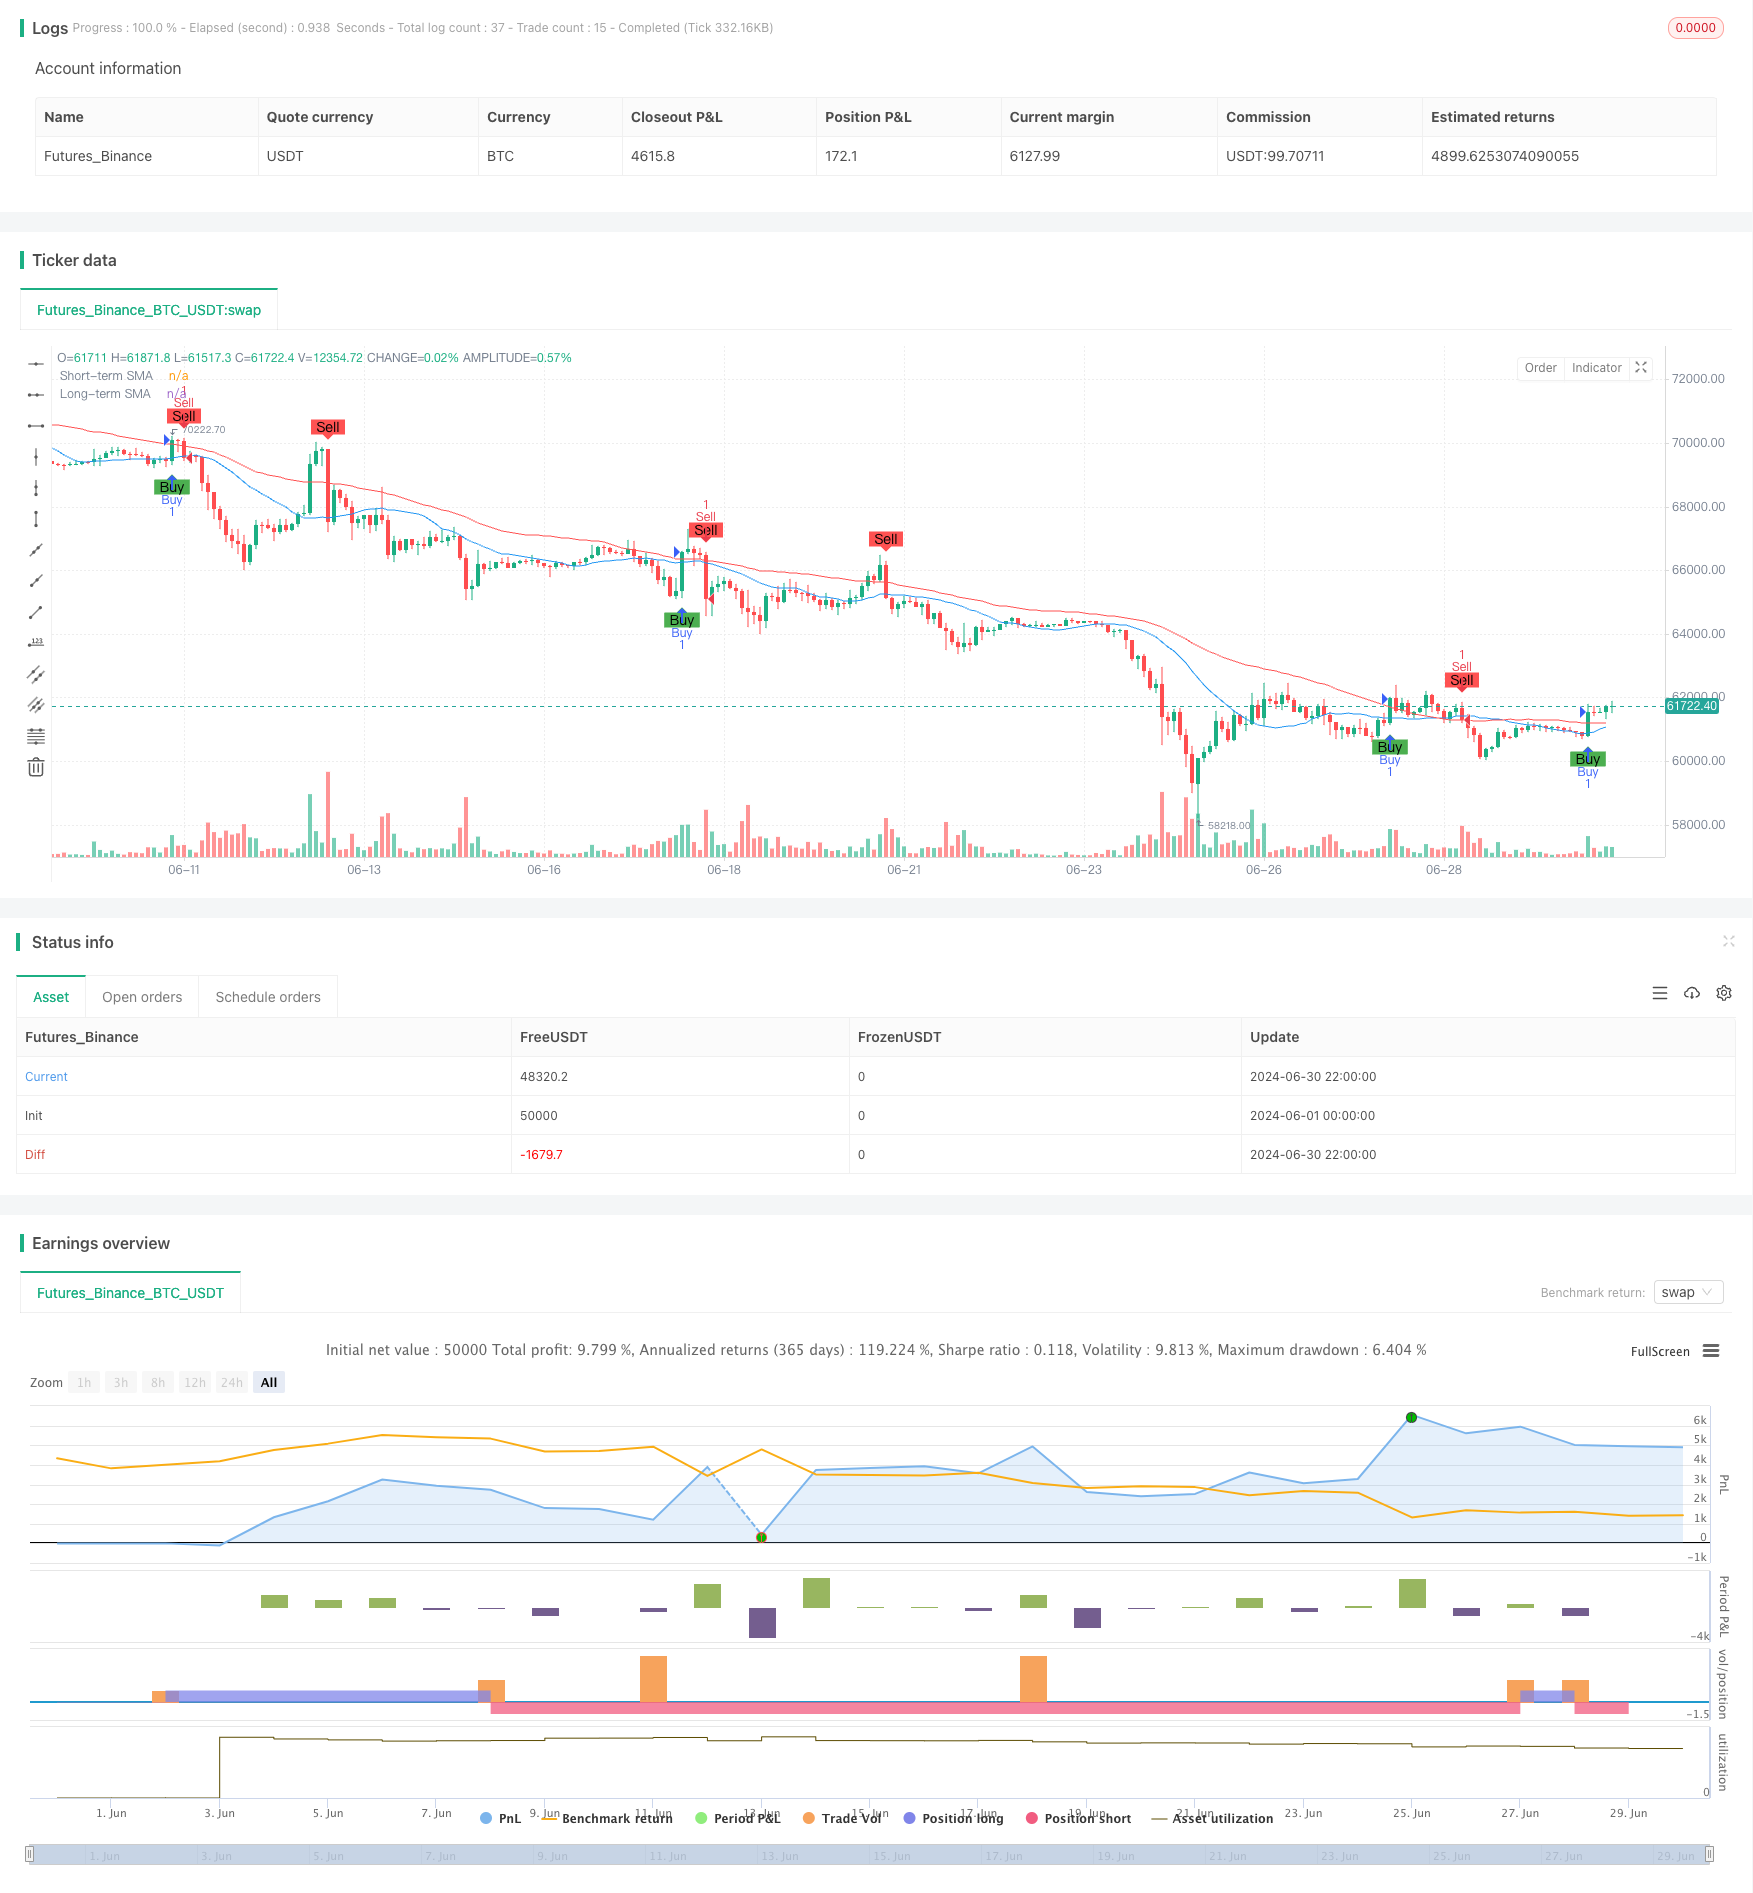
[trans]
概述
双均线交叉确认策略与量价结合优化模型是一种结合了短期和长期简单移动平均线(SMA)的交易策略,通过价格与均线的交叉来产生买卖信号。该策略的独特之处在于引入了额外的确认机制,包括成交量变化、其他技术指标或价格行为分析,以减少虚假信号的出现。策略的核心是在识别潜在交易机会的同时,通过多重确认提高信号的可靠性,从而在交易执行中实现更高的成功率和更好的风险管理。
策略原理
-
移动平均线选择:策略允许用户自定义短期和长期SMA的周期,可选范围从5日到200日不等,以适应不同的市场条件和交易风格。
-
信号生成:
- 买入信号:当价格上穿短期SMA,且同时高于长期SMA时产生。
- 卖出信号:当价格下穿短期SMA,且同时低于长期SMA时产生。
-
信号确认:
- 买入确认:要求前一个收盘价和当前收盘价都高于长期SMA。
- 卖出确认:要求前一个收盘价和当前收盘价都低于长期SMA。
-
交易执行:只有在信号得到确认后,策略才会执行相应的买入或卖出操作。
-
可视化:策略在图表上绘制了短期和长期SMA线,并用标记显示买卖信号,方便交易者直观地分析市场情况。
策略优势
-
灵活性:允许用户自定义短期和长期SMA的周期,适应不同的市场环境和个人交易偏好。
-
信号确认机制:通过要求价格不仅要穿越短期SMA,还要确认相对于长期SMA的位置,减少了虚假信号的产生。
-
趋势跟踪:利用两条SMA的交叉和价格位置,有效捕捉中长期趋势的变化。
-
风险管理:通过确认机制,降低了在市场横盘或波动剧烈时频繁交易的风险。
-
可视化支持:在图表上清晰标记买卖信号,便于交易者快速识别潜在的交易机会。
-
适应性强:策略框架允许进一步整合其他技术指标或自定义条件,为高级用户提供了扩展的空间。
策略风险
-
滞后性:作为趋势跟踪策略,可能在趋势反转初期反应较慢,导致入场或出场时机略有延迟。
-
横盘市场表现:在无明显趋势的市场中,可能产生频繁的虚假信号,增加交易成本。
-
参数敏感性:不同的SMA周期设置可能导致策略性能差异较大,需要仔细优化和回测。
-
过度依赖历史数据:策略假设过去的价格模式在未来会重复出现,这在市场结构发生重大变化时可能失效。
-
缺乏止损机制:当前版本未包含明确的止损策略,可能在极端市场条件下面临较大风险。
策略优化方向
-
引入动态参数调整:基于市场波动性自动调整SMA周期,以适应不同市场阶段。
-
整合成交量分析:将成交量变化作为额外的确认指标,提高信号的可靠性。
-
添加趋势强度过滤:使用ADX等指标衡量趋势强度,只在强趋势中执行交易。
-
实现自适应止损:根据市场波动性动态设置止损位,优化风险管理。
-
考虑多时间框架分析:结合更长期的趋势判断,提高交易决策的准确性。
-
加入波动率过滤:在高波动率期间调整策略参数或暂停交易,降低风险。
-
引入机器学习模型:利用历史数据训练模型,优化参数选择和信号确认过程。
总结
双均线交叉确认策略与量价结合优化模型是一个灵活、可扩展的交易系统框架。通过结合短期和长期SMA,并引入额外的确认机制,该策略在捕捉市场趋势的同时,有效降低了虚假信号的风险。其灵活的参数设置和清晰的可视化支持,使其适用于不同风格的交易者。然而,策略的成功仍然依赖于合理的参数选择和市场条件的适应性。未来的优化方向应focus on提高策略的自适应能力,整合更多的技术分析工具,并引入先进的风险管理技术。通过不断改进和调整,这个策略框架有潜力成为一个强大的量化交易工具,为交易者在复杂多变的市场环境中提供可靠的决策支持。
||
Overview
The Dual Moving Average Crossover Confirmation Strategy with Volume-Price Integration Optimization Model is a trading strategy that combines short-term and long-term Simple Moving Averages (SMA) to generate buy and sell signals based on price crossovers. What sets this strategy apart is its incorporation of additional confirmation mechanisms, including volume changes, other technical indicators, or price action analysis, to reduce the occurrence of false signals. The core of the strategy lies in identifying potential trading opportunities while enhancing signal reliability through multiple confirmations, thereby achieving higher success rates and better risk management in trade execution.
Strategy Principles
-
Moving Average Selection: The strategy allows users to customize the periods for both short-term and long-term SMAs, with options ranging from 5 to 200 days, to adapt to different market conditions and trading styles.
-
Signal Generation:
- Buy Signal: Generated when the price crosses above the short-term SMA and is simultaneously above the long-term SMA.
- Sell Signal: Generated when the price crosses below the short-term SMA and is simultaneously below the long-term SMA.
-
Signal Confirmation:
- Buy Confirmation: Requires both the previous and current closing prices to be above the long-term SMA.
- Sell Confirmation: Requires both the previous and current closing prices to be below the long-term SMA.
-
Trade Execution: The strategy only executes corresponding buy or sell operations after the signals are confirmed.
-
Visualization: The strategy plots both short-term and long-term SMA lines on the chart and displays buy/sell signals with markers, allowing traders to analyze market conditions intuitively.
Strategy Advantages
-
Flexibility: Allows users to customize the periods of short-term and long-term SMAs, adapting to different market environments and personal trading preferences.
-
Signal Confirmation Mechanism: Reduces false signals by requiring price not only to cross the short-term SMA but also to confirm its position relative to the long-term SMA.
-
Trend Following: Effectively captures medium to long-term trend changes by utilizing the crossover of two SMAs and price position.
-
Risk Management: Reduces the risk of frequent trading during sideways or highly volatile markets through the confirmation mechanism.
-
Visual Support: Clearly marks buy and sell signals on the chart, allowing traders to quickly identify potential trading opportunities.
-
High Adaptability: The strategy framework allows for further integration of other technical indicators or custom conditions, providing room for expansion for advanced users.
Strategy Risks
-
Lag: As a trend-following strategy, it may react slowly at the beginning of trend reversals, leading to slightly delayed entry or exit timing.
-
Performance in Sideways Markets: May generate frequent false signals in markets without clear trends, increasing trading costs.
-
Parameter Sensitivity: Different SMA period settings can lead to significant variations in strategy performance, requiring careful optimization and backtesting.
-
Over-reliance on Historical Data: The strategy assumes that past price patterns will repeat in the future, which may fail when market structure undergoes significant changes.
-
Lack of Stop-Loss Mechanism: The current version does not include an explicit stop-loss strategy, potentially facing significant risks under extreme market conditions.
Strategy Optimization Directions
-
Introduce Dynamic Parameter Adjustment: Automatically adjust SMA periods based on market volatility to adapt to different market phases.
-
Integrate Volume Analysis: Use volume changes as an additional confirmation indicator to improve signal reliability.
-
Add Trend Strength Filtering: Use indicators like ADX to measure trend strength and only execute trades in strong trends.
-
Implement Adaptive Stop-Loss: Dynamically set stop-loss levels based on market volatility to optimize risk management.
-
Consider Multi-Timeframe Analysis: Combine longer-term trend judgments to improve trading decision accuracy.
-
Add Volatility Filtering: Adjust strategy parameters or pause trading during high volatility periods to reduce risk.
-
Incorporate Machine Learning Models: Utilize historical data to train models for optimizing parameter selection and signal confirmation processes.
Conclusion
The Dual Moving Average Crossover Confirmation Strategy with Volume-Price Integration Optimization Model is a flexible and expandable trading system framework. By combining short-term and long-term SMAs and introducing additional confirmation mechanisms, this strategy effectively captures market trends while reducing the risk of false signals. Its flexible parameter settings and clear visual support make it suitable for traders with different styles. However, the success of the strategy still depends on reasonable parameter selection and adaptability to market conditions. Future optimization directions should focus on improving the strategy's adaptability, integrating more technical analysis tools, and introducing advanced risk management techniques. Through continuous improvement and adjustment, this strategy framework has the potential to become a powerful quantitative trading tool, providing reliable decision support for traders in complex and ever-changing market environments.
[/trans]
Source (PineScript)
/*backtest
start: 2024-06-01 00:00:00
end: 2024-06-30 23:59:59
period: 2h
basePeriod: 15m
exchanges: [{"eid":"Futures_Binance","currency":"BTC_USDT"}]
*/

//@version=5
strategy("Customizable SMA Crossover Strategy with Confirmation", overlay=true)

// Input parameters
shortSMA_choice = input.string(title="Short-term SMA Choice", defval="SMA 20", options=["SMA 5", "SMA 10", "SMA 20", "SMA 50", "SMA 100", "SMA 200"])
longSMA_choice = input.string(title="Long-term SMA Choice", defval="SMA 50", options=["SMA 5", "SMA 10", "SMA 20", "SMA 50", "SMA 100", "SMA 200"])

// Determine short-term SMA length based on user choice
shortSMA_length = switch shortSMA_choice
    "SMA 5" => 5
    "SMA 10" => 10
    "SMA 20" => 20
    "SMA 50" => 50
    "SMA 100" => 100
    "SMA 200" => 200

// Determine long-term SMA length based on user choice
longSMA_length = switch longSMA_choice
    "SMA 5" => 5
    "SMA 10" => 10
    "SMA 20" => 20
    "SMA 50" => 50
    "SMA 100" => 100
    "SMA 200" => 200

// Calculate SMAs
shortSMA = ta.sma(close, shortSMA_length)
longSMA = ta.sma(close, longSMA_length)

// Plot SMAs
plot(shortSMA, title="Short-term SMA", color=color.blue)
plot(longSMA, title="Long-term SMA", color=color.red)

// Generate signals
buySignal = ta.crossover(close, shortSMA) and close > longSMA and close[1] <= longSMA
sellSignal = ta.crossunder(close, shortSMA) and close < longSMA and close[1] >= longSMA

// Confirmation conditions
buyCondition = buySignal and close[1] > longSMA and close > longSMA
sellCondition = sellSignal and close[1] < longSMA and close < longSMA

// Execute trades
if (buySignal)
    strategy.entry("Buy", strategy.long)
if (sellSignal)
    strategy.entry("Sell", strategy.short)

// Plot signals on the chart
plotshape(series=buySignal, location=location.belowbar, color=color.green, style=shape.labelup, text="Buy", title="Buy Signal")
plotshape(series=sellSignal, location=location.abovebar, color=color.red, style=shape.labeldown, text="Sell", title="Sell Signal")
Detail
https://www.fmz.com/strategy/458197
Last Modified
2024-07-30 17:12:28