
7.4 KiB
Name
双均线交叉止盈止损自适应策略-Dual-Moving-Average-Crossover-Strategy-with-Adaptive-Stop-Loss-and-Take-Profit
Author
ChaoZhang
Strategy Description
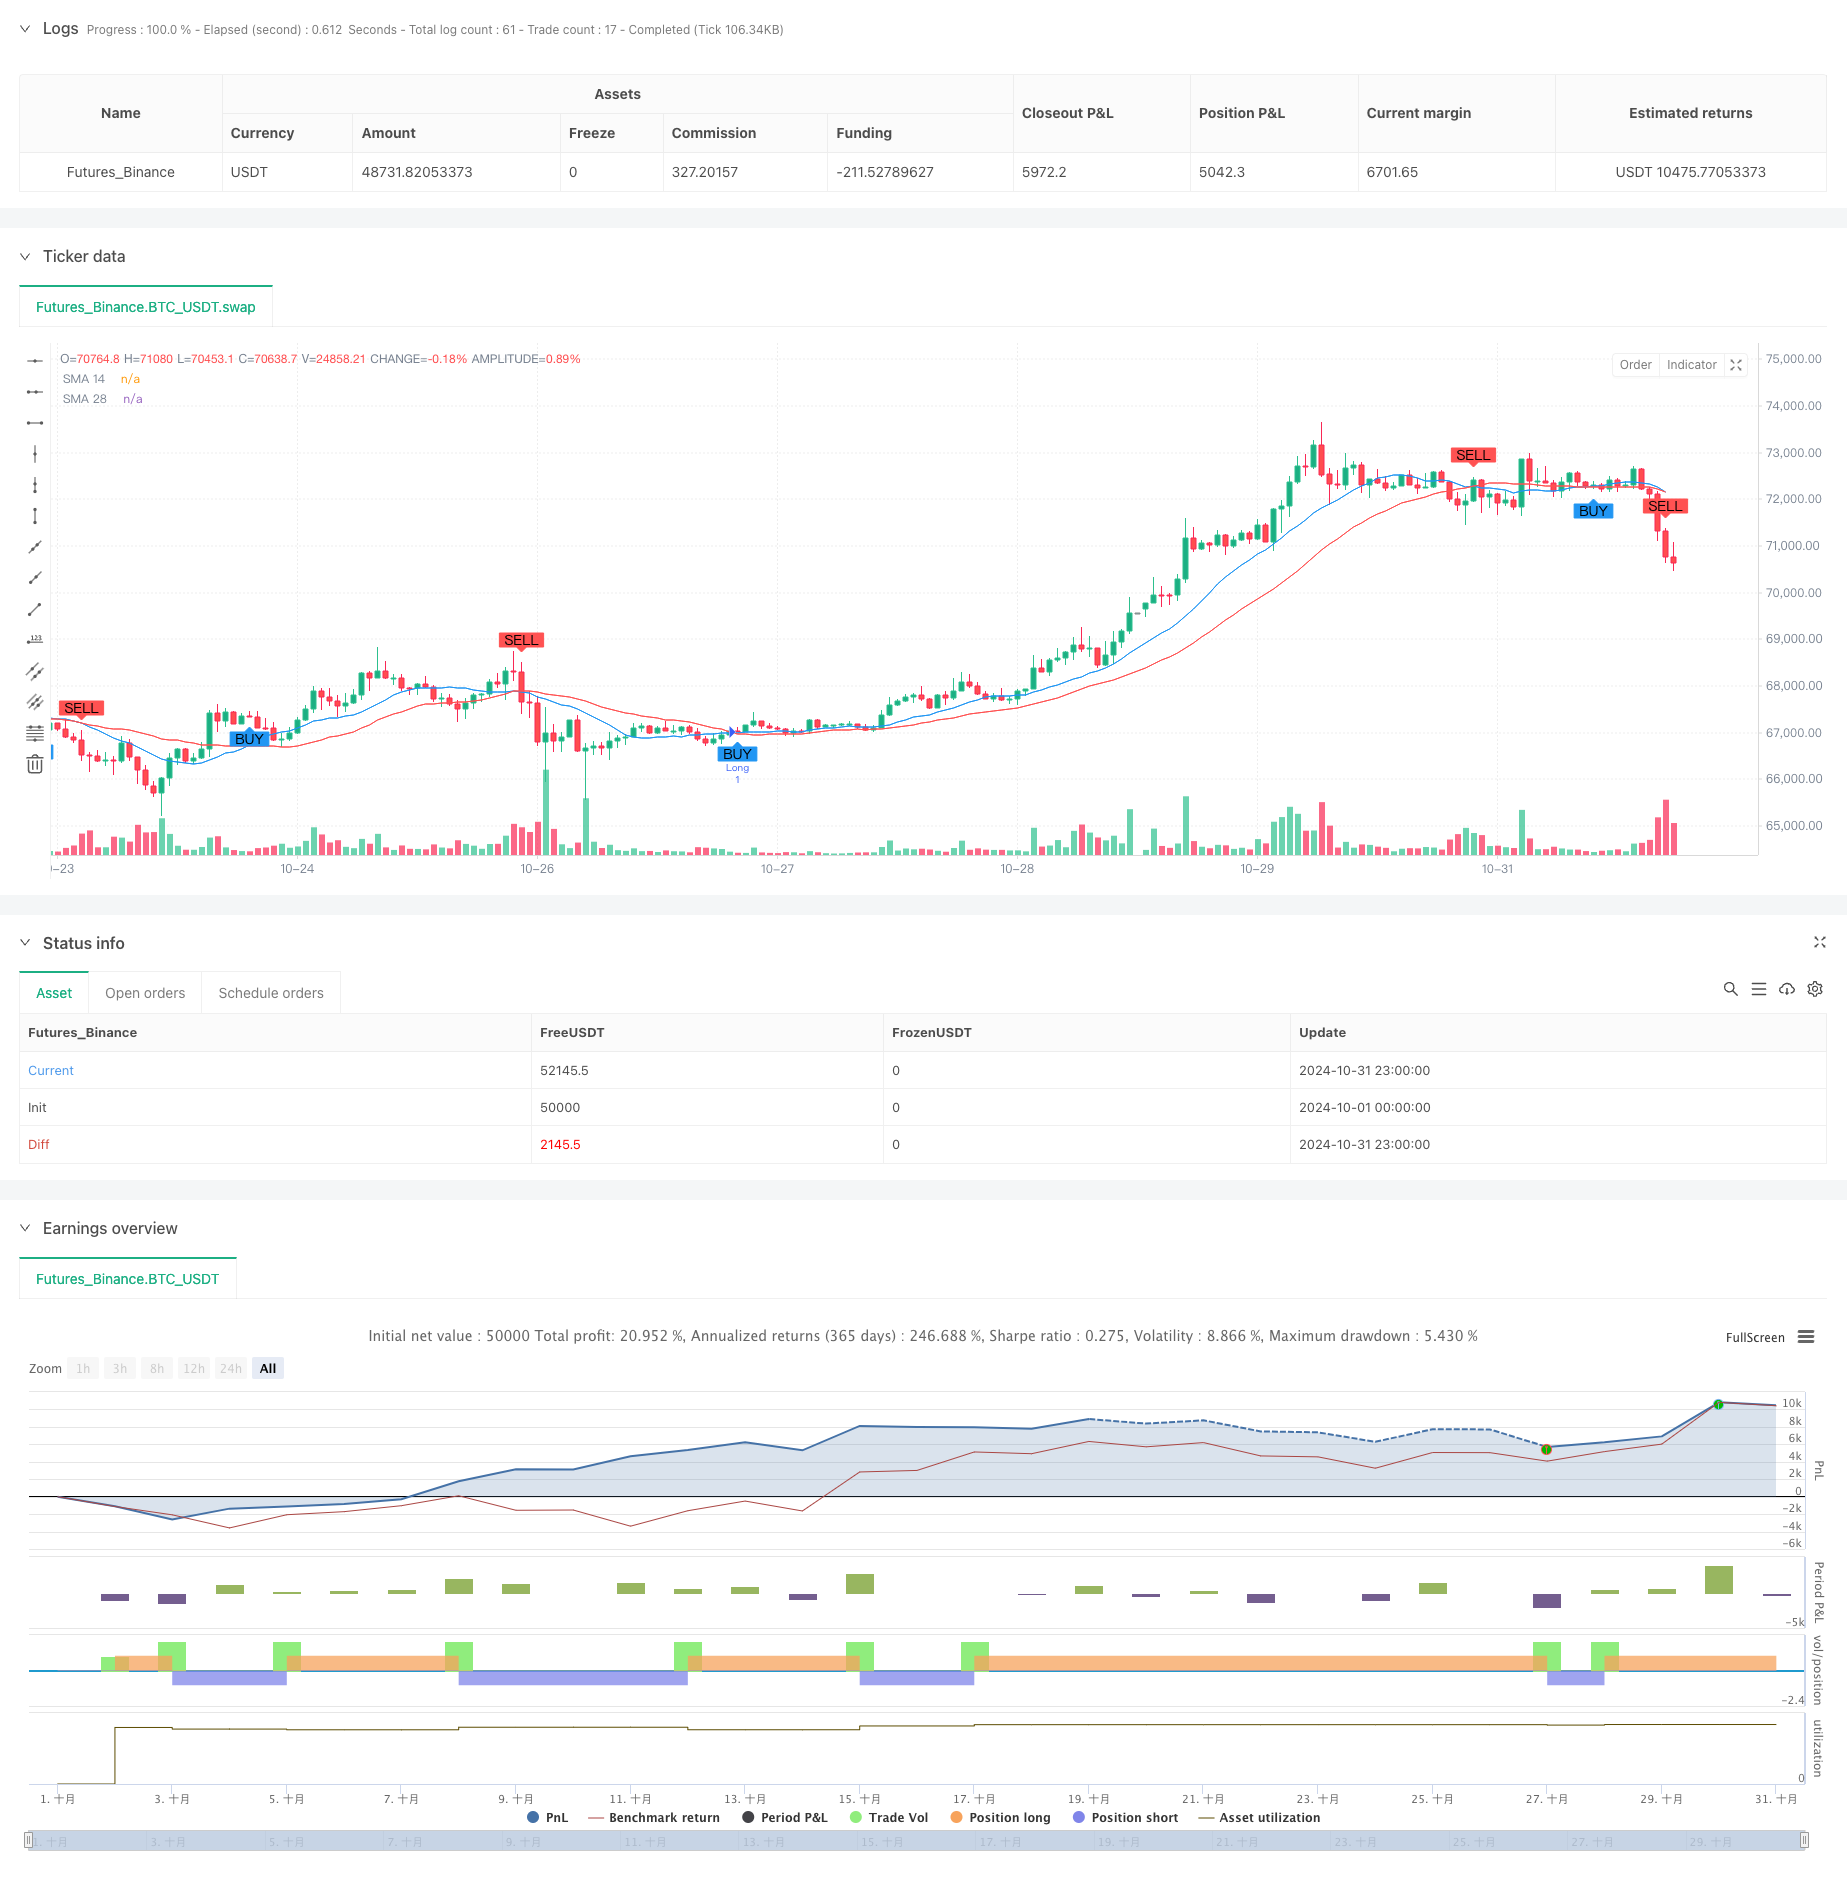
[trans]
概述
这是一个基于双均线交叉信号的自适应型交易策略。该策略利用14周期和28周期的简单移动平均线(SMA)生成交易信号,并结合了可调节的止损和止盈机制,实现了风险收益的平衡管理。策略采用固定资金管理方式,初始资金2000,每次交易投入200。
策略原理
策略的核心逻辑基于两条不同周期的简单移动平均线之间的交叉关系。当短期(14周期)均线向上穿越长期(28周期)均线时,产生做多信号;当短期均线向下穿越长期均线时,产生做空信号。同时,策略引入了基于百分比的止损和止盈机制,分别设置为2%和4%,这种设计可以根据市场价格自动调整止损和止盈位置。
策略优势
- 信号明确性:利用均线交叉产生的信号清晰直观,避免了主观判断。
- 风险控制完善:通过百分比方式设置的止损止盈位置,能够随着市场价格自动调整,更好地适应不同市场环境。
- 资金管理合理:采用固定资金分配方式,避免了过度杠杆带来的风险。
- 可视化效果好:策略在图表上展示了交易信号和均线走势,便于交易者理解和监控。
- 参数可调性强:止损止盈参数可以根据不同市场环境和个人风险偏好进行调整。
策略风险
- 震荡市场风险:在横盘震荡市场中,均线频繁交叉可能导致假信号增多。
- 滑点风险:在市场波动较大时,实际成交价格可能与信号价格存在偏差。
- 止损幅度固定:虽然止损位置会随价格变动,但固定的百分比可能不适合所有市场环境。
- 资金利用效率:固定资金分配方式可能在某些情况下造成资金利用效率不高。
策略优化方向
- 引入趋势过滤器:可以添加额外的趋势判断指标,如MACD或RSI,以减少假信号。
- 动态止损机制:可以根据市场波动率动态调整止损比例,提高策略的适应性。
- 优化资金管理:可以引入基于波动率的仓位管理方法,提高资金利用效率。
- 增加时间过滤:可以添加交易时间段限制,避开波动较大的时间段。
- 引入回撤控制:可以设置最大回撤限制,当达到特定回撤时暂停交易。
总结
这是一个结构清晰、逻辑严谨的交易策略。通过双均线交叉提供交易信号,配合自适应的止损止盈机制,实现了交易机会的捕捉和风险的控制。虽然策略存在一些优化空间,但整体设计符合量化交易的基本原则。通过建议的优化方向,策略的稳定性和盈利能力有望得到进一步提升。 ||
Overview
This is an adaptive trading strategy based on dual moving average crossover signals. The strategy utilizes 14-period and 28-period Simple Moving Averages (SMA) to generate trading signals, combined with adjustable stop-loss and take-profit mechanisms to achieve balanced risk-reward management. The strategy employs fixed money management with an initial capital of 2000 and 200 per trade.
Strategy Principles
The core logic is based on the crossover relationship between two SMAs of different periods. A long signal is generated when the short-term (14-period) MA crosses above the long-term (28-period) MA, and a short signal is generated when the short-term MA crosses below the long-term MA. The strategy incorporates percentage-based stop-loss and take-profit mechanisms set at 2% and 4% respectively, allowing for automatic adjustment of exit points based on market prices.
Strategy Advantages
- Clear Signals: The moving average crossover provides clear and objective signals, eliminating subjective judgment.
- Robust Risk Control: The percentage-based stop-loss and take-profit levels automatically adjust with market prices, adapting to different market conditions.
- Rational Money Management: The fixed allocation approach prevents risks associated with excessive leverage.
- Good Visualization: The strategy displays trading signals and moving average trends on the chart, facilitating understanding and monitoring.
- Flexible Parameters: Stop-loss and take-profit parameters can be adjusted according to different market conditions and personal risk preferences.
Strategy Risks
- Choppy Market Risk: Frequent crossovers during sideways markets may generate false signals.
- Slippage Risk: During high volatility periods, actual execution prices may deviate from signal prices.
- Fixed Stop-Loss Range: Although stop-loss points adjust with price, the fixed percentage may not suit all market conditions.
- Capital Efficiency: Fixed money allocation might lead to suboptimal capital utilization in certain scenarios.
Strategy Optimization Directions
- Implement Trend Filters: Add additional trend indicators like MACD or RSI to reduce false signals.
- Dynamic Stop-Loss Mechanism: Adjust stop-loss percentages based on market volatility for better adaptability.
- Optimize Money Management: Introduce volatility-based position sizing to improve capital efficiency.
- Add Time Filters: Implement trading time restrictions to avoid highly volatile periods.
- Incorporate Drawdown Control: Set maximum drawdown limits to pause trading when specific thresholds are reached.
Summary
This is a well-structured and logically sound trading strategy. It captures trading opportunities through dual moving average crossovers while controlling risks with adaptive stop-loss and take-profit mechanisms. While there is room for optimization, the overall design adheres to fundamental quantitative trading principles. Through the suggested optimization directions, the strategy's stability and profitability potential can be further enhanced.[/trans]
Source (PineScript)
/*backtest
start: 2024-10-01 00:00:00
end: 2024-10-31 23:59:59
period: 1h
basePeriod: 1h
exchanges: [{"eid":"Futures_Binance","currency":"BTC_USDT"}]
*/

//@version=5
strategy('My Custom Strategy', overlay = true)

// Parámetros de las SMAs (Medias Móviles Simples)
sma14 = ta.sma(close, 14)
sma28 = ta.sma(close, 28)

// Stop Loss y Take Profit configurables
stop_loss_percent = input.float(2, title="Stop Loss %", minval=0.1, step=0.1)
take_profit_percent = input.float(4, title="Take Profit %", minval=0.1, step=0.1)

// Cálculo de stop loss y take profit
stop_loss = close * (1 - stop_loss_percent / 100)
take_profit = close * (1 + take_profit_percent / 100)

// Condiciones de entrada para compra (long)
longCondition = ta.crossover(sma14, sma28)
if (longCondition)
    strategy.entry('Long', strategy.long, stop=stop_loss, limit=take_profit)
plotshape(series=longCondition, color=color.new(color.blue, 0), style=shape.labelup, location=location.belowbar, text="BUY")

// Condiciones de entrada para venta (short)
shortCondition = ta.crossunder(sma14, sma28)
if (shortCondition)
    strategy.entry('Short', strategy.short, stop=stop_loss, limit=take_profit)
plotshape(series=shortCondition, color=color.new(color.red, 0), style=shape.labeldown, location=location.abovebar, text="SELL")

// Visualización de las SMAs en el gráfico
plot(sma14, color=color.blue, title="SMA 14")
plot(sma28, color=color.red, title="SMA 28")
Detail
https://www.fmz.com/strategy/473135
Last Modified
2024-11-27 15:05:02