
14 KiB
Name
双均线交叉带止盈止损的自适应量化交易策略-Adaptive-Quantitative-Trading-Strategy-with-Dual-Moving-Average-Crossover-and-Take-Profit-Stop-Loss
Author
ChaoZhang
Strategy Description
[trans]
概述
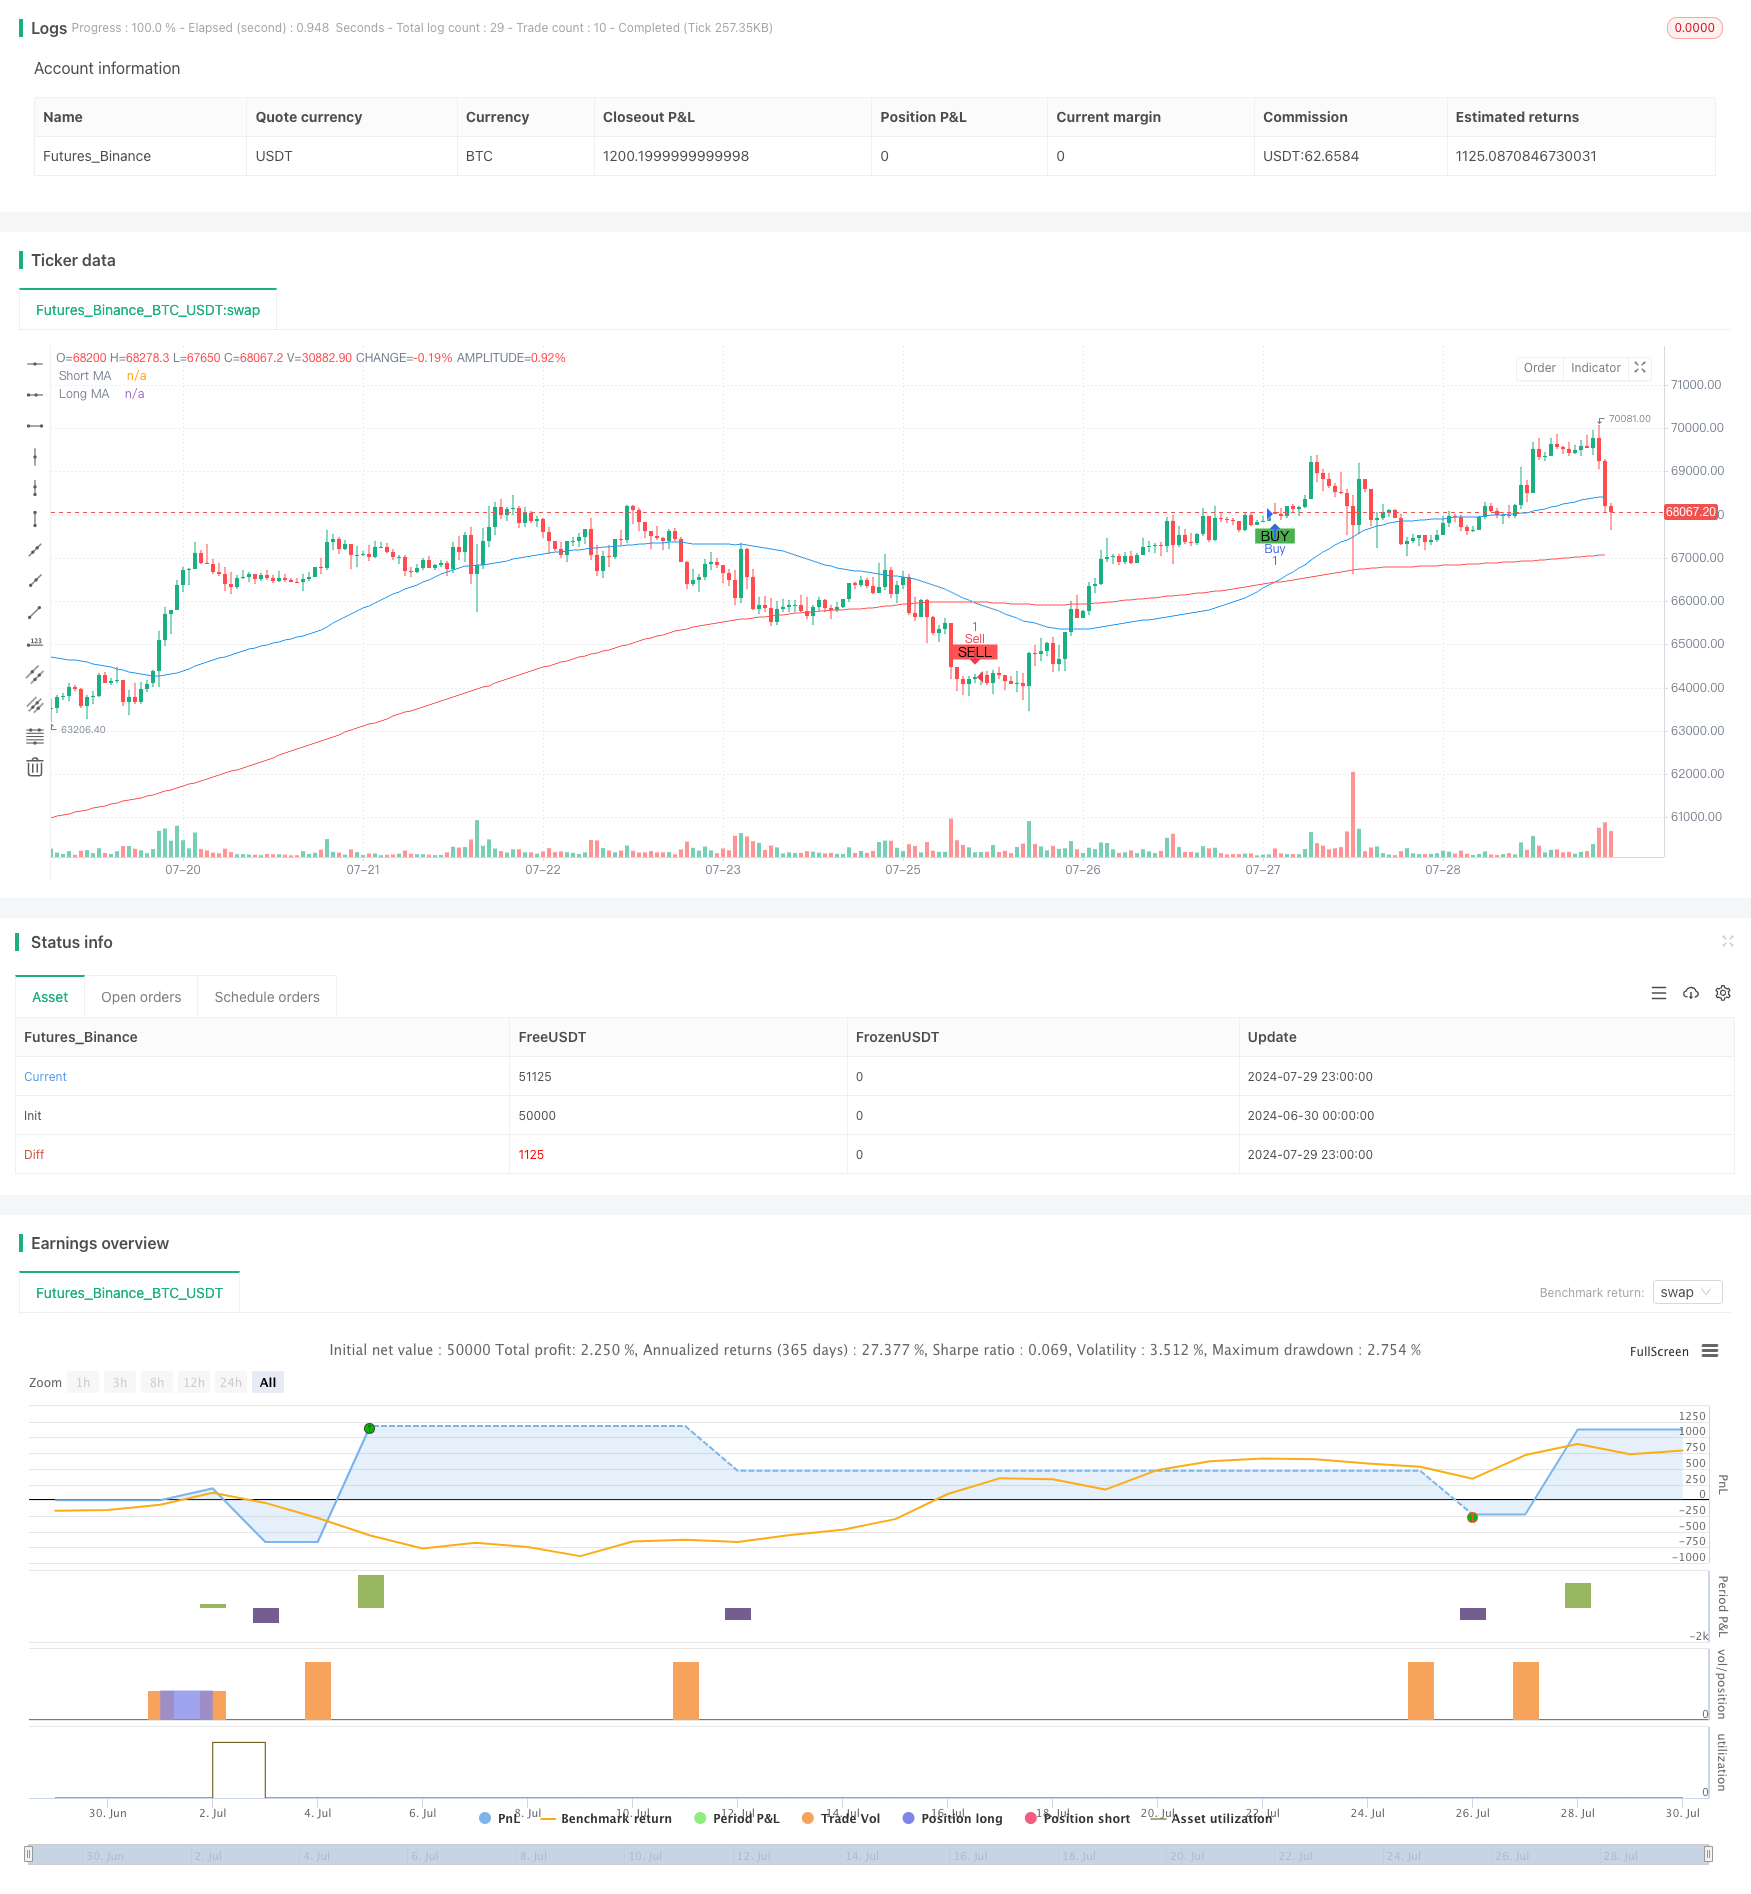
本策略是一个基于双均线交叉的量化交易系统,结合了移动平均线(MA)、止盈(TP)和止损(SL)等多种技术指标。策略的核心思想是利用短期和长期移动平均线的交叉来判断市场趋势,并在此基础上进行交易决策。同时,策略还引入了止盈和止损机制,以控制风险和锁定利润。这种方法旨在捕捉市场趋势的变化,同时提供风险管理的手段,使其成为一个相对全面的交易系统。
策略原理
-
双均线交叉:策略使用两条不同周期的简单移动平均线(SMA),分别是50周期和200周期。当短期均线(50周期)向上穿越长期均线(200周期)时,产生买入信号;反之,当短期均线向下穿越长期均线时,产生卖出信号。
-
交易执行:在买入信号出现时,策略会开立多头仓位;在卖出信号出现时,策略会平掉多头仓位并开立空头仓位。这种方法允许策略在不同市场环境下灵活操作。
-
止盈止损:策略为每笔交易设置了百分比的止盈和止损点位。止盈点位设置为入场价格的2%,止损点位设置为入场价格的1%。这种机制有助于控制风险和保护利润。
-
图形化展示:策略在图表上绘制了短期和长期移动平均线,并用不同颜色标记买卖信号,同时添加了文字标签提示交易方向,增强了策略的可视化效果。
策略优势
-
趋势跟随:通过使用双均线交叉,策略能够有效捕捉市场趋势的变化,适应不同的市场环境。
-
风险管理:内置的止盈止损机制为每笔交易提供了风险控制,有助于限制潜在损失并锁定利润。
-
自适应性:策略允许用户自定义均线周期、止盈和止损比例,使其能够适应不同的交易品种和市场条件。
-
可视化效果:通过在图表上直观展示交易信号和均线,策略提高了交易决策的透明度和可理解性。
-
全面性:策略既能开立多头位置,也能开立空头位置,充分利用了市场的双向机会。
策略风险
-
震荡市场风险:在横盘或震荡市场中,双均线交叉策略可能产生频繁的假信号,导致过度交易和不必要的损失。
-
滞后性:移动平均线本质上是滞后指标,可能在趋势转折点错过最佳入场或出场时机。
-
固定止盈止损风险:使用固定百分比的止盈止损可能不适合所有市场条件,在某些情况下可能过早止盈或止损。
-
过度依赖技术指标:策略完全依赖于技术指标,忽视了基本面因素,可能在重大新闻或事件影响市场时表现不佳。
-
参数敏感性:策略的表现高度依赖于所选择的参数,如均线周期和止盈止损比例,不当的参数设置可能导致策略表现不佳。
策略优化方向
-
动态止盈止损:考虑引入基于市场波动性的动态止盈止损机制,如使用ATR(Average True Range)指标来调整止盈止损点位,以适应不同的市场条件。
-
增加过滤器:引入额外的技术指标作为过滤器,如RSI(相对强弱指数)或MACD(移动平均收敛散度),以减少假信号和提高入场质量。
-
时间框架分析:考虑在多个时间框架上应用策略,以获得更全面的市场视角和更可靠的交易信号。
-
量化回测:进行全面的历史数据回测,优化参数设置,并评估策略在不同市场环境下的表现。
-
结合基本面分析:考虑引入基本面因素,如经济数据发布或重大事件,作为交易决策的辅助依据。
-
仓位管理:实现更复杂的仓位管理策略,如基于账户净值和市场波动性动态调整交易规模。
-
机器学习优化:考虑使用机器学习算法来优化参数选择和信号生成过程,提高策略的适应性和性能。
总结
双均线交叉带止盈止损的自适应量化交易策略是一个基于技术分析的全面交易系统。它利用移动平均线的交叉来捕捉市场趋势,并通过止盈止损机制来管理风险。该策略的优势在于其简单性、可视化效果和风险管理能力。然而,它也面临着在震荡市场中可能产生假信号、指标滞后性等挑战。
通过引入动态止盈止损、多重技术指标过滤、多时间框架分析等优化方向,该策略有潜力进一步提升其性能和适应性。同时,结合基本面分析和应用机器学习技术可能会带来更好的交易结果。
总的来说,这个策略为交易者提供了一个可靠的起点,但仍需要根据个人风险偏好和市场条件进行持续的优化和调整。在实际交易中,建议进行充分的回测和模拟交易,以确保策略在实际市场环境中的有效性。
||
Overview
This strategy is a quantitative trading system based on dual moving average crossover, combining multiple technical indicators such as Moving Averages (MA), Take Profit (TP), and Stop Loss (SL). The core idea of the strategy is to use the crossover of short-term and long-term moving averages to judge market trends and make trading decisions accordingly. Additionally, the strategy incorporates take profit and stop loss mechanisms to control risk and lock in profits. This approach aims to capture changes in market trends while providing risk management tools, making it a relatively comprehensive trading system.
Strategy Principles
-
Dual Moving Average Crossover: The strategy uses two Simple Moving Averages (SMA) of different periods, specifically 50-period and 200-period. When the short-term MA (50-period) crosses above the long-term MA (200-period), it generates a buy signal; conversely, when the short-term MA crosses below the long-term MA, it generates a sell signal.
-
Trade Execution: The strategy opens a long position when a buy signal appears and closes the long position and opens a short position when a sell signal appears. This method allows the strategy to operate flexibly in different market environments.
-
Take Profit and Stop Loss: The strategy sets percentage-based take profit and stop loss levels for each trade. The take profit level is set at 2% of the entry price, while the stop loss is set at 1% of the entry price. This mechanism helps control risk and protect profits.
-
Graphical Display: The strategy plots short-term and long-term moving averages on the chart, marks buy and sell signals with different colors, and adds text labels indicating trading direction, enhancing the strategy's visualization.
Strategy Advantages
-
Trend Following: By using dual moving average crossover, the strategy can effectively capture changes in market trends and adapt to different market environments.
-
Risk Management: The built-in take profit and stop loss mechanism provides risk control for each trade, helping to limit potential losses and lock in profits.
-
Adaptability: The strategy allows users to customize moving average periods, take profit, and stop loss percentages, making it adaptable to different trading instruments and market conditions.
-
Visualization: By visually displaying trading signals and moving averages on the chart, the strategy improves the transparency and comprehensibility of trading decisions.
-
Comprehensiveness: The strategy can open both long and short positions, fully utilizing bidirectional market opportunities.
Strategy Risks
-
Sideways Market Risk: In sideways or choppy markets, the dual moving average crossover strategy may produce frequent false signals, leading to overtrading and unnecessary losses.
-
Lag: Moving averages are inherently lagging indicators, which may miss optimal entry or exit points at trend reversal points.
-
Fixed Take Profit and Stop Loss Risk: Using fixed percentage take profit and stop loss may not be suitable for all market conditions and might lead to premature profit-taking or stopping out in some cases.
-
Over-reliance on Technical Indicators: The strategy relies entirely on technical indicators, ignoring fundamental factors, which may underperform when significant news or events affect the market.
-
Parameter Sensitivity: The strategy's performance is highly dependent on the chosen parameters, such as moving average periods and take profit/stop loss percentages. Improper parameter settings may lead to poor strategy performance.
Strategy Optimization Directions
-
Dynamic Take Profit and Stop Loss: Consider introducing a dynamic take profit and stop loss mechanism based on market volatility, such as using the Average True Range (ATR) indicator to adjust take profit and stop loss levels to adapt to different market conditions.
-
Additional Filters: Introduce additional technical indicators as filters, such as RSI (Relative Strength Index) or MACD (Moving Average Convergence Divergence), to reduce false signals and improve entry quality.
-
Multi-Timeframe Analysis: Consider applying the strategy across multiple timeframes to gain a more comprehensive market perspective and more reliable trading signals.
-
Quantitative Backtesting: Conduct comprehensive historical data backtesting to optimize parameter settings and evaluate strategy performance under different market conditions.
-
Incorporate Fundamental Analysis: Consider incorporating fundamental factors, such as economic data releases or significant events, as auxiliary bases for trading decisions.
-
Position Management: Implement more sophisticated position management strategies, such as dynamically adjusting trade size based on account equity and market volatility.
-
Machine Learning Optimization: Consider using machine learning algorithms to optimize parameter selection and signal generation processes, improving strategy adaptability and performance.
Summary
The Adaptive Quantitative Trading Strategy with Dual Moving Average Crossover and Take Profit/Stop Loss is a comprehensive trading system based on technical analysis. It utilizes moving average crossovers to capture market trends and manages risk through take profit and stop loss mechanisms. The strategy's strengths lie in its simplicity, visualization, and risk management capabilities. However, it also faces challenges such as potentially generating false signals in choppy markets and indicator lag.
By introducing optimizations such as dynamic take profit and stop loss, multiple technical indicator filters, and multi-timeframe analysis, the strategy has the potential to further improve its performance and adaptability. Additionally, incorporating fundamental analysis and applying machine learning techniques may lead to better trading results.
Overall, this strategy provides traders with a reliable starting point but still requires continuous optimization and adjustment based on individual risk preferences and market conditions. In actual trading, it is recommended to conduct thorough backtesting and simulated trading to ensure the strategy's effectiveness in real market environments.
[/trans]
Source (PineScript)
/*backtest
start: 2024-06-30 00:00:00
end: 2024-07-30 00:00:00
period: 1h
basePeriod: 15m
exchanges: [{"eid":"Futures_Binance","currency":"BTC_USDT"}]
*/

//@version=5
strategy("Moving Average Crossover Strategy with TP/SL", overlay=true)

// Пользовательские входы
short_ma_length = input.int(50, title="Short MA Length", minval=1)
long_ma_length = input.int(200, title="Long MA Length", minval=1)
take_profit_perc = input.float(2.0, title="Take Profit (%)", minval=0.1)
stop_loss_perc = input.float(1.0, title="Stop Loss (%)", minval=0.1)

// Вычисление скользящих средних
short_ma = ta.sma(close, short_ma_length)
long_ma = ta.sma(close, long_ma_length)

// Отображение скользящих средних
plot(short_ma, color=color.blue, title="Short MA")
plot(long_ma, color=color.red, title="Long MA")

// Сигналы на покупку и продажу
buy_signal = ta.crossover(short_ma, long_ma)
sell_signal = ta.crossunder(short_ma, long_ma)

// Отображение сигналов на графике
plotshape(series=buy_signal, location=location.belowbar, color=color.green, style=shape.labelup, title="Buy Signal", text="BUY")
plotshape(series=sell_signal, location=location.abovebar, color=color.red, style=shape.labeldown, title="Sell Signal", text="SELL")

// Добавление текстовых меток на график
if (buy_signal)
    label.new(bar_index, low, "Вставай в лонг", style=label.style_label_up, color=color.green, textcolor=color.white)
if (sell_signal)
    label.new(bar_index, high, "Вставай в шорт", style=label.style_label_down, color=color.red, textcolor=color.white)

// Условный трейдинг (для стратегии)
if (buy_signal)
    // Открытие длинной позиции при пересечении краткосрочной MA вверх через долгосрочную MA
    strategy.entry("Buy", strategy.long)

if (sell_signal)
    // Закрытие длинной позиции при пересечении краткосрочной MA вниз через долгосрочную MA
    strategy.close("Buy")

    // Открытие короткой позиции при пересечении краткосрочной MA вниз через долгосрочную MA
    strategy.entry("Sell", strategy.short)

// Применение тейк-профита и стоп-лосса для длинной позиции
if (strategy.position_size > 0 and strategy.position_avg_price > 0)
    long_tp_price = strategy.position_avg_price * (1 + take_profit_perc / 100)
    long_sl_price = strategy.position_avg_price * (1 - stop_loss_perc / 100)
    strategy.exit("Take Profit/Stop Loss", from_entry="Buy", limit=long_tp_price, stop=long_sl_price)

// Применение тейк-профита и стоп-лосса для короткой позиции
if (strategy.position_size < 0 and strategy.position_avg_price > 0)
    short_tp_price = strategy.position_avg_price * (1 - take_profit_perc / 100)
    short_sl_price = strategy.position_avg_price * (1 + stop_loss_perc / 100)
    strategy.exit("Take Profit/Stop Loss", from_entry="Sell", limit=short_tp_price, stop=short_sl_price)
Detail
https://www.fmz.com/strategy/458247
Last Modified
2024-07-31 11:41:40