
7.3 KiB
Name
双均线交叉动态优化量化交易策略-Dynamic-Dual-Moving-Average-Crossover-Quantitative-Trading-Strategy
Author
ChaoZhang
Strategy Description
[trans]
概述
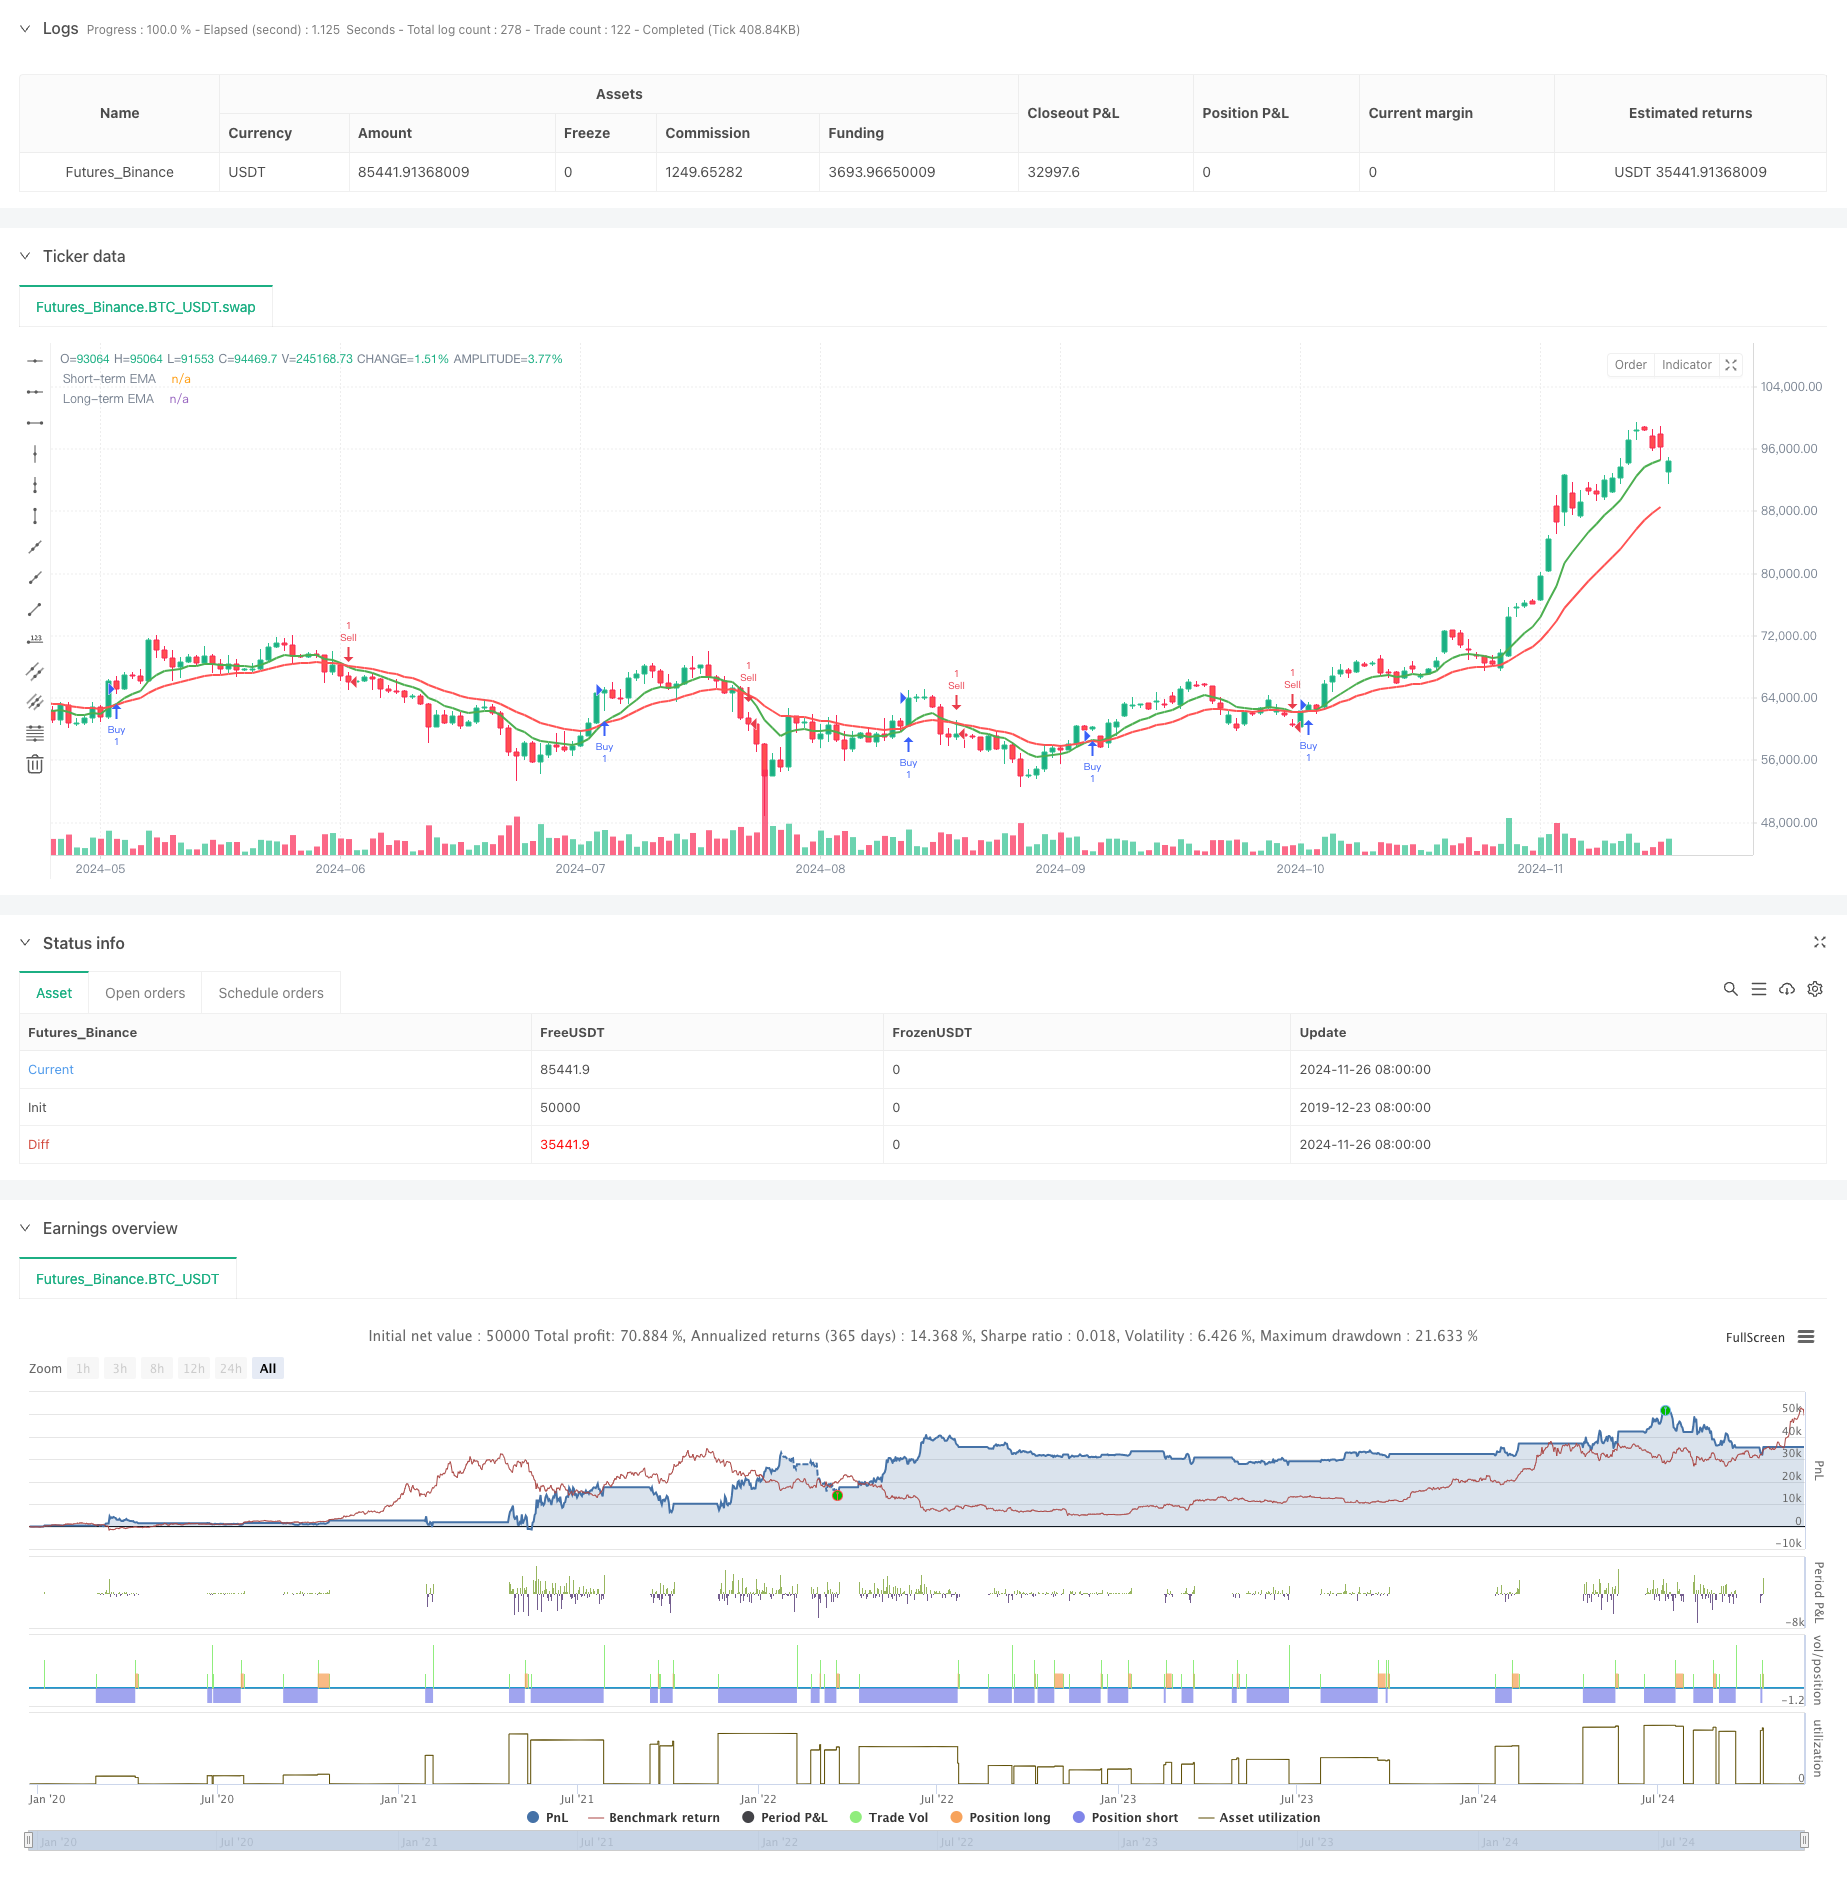
这是一个基于EMA指标的量化交易策略,通过计算短期(9周期)和长期(21周期)指数移动平均线的交叉信号来进行交易决策。策略设置了止损和止盈条件,分别为2%和4%,以控制风险和锁定利润。该策略的核心思想是利用均线交叉捕捉市场趋势的转折点,从而在市场趋势发生改变时及时进行买卖操作。
策略原理
策略采用了两条不同周期的指数移动平均线(EMA),分别是9周期和21周期。当短期EMA向上穿越长期EMA时,产生买入信号;当短期EMA向下穿越长期EMA时,产生卖出信号。策略还包含了风险管理机制,通过设置2%的止损和4%的止盈来保护资金安全和锁定收益。短期均线对价格变化较为敏感,而长期均线则能够反映更长期的趋势,两者的交叉能够较好地捕捉市场趋势的转换点。
策略优势
- 操作规则明确,信号清晰,易于执行和回测
- 通过设置止损和止盈,有效控制风险
- 能够自动适应市场波动,无需人工干预
- 计算简单,执行效率高
- 可以应用于不同的时间周期和市场环境
- 代码结构清晰,易于维护和优化
- 具有良好的可扩展性,可以加入其他技术指标进行优化
策略风险
- 震荡市场中可能产生频繁的假突破信号
- 均线具有滞后性,可能错过一些重要的市场拐点
- 固定的止损止盈参数可能不适合所有市场环境
- 没有考虑交易成本,实际收益可能低于回测结果
- 在剧烈波动的市场中,可能触发频繁的止损
- 没有考虑市场流动性风险
- 缺乏对市场宏观环境的考虑
策略优化方向
- 引入波动率指标,动态调整止损止盈参数
- 增加成交量指标,提高信号的可靠性
- 加入趋势确认指标,如RSI或MACD
- 根据不同市场环境动态调整均线周期
- 增加位置管理机制,实现资金的动态分配
- 加入市场环境判断机制,在不同市场条件下采用不同的参数
- 增加交易成本的考虑,优化交易频率
总结
该策略是一个经典的趋势跟踪策略,通过均线交叉捕捉市场趋势变化。虽然策略设计相对简单,但包含了完整的交易逻辑和风险控制机制。通过增加动态参数调整、市场环境判断等优化措施,可以进一步提高策略的稳定性和收益性。在实际应用中,建议根据具体的交易品种和市场环境进行参数优化,并注意控制风险。
||
Overview
This is a quantitative trading strategy based on the EMA indicator, which makes trading decisions by calculating the crossover signals of short-term (9-period) and long-term (21-period) exponential moving averages. The strategy includes stop-loss and take-profit conditions set at 2% and 4% respectively to control risk and lock in profits. The core idea is to capture market trend turning points through moving average crossovers, enabling timely buy and sell operations when market trends change.
Strategy Principles
The strategy employs two exponential moving averages (EMA) with different periods: 9-period and 21-period. A buy signal is generated when the short-term EMA crosses above the long-term EMA, while a sell signal is triggered when the short-term EMA crosses below the long-term EMA. The strategy incorporates risk management mechanisms through 2% stop-loss and 4% take-profit levels to protect capital and secure gains. The short-term moving average is more sensitive to price changes, while the long-term moving average reflects longer-term trends, making their crossovers effective in capturing market trend transitions.
Strategy Advantages
- Clear operational rules and signals, easy to execute and backtest
- Effective risk control through stop-loss and take-profit settings
- Automatically adapts to market volatility without manual intervention
- Simple calculations with high execution efficiency
- Applicable to different time periods and market environments
- Clear code structure, easy to maintain and optimize
- Good scalability, can incorporate additional technical indicators for optimization
Strategy Risks
- May generate frequent false breakout signals in choppy markets
- Moving averages have inherent lag, potentially missing important market turning points
- Fixed stop-loss and take-profit parameters may not suit all market conditions
- Trading costs not considered, actual returns may be lower than backtest results
- Frequent stop-losses may be triggered in highly volatile markets
- Market liquidity risk not addressed
- Lack of consideration for macro market conditions
Strategy Optimization Directions
- Introduce volatility indicators for dynamic adjustment of stop-loss and take-profit parameters
- Add volume indicators to improve signal reliability
- Incorporate trend confirmation indicators like RSI or MACD
- Dynamically adjust moving average periods based on market conditions
- Add position management mechanisms for dynamic capital allocation
- Implement market condition assessment for parameter adjustment
- Consider trading costs and optimize trading frequency
Summary
This strategy is a classic trend-following approach that captures market trend changes through moving average crossovers. While relatively simple in design, it includes complete trading logic and risk control mechanisms. The strategy's stability and profitability can be further enhanced through optimization measures such as dynamic parameter adjustment and market condition assessment. In practical application, it is recommended to optimize parameters based on specific trading instruments and market conditions while maintaining proper risk control.[/trans]
Source (PineScript)
/*backtest
start: 2019-12-23 08:00:00
end: 2024-11-27 00:00:00
period: 1d
basePeriod: 1d
exchanges: [{"eid":"Futures_Binance","currency":"BTC_USDT"}]
*/

// This Pine Script™ code is subject to the terms of the Mozilla Public License 2.0 at https://mozilla.org/MPL/2.0/
// © ancour


//@version=5
strategy("Moving Average Crossover", overlay=true)

// Define the length for short-term and long-term EMAs
shortEmaLength = 9
longEmaLength = 21

// Calculate EMAs
shortEma = ta.ema(close, shortEmaLength)
longEma = ta.ema(close, longEmaLength)

// Plot EMAs on the chart
plot(shortEma, title="Short-term EMA", color=color.green, linewidth=2)
plot(longEma, title="Long-term EMA", color=color.red, linewidth=2)

// Strategy conditions for crossovers
longCondition = ta.crossover(shortEma, longEma)
shortCondition = ta.crossunder(shortEma, longEma)

// Enter long when short EMA crosses above long EMA
if (longCondition)
    strategy.entry("Buy", strategy.long)

// Exit long or enter short when short EMA crosses below long EMA
if (shortCondition)
    strategy.entry("Sell", strategy.short)

// Optional: Add stop-loss and take-profit levels for risk management
stopLossPercent = 2
takeProfitPercent = 4

strategy.exit("Sell TP/SL", "Buy", stop=low * (1 - stopLossPercent/100), limit=high * (1 + takeProfitPercent/100))
Detail
https://www.fmz.com/strategy/473268
Last Modified
2024-11-28 17:15:28