
15 KiB
Name
双均线交叉优化止损策略Dual-Moving-Average-Crossover-with-Optimized-Stop-Loss-Strategy
Author
ChaoZhang
Strategy Description
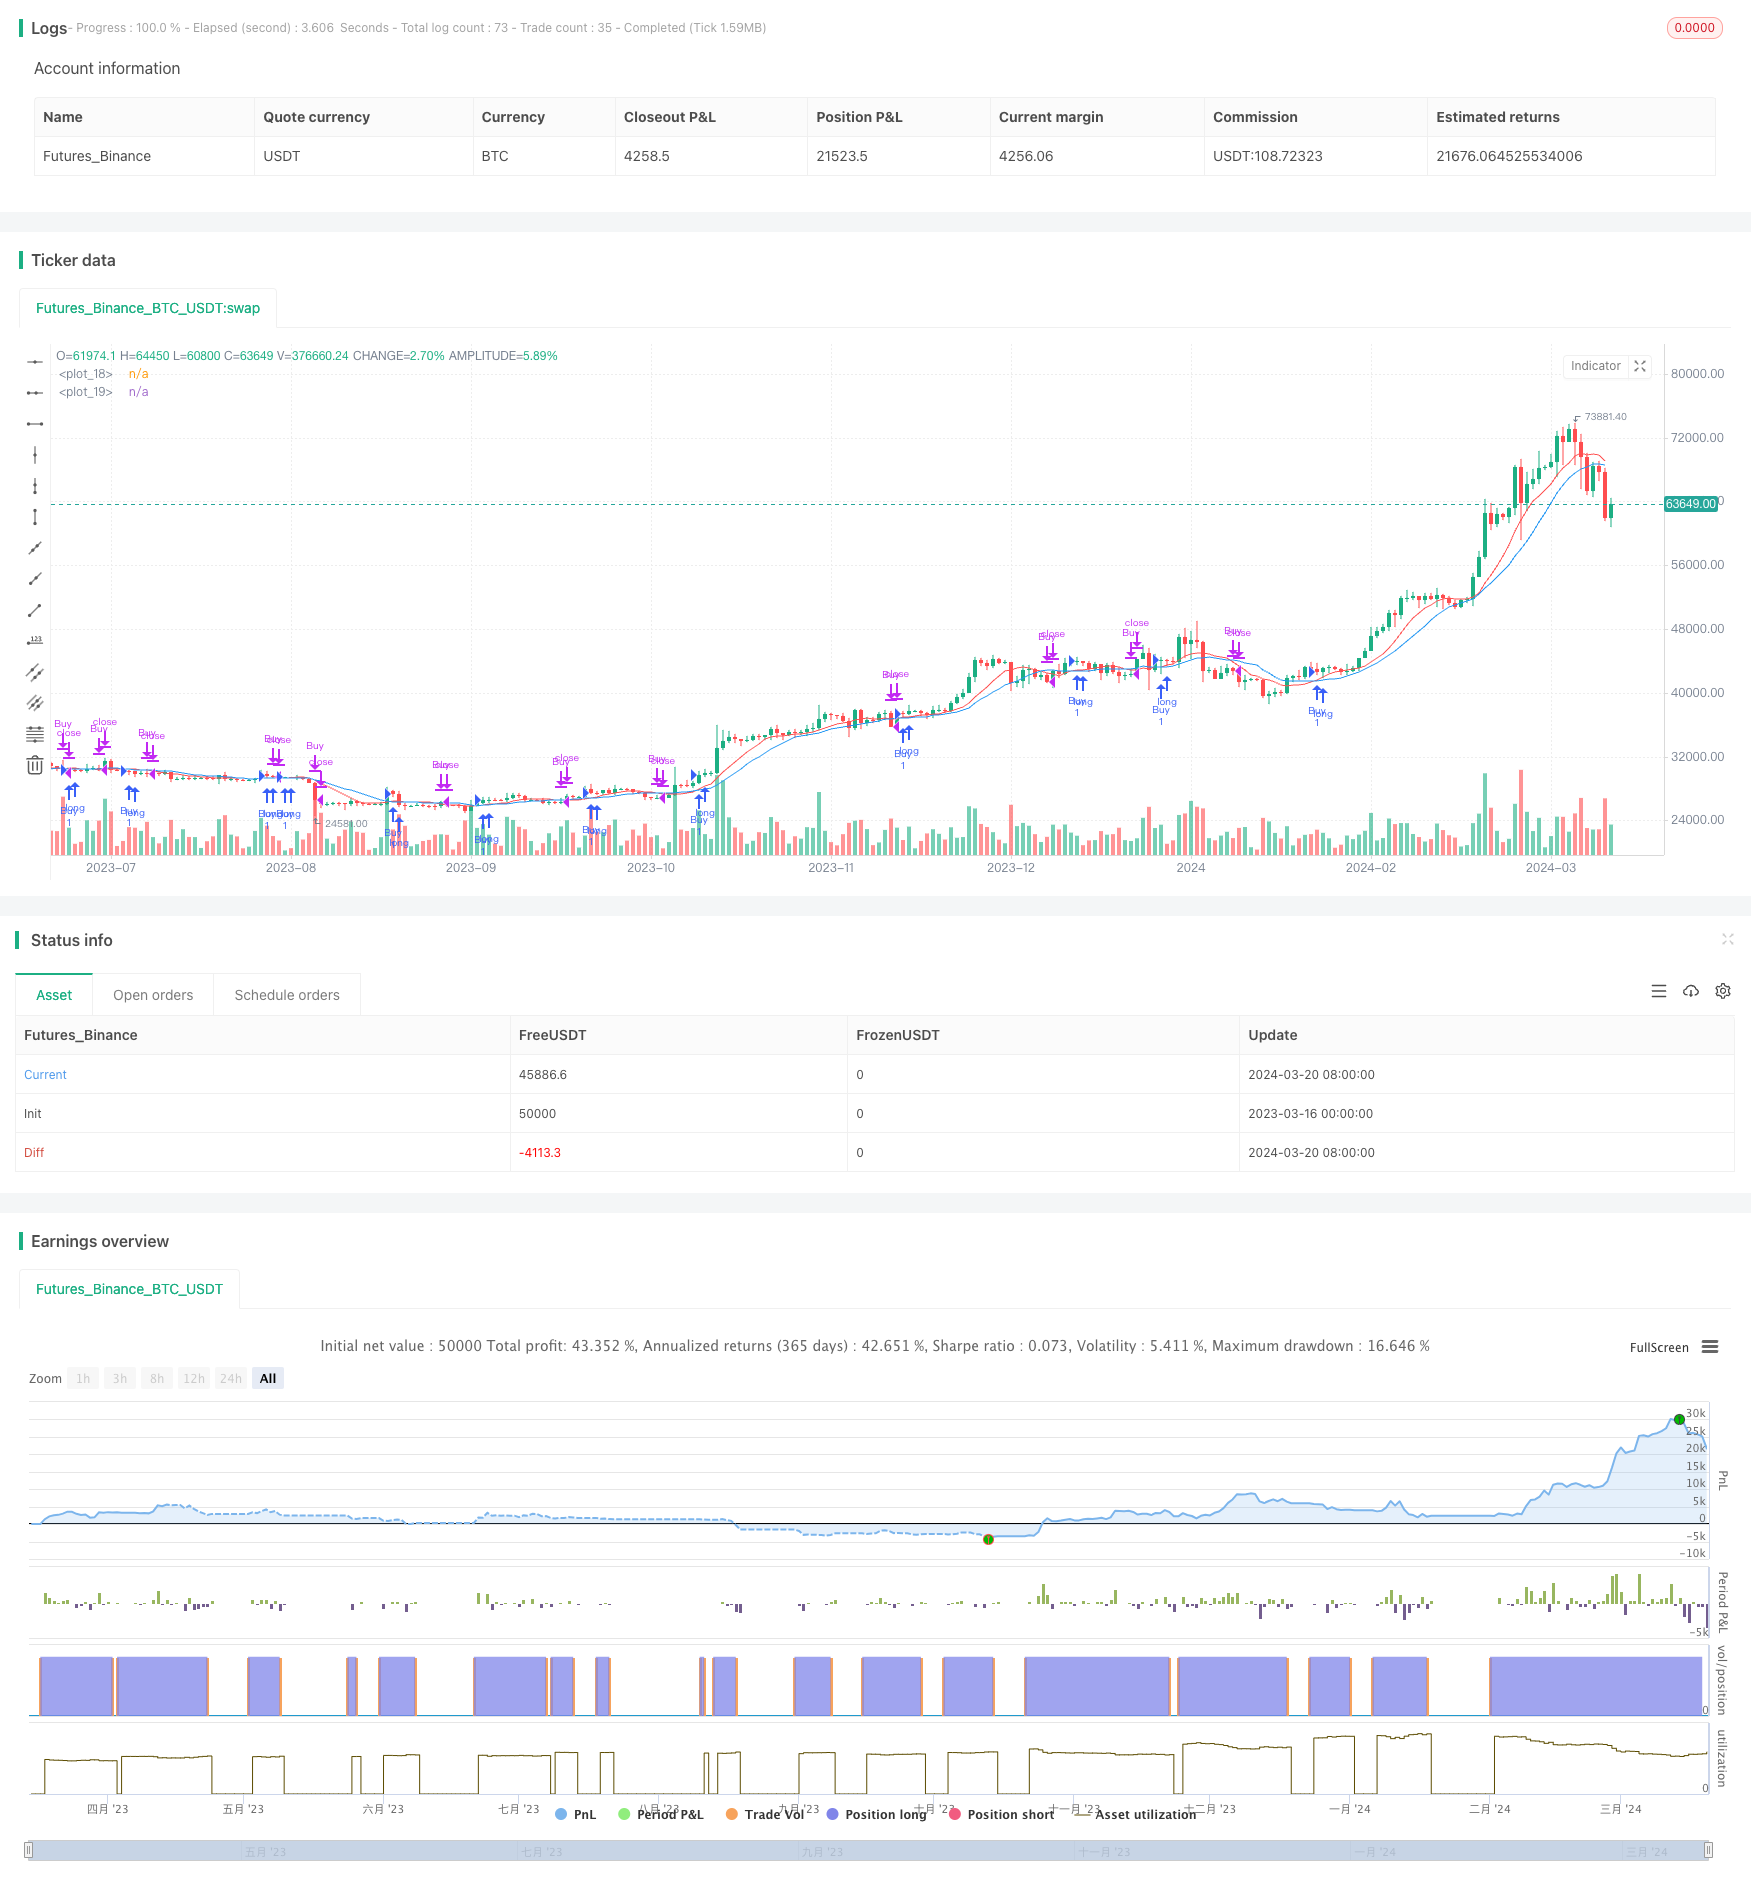 [trans]
策略概述
双均线交叉优化止损策略(TQQQ)是一种基于两条不同周期移动平均线(SMA)交叉信号的量化交易策略。该策略只做多,当快速均线上穿慢速均线时开仓,当快速均线下穿慢速均线或价格跌破止损价位时平仓。该策略通过参数优化快慢均线周期和止损比例,以期在牛市中获得更高的收益,同时在市场下跌时降低损失。
策略原理
该策略的核心是利用不同周期移动平均线的交叉信号来捕捉市场趋势。当短期均线上穿长期均线时,表明市场可能进入上升趋势,此时开仓做多。当短期均线下穿长期均线时,表明上升趋势可能结束,此时平仓。
除了均线交叉信号外,该策略还引入了止损机制。当市场价格跌破固定百分比的止损价位时,即使均线并未产生平仓信号,策略也会止损出场。这一机制的目的在于控制回撤,防止趋势反转时的巨大损失。
具体来看,该策略包含以下步骤:
- 计算快速均线和慢速均线。
- 判断是否存在开仓信号。当快速均线上穿慢速均线,且当前无持仓时,开仓做多。
- 记录开仓价格,计算止损价位。
- 判断是否存在平仓信号。当快速均线下穿慢速均线,或者价格跌破止损价位时,平掉所有多单。
- 根据收盘价判断下一交易日是否有开平仓机会,重复步骤2-4。
通过这一系列步骤,该策略能够快速适应市场趋势的变化,在牛市中紧跟趋势,获取丰厚利润,同时在市场转熊时及时止损,控制回撤。
策略优势
-
趋势跟踪:通过均线交叉信号,该策略能够捕捉市场趋势,在上升趋势中持仓,获取趋势收益。
-
止损机制:固定百分比止损可以有效控制回撤,避免单次交易的损失过大。
-
参数灵活:快慢均线的周期参数和止损比例可以根据市场特征和个人风险偏好进行调整,增加了策略的适应性。
-
适用性广:该策略可以应用于不同的市场和标的,如股票、期货、外汇等,只需根据标的特性调整参数即可。
-
简单高效:策略逻辑清晰,易于理解和实现,回测效率高,便于进行大量参数优化和模拟交易。
策略风险
-
参数敏感:均线周期和止损比例的选择对策略表现影响很大,不恰当的参数可能导致频繁交易或者错失趋势行情。
-
趋势识别滞后:均线交叉信号存在一定的滞后性,特别是在市场快速变化时,可能错过最佳开平仓时机。
-
仓位集中:该策略始终保持100%的仓位,缺乏仓位管理和资金分配机制,面临较大的资金风险。
-
震荡市行情不佳:在震荡市中,频繁的交叉信号可能导致策略损失。
-
黑天鹅事件:极端行情下,交易信号可能失效,固定止损比例可能无法覆盖实际风险。
针对以上风险,可以从以下方面进行优化和改进:
-
引入动态止损:根据市场波动率或价格水平动态调整止损比例,以应对不同的市场状况。
-
优化开平仓信号:结合其他技术指标如MACD、RSI等,提高趋势识别的准确性和及时性。
-
引入仓位管理:根据市场趋势强度、波动率等指标,动态调整仓位,控制回撤风险。
-
结合基本面分析:综合考虑宏观经济、行业景气度等因素,避免在基本面不利时交易。
-
设置总止损线:针对极端行情,设置账户级别的总止损线,控制资金风险。
策略优化
-
动态止损:引入ATR、布林带等指标,根据市场波动率动态调整止损比例,在趋势强烈时放宽止损,在震荡市加强止损。
-
信号优化:尝试不同的均线组合,如EMA、WMA等,寻找更敏感和有效的开平仓信号。同时,可以结合MACD、RSI等指标作为辅助判断。
-
仓位管理:根据ATR、ADX等指标衡量市场趋势强度,在趋势明显时加大仓位,在趋势不明朗时减小仓位。同时,可以设置最大持仓上限,分批建仓和平仓。
-
多空对冲:考虑在震荡市中同时持有多空仓位,对冲市场风险。可以结合市场情绪指标如恐慌指数VIX等,动态调整多空比例。
-
参数自适应:针对不同的市场和标的,使用机器学习算法自动寻找最优参数组合,提高策略的适应性和稳健性。
通过以上优化方法,可以进一步提高策略的盈利能力和抗风险能力,更好地适应多变的市场环境。
总结
双均线交叉优化止损策略(TQQQ)是一个简单而有效的量化交易策略。它利用不同周期移动平均线的交叉信号,捕捉市场趋势,同时通过固定止损比例控制回撤风险。该策略逻辑清晰,易于实现和优化,适用于多种市场和标的。
通过合理选择均线周期和止损比例,该策略可以在牛市中获得可观的收益。但同时,该策略也面临参数敏感、趋势识别滞后、仓位集中等风险。针对这些风险,可以从动态止损、信号优化、仓位管理、多空对冲、参数自适应等方面进行改进和优化。
总的来说,双均线交叉优化止损策略(TQQQ)是一个值得尝试和深入研究的量化交易策略。通过不断优化和改进,它有望成为投资者的有力工具,帮助投资者在动荡的市场中获得稳健的回报。但同时,任何策略都有其局限性,投资者需要根据自己的风险偏好和市场观点,灵活运用,不断调整,才能在量化交易的道路上走得更远。
||
Strategy Overview
The Dual Moving Average Crossover with Optimized Stop Loss Strategy (TQQQ) is a quantitative trading strategy based on the crossover signals of two moving averages (SMA) with different periods. The strategy only takes long positions, opening a position when the fast moving average crosses above the slow moving average and closing the position when the fast moving average crosses below the slow moving average or when the price falls below the stop loss level. The strategy optimizes the periods of the fast and slow moving averages and the stop loss percentage, aiming to achieve higher returns in bull markets while reducing losses during market downturns.
Strategy Principle
The core of this strategy is to use the crossover signals of moving averages with different periods to capture market trends. When the short-term moving average crosses above the long-term moving average, it indicates a potential uptrend, and the strategy opens a long position. When the short-term moving average crosses below the long-term moving average, it suggests that the uptrend may have ended, and the strategy closes the position.
In addition to the moving average crossover signals, the strategy also incorporates a stop loss mechanism. When the market price falls below a fixed percentage stop loss level, the strategy exits the position, even if the moving averages have not generated a closing signal. The purpose of this mechanism is to control drawdown and prevent significant losses during trend reversals.
Specifically, the strategy includes the following steps:
- Calculate the fast moving average and the slow moving average.
- Determine whether there is an opening signal. When the fast moving average crosses above the slow moving average and there is no current position, open a long position.
- Record the opening price and calculate the stop loss level.
- Determine whether there is a closing signal. When the fast moving average crosses below the slow moving average or the price falls below the stop loss level, close all long positions.
- Based on the closing price, determine whether there is an opportunity to open or close a position on the next trading day, and repeat steps 2-4.
Through this series of steps, the strategy can quickly adapt to changes in market trends, following the trend in bull markets to obtain substantial profits while timely cutting losses during market downturns to control drawdown.
Strategy Advantages
-
Trend Following: By using moving average crossover signals, the strategy can capture market trends, holding positions during uptrends to obtain trend-following returns.
-
Stop Loss Mechanism: The fixed percentage stop loss can effectively control drawdown and avoid excessive losses from a single trade.
-
Parameter Flexibility: The period parameters of the fast and slow moving averages and the stop loss percentage can be adjusted according to market characteristics and personal risk preferences, increasing the adaptability of the strategy.
-
Wide Applicability: The strategy can be applied to various markets and instruments, such as stocks, futures, and foreign exchange, only requiring parameter adjustments based on the characteristics of the instrument.
-
Simplicity and Efficiency: The strategy logic is clear and easy to understand and implement. It has high backtesting efficiency, facilitating extensive parameter optimization and simulated trading.
Strategy Risks
-
Parameter Sensitivity: The selection of moving average periods and stop loss percentage has a significant impact on strategy performance. Inappropriate parameters may lead to frequent trading or missing trend opportunities.
-
Trend Recognition Lag: The moving average crossover signals have a certain lag, especially when the market changes rapidly, potentially missing the best timing for opening and closing positions.
-
Concentrated Positions: The strategy always maintains a 100% position, lacking position management and capital allocation mechanisms, facing higher capital risk.
-
Poor Performance in Sideways Markets: In sideways markets, frequent crossover signals may lead to strategy losses.
-
Black Swan Events: In extreme market conditions, trading signals may fail, and the fixed stop loss percentage may not cover actual risks.
To address these risks, the strategy can be optimized and improved in the following aspects:
-
Introduce Dynamic Stop Loss: Dynamically adjust the stop loss percentage based on market volatility or price levels to adapt to different market conditions.
-
Optimize Opening and Closing Signals: Combine other technical indicators such as MACD and RSI to improve the accuracy and timeliness of trend recognition.
-
Introduce Position Management: Dynamically adjust positions based on indicators such as market trend strength and volatility to control drawdown risk.
-
Incorporate Fundamental Analysis: Comprehensively consider macroeconomic and industry factors to avoid trading when fundamentals are unfavorable.
-
Set an Overall Stop Loss Line: Set an account-level overall stop loss line for extreme market conditions to control capital risk.
Strategy Optimization
-
Dynamic Stop Loss: Introduce indicators such as ATR and Bollinger Bands to dynamically adjust the stop loss percentage based on market volatility, loosening stop loss when trends are strong and tightening stop loss in sideways markets.
-
Signal Optimization: Experiment with different moving average combinations, such as EMA and WMA, to find more sensitive and effective opening and closing signals. At the same time, consider using MACD, RSI, and other indicators as supplementary judgment.
-
Position Management: Measure market trend strength using indicators such as ATR and ADX, increasing positions when trends are evident and reducing positions when trends are unclear. At the same time, set a maximum position limit and build and close positions in batches.
-
Long-Short Hedging: Consider holding both long and short positions in sideways markets to hedge market risk. Market sentiment indicators such as the VIX fear index can be used to dynamically adjust the long-short ratio.
-
Parameter Self-Adaptation: Use machine learning algorithms to automatically find the optimal parameter combinations for different markets and instruments, improving the adaptability and robustness of the strategy.
Through the above optimization methods, the strategy's profitability and risk resistance can be further improved to better adapt to the ever-changing market environment.
Summary
The Dual Moving Average Crossover with Optimized Stop Loss Strategy (TQQQ) is a simple yet effective quantitative trading strategy. It captures market trends using the crossover signals of moving averages with different periods while controlling drawdown risk through a fixed stop loss percentage. The strategy logic is clear, easy to implement and optimize, and applicable to various markets and instruments.
By reasonably selecting moving average periods and stop loss percentage, the strategy can achieve substantial returns in bull markets. However, the strategy also faces risks such as parameter sensitivity, trend recognition lag, and concentrated positions. To address these risks, improvements and optimizations can be made in aspects such as dynamic stop loss, signal optimization, position management, long-short hedging, and parameter self-adaptation.
Overall, the Dual Moving Average Crossover with Optimized Stop Loss Strategy (TQQQ) is a quantitative trading strategy worth trying and further researching. Through continuous optimization and improvement, it has the potential to become a powerful tool for investors, helping them obtain stable returns in volatile markets. However, any strategy has its limitations, and investors need to flexibly apply and constantly adjust based on their own risk preferences and market views to go further on the path of quantitative trading.
[/trans]
Strategy Arguments
| Argument | Default | Description |
|---|---|---|
| v_input_1 | 9 | Fast SMA Length |
| v_input_2 | 14 | Slow SMA Length |
| v_input_3 | 0.1 | Stop Loss Multiplier |
Source (PineScript)
/*backtest
start: 2023-03-16 00:00:00
end: 2024-03-21 00:00:00
period: 1d
basePeriod: 1h
exchanges: [{"eid":"Futures_Binance","currency":"BTC_USDT"}]
*/

//@version=4
strategy("SMA Crossover Strategy with Customized Stop Loss (Long Only)", overlay=true)

// Define input variables for SMA lengths and stop loss multiplier
fast_length = input(9, "Fast SMA Length")
slow_length = input(14, "Slow SMA Length")
stop_loss_multiplier = input(0.1, "Stop Loss Multiplier")

// Calculate SMA values
fast_sma = sma(close, fast_length)
slow_sma = sma(close, slow_length)

// Define entry and exit conditions
enter_long = crossover(fast_sma, slow_sma)
exit_long = crossunder(fast_sma, slow_sma)

// Plot SMAs on chart
plot(fast_sma, color=color.red)
plot(slow_sma, color=color.blue)

// Set start date for backtest
start_date = timestamp(2022, 01, 01, 00, 00)

// Filter trades based on start date
if time >= start_date
    if (enter_long)
        strategy.entry("Buy", strategy.long, when = strategy.position_size == 0)

    // Calculate stop loss level
    buy_price = strategy.position_avg_price
    stop_loss_level = buy_price * (1 - stop_loss_multiplier)

    // Exit trades
    if (exit_long or low <= stop_loss_level)
        strategy.close("Buy")
Detail
https://www.fmz.com/strategy/445821
Last Modified
2024-03-22 14:53:59