
7.2 KiB
Name
双均线交叉交易策略Dual-Moving-Average-Crossover-Trading-Strategy
Author
ChaoZhang
Strategy Description
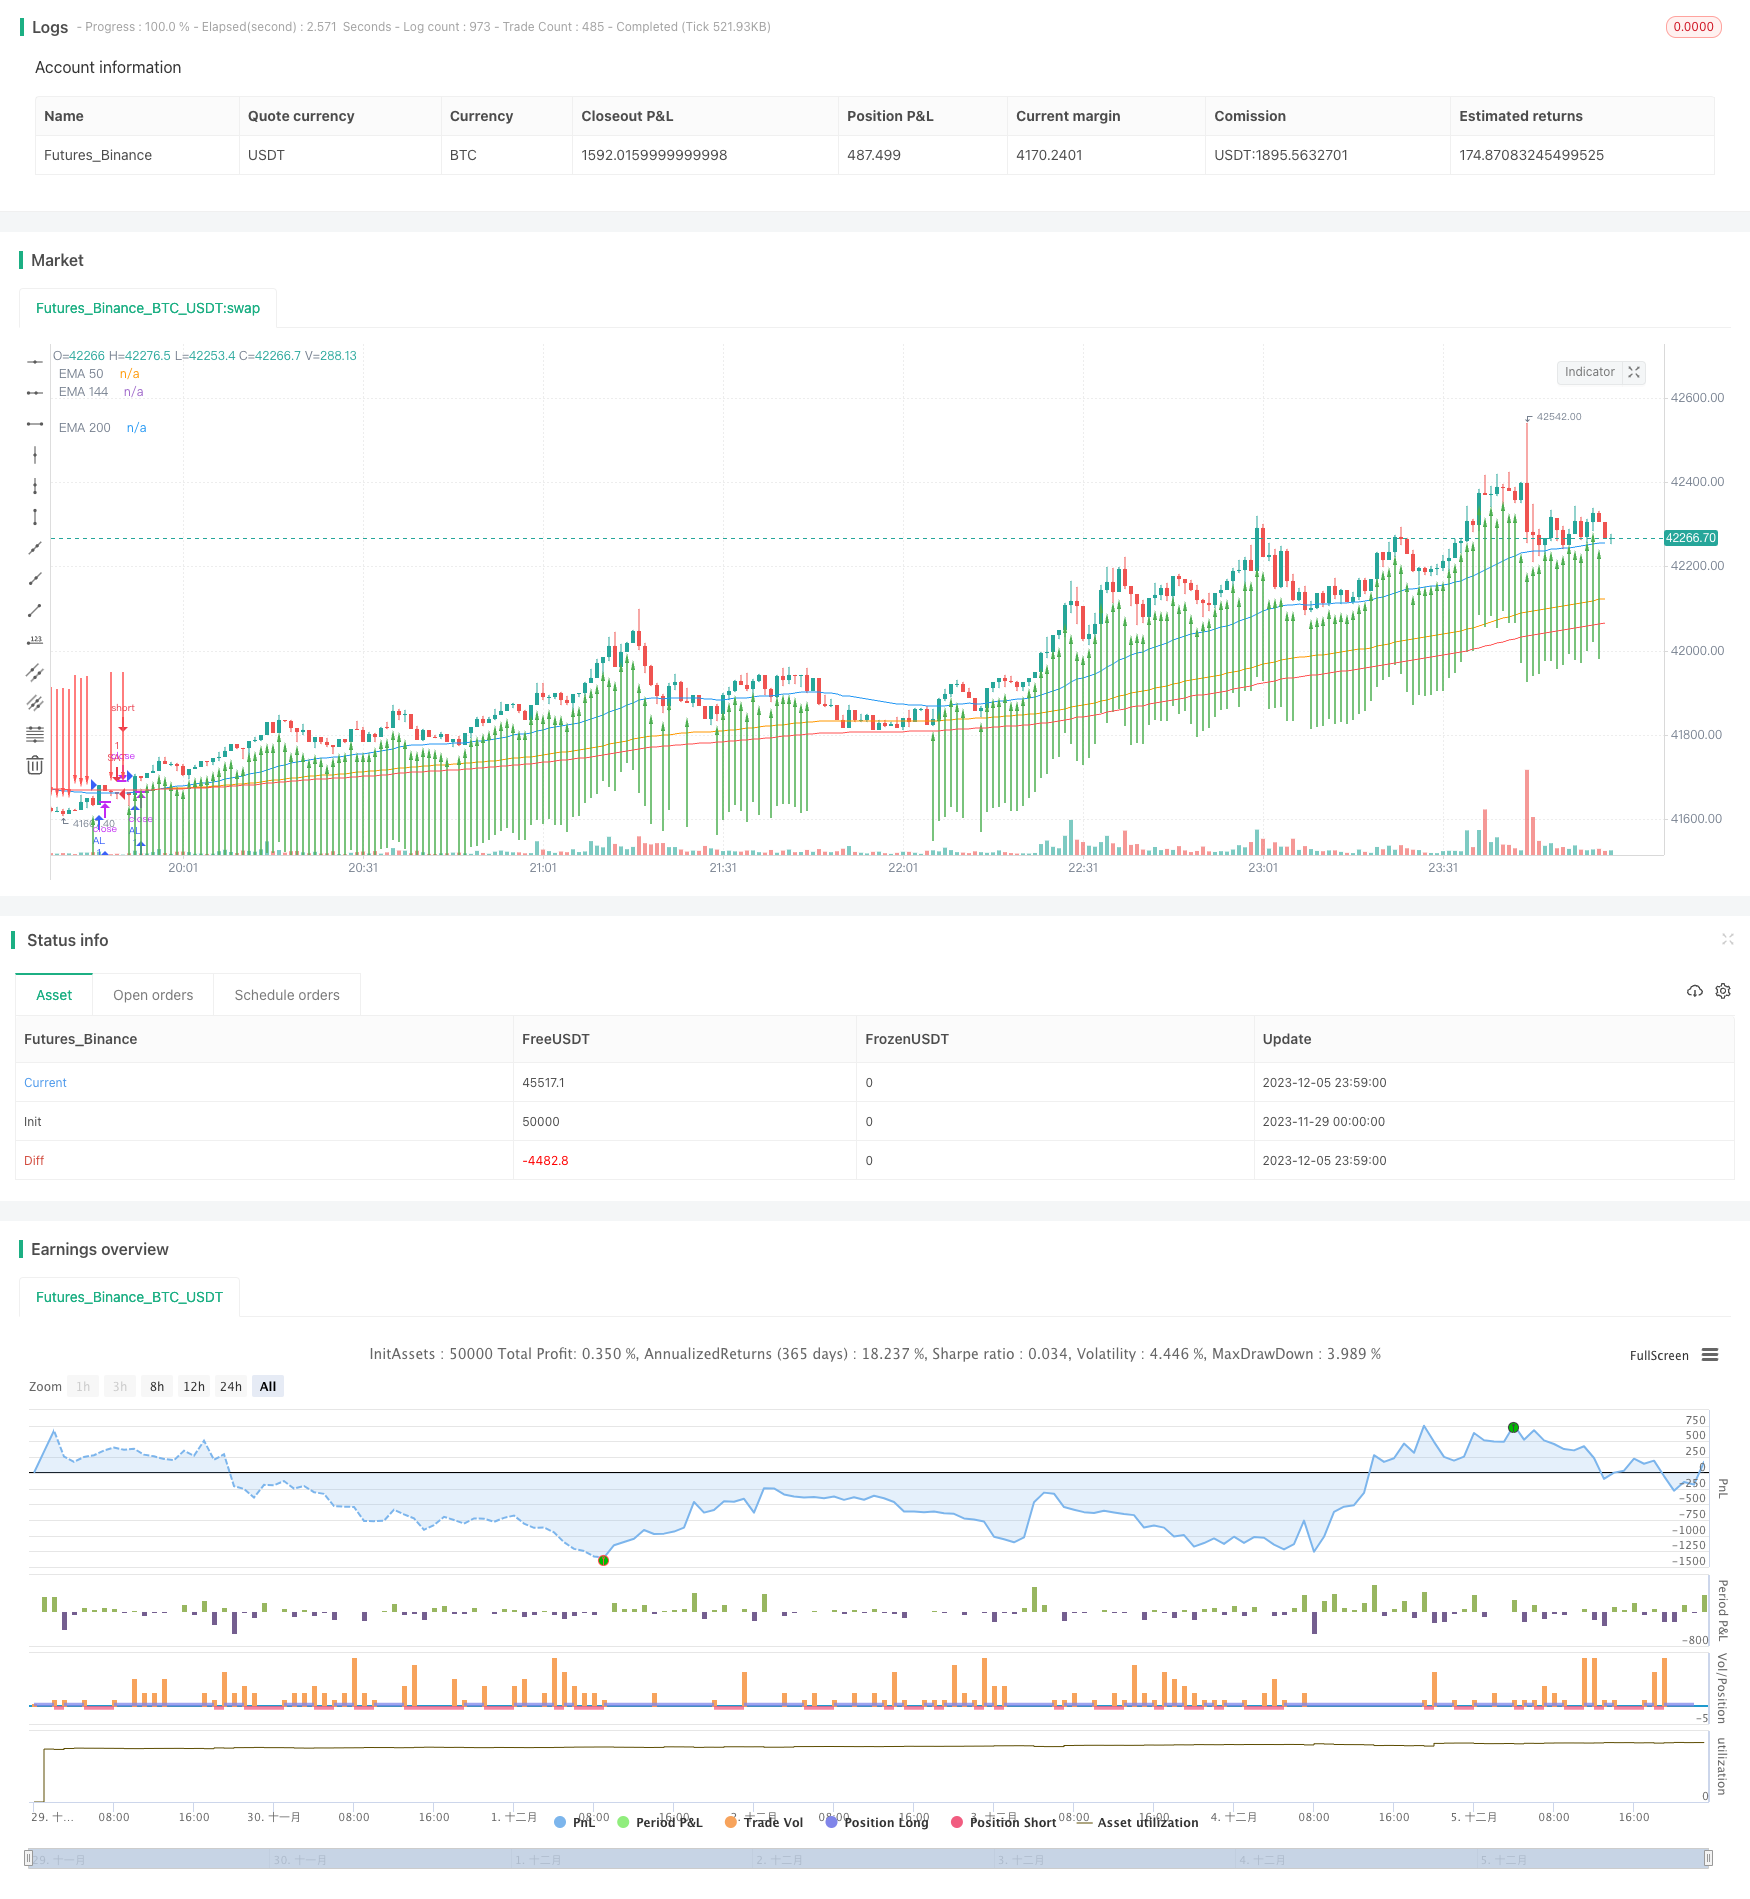 [trans]
概述
双均线交叉交易策略通过计算不同时间周期的指数移动平均线,根据其交叉情况产生买入和卖出信号,属于趋势跟踪交易策略。该策略采用50周期、144周期和200周期三条移动平均线,根据它们的交叉情况判断市场趋势,产生交易信号。当短期移动平均线上穿中长期移动平均线时产生买入信号;当短期移动平均线下穿中长期移动平均线时产生卖出信号。该策略简单实用,容易实现自动化交易。
策略原理
-
计算CLOSE收盘价的50周期、144周期和200周期的指数移动平均线,分别记为EMA50、EMA144和EMA200。
-
判断EMA50是否上穿EMA144和EMA200,如果同时上穿,产生买入信号,开多头仓位。
-
判断EMA50是否下穿EMA144和EMA200,如果同时下穿,产生卖出信号,平多头仓位。
优势分析
双均线交叉策略具有以下几个优势:
-
简单容易理解,参数设置简单,易于实现自动化。
-
响应迅速,能快速捕捉趋势的变化。
-
可自定义参数,调整均线周期,适应不同市场环境。
-
具有一定的去噪过滤能力,避免被短期波动误导。
-
可与其他指标或策略组合,构建规则系统。
风险分析
双均线交叉策略也存在一些风险:
-
容易产生假信号,被剧烈波动误导。
-
无法判断趋势的持续时间,可能过早入场或离场。
-
参数设置不当可能导致交易频繁,增加交易成本和滑点损失。
-
进入震荡趋势市场时,会产生连续亏损的情况。
-
无法控制交易风险,如止损退出。
优化方向
双均线交叉策略可以从以下几个方面进行优化:
-
结合其他指标过滤信号,如量能指标、震荡指标等,减少假信号。
-
添加止损策略,控制单笔交易风险。
-
优化移动平均线周期参数,适应不同周期的市场环境。
-
增加仓位管理模块,如固定数量开仓,加仓规则等。
-
结合机器学习等高级算法,动态优化策略参数。
总结
双均线交叉策略是一个简单实用的趋势跟踪策略。它通过EMA均线的交叉来判断趋势方向,以捕捉中长期趋势上的机会。该策略容易理解实现,但也存在产生假信号和控制风险的难题。通过引入其他指标组合,止损管理以及参数优化等手段,可以形成稳定且高效的交易系统。总的来说,双均线交叉策略适合自动化趋势跟踪交易,是量化交易的基础策略之一。
||
Overview
The Dual Moving Average Crossover trading strategy generates trading signals by calculating exponential moving averages (EMA) over different timeframes and detecting their crossover points. It belongs to the category of trend-following strategies. This strategy utilizes 3 EMAs – 50-period, 144-period, and 200-period – to determine the market trend based on their crossover points and produce trading signals. A buy signal is triggered when the faster EMA crosses above the slower EMAs. A sell signal is triggered when the faster EMA crosses below the slower EMAs. This strategy is simple, practical and easy to automate.
Strategy Logic
-
Calculate the 50-period, 144-period, and 200-period EMA using the closing price, denoted as EMA50, EMA144, and EMA200 respectively.
-
If EMA50 crosses above EMA144 and EMA200 simultaneously, trigger a buy signal to open long positions.
-
If EMA50 crosses below EMA144 and EMA200 simultaneously, trigger a sell signal to close long positions.
Advantage Analysis
The Dual Moving Average Crossover strategy has the following advantages:
-
Simple and easy to understand. The parameters are intuitive and easy to implement for automation.
-
Responds quickly to trend changes and momentum shifts.
-
Customizable parameters allow adjusting the EMA periods to fit different market conditions.
-
Possesses some noise filtering capability to avoid being misled by short-term fluctuations.
-
Can be combined with other indicators to build systematic trading rules.
Risk Analysis
There are also some risks associated with this strategy:
-
Susceptible to generating false signals and being whipsawed by high volatility.
-
Cannot determine the duration of the established trend. Signals may come prematurely.
-
Inappropriate parameter tuning can lead to over-trading which increases transaction costs and slippage.
-
Can produce consecutive losses when trading in range-bound, choppy markets.
-
Lacks risk management mechanisms like stop-loss.
Optimization Directions
Some ways to optimize the Dual Moving Average Crossover Strategy include:
-
Adding filters based on other indicators like volume and volatility to reduce false signals.
-
Incorporating stop-loss strategies to control single-trade risks.
-
Optimizing EMA periods to adapt to different market timeframes.
-
Adding position sizing rules like fixed fractional allocation, pyramiding etc.
-
Utilizing machine learning models to dynamically optimize parameters.
Conclusion
The Dual Moving Average Crossover is a simple and practical trend-following strategy. It identifies trend directionality through EMA crosses and aims to capture opportunities along the intermediate-to-long term trends. While easy to understand and implement, it suffers drawbacks like false signals and lack of risk controls. By introducing additional filters, stop losses, and parameter optimization, it can be molded into a robust and efficient trading system. Overall, the strategy is well suited for automated trend trading and remains one of the most basic building blocks of algorithmic trading strategies.
[/trans]
Source (PineScript)
/*backtest
start: 2023-11-29 00:00:00
end: 2023-12-06 00:00:00
period: 1m
basePeriod: 1m
exchanges: [{"eid":"Futures_Binance","currency":"BTC_USDT"}]
*/

// This source code is subject to the terms of the Mozilla Public License 2.0 at https://mozilla.org/MPL/2.0/
// © SDTA

//@version=5
strategy("EMA Crossover Strategy", overlay=true)

// Hareketli Ortalamaları Hesapla
ema50 = ta.ema(close, 50)
ema144 = ta.ema(close, 144)
ema200 = ta.ema(close, 200)

// Al sinyali koşulu: Fiyat EMA 50, EMA 144 ve EMA 200 üzerine çıktığında
longCondition = close > ema50 and close > ema144 and close > ema200

// Sat sinyali koşulu: Fiyat EMA 200, EMA 144 ve EMA 50 altına indiğinde
shortCondition = close < ema200 and close < ema144 and close < ema50

// Al ve Sat sinyallerinin gerçekleştiği çubuğu ok ile belirt
plotarrow(series=longCondition ? 1 : shortCondition ? -1 : na, colorup=color.green, colordown=color.red, offset=-1, title="Trade Arrow")

// Hareketli Ortalamaları Çiz
plot(ema50, color=color.blue, title="EMA 50")
plot(ema144, color=color.orange, title="EMA 144")
plot(ema200, color=color.red, title="EMA 200")

// Strateji testi ekleyin
strategy.entry("AL", strategy.long, when=longCondition)
strategy.entry("SAT", strategy.short, when=shortCondition)
Detail
https://www.fmz.com/strategy/434523
Last Modified
2023-12-07 10:36:46