
5.9 KiB
Name
双均线交叉与RSI指标结合的量化交易策略Dual-Moving-Average-Crossover-Combined-with-RSI-Indicator-Quantitative-Trading-Strategy
Author
ChaoZhang
Strategy Description
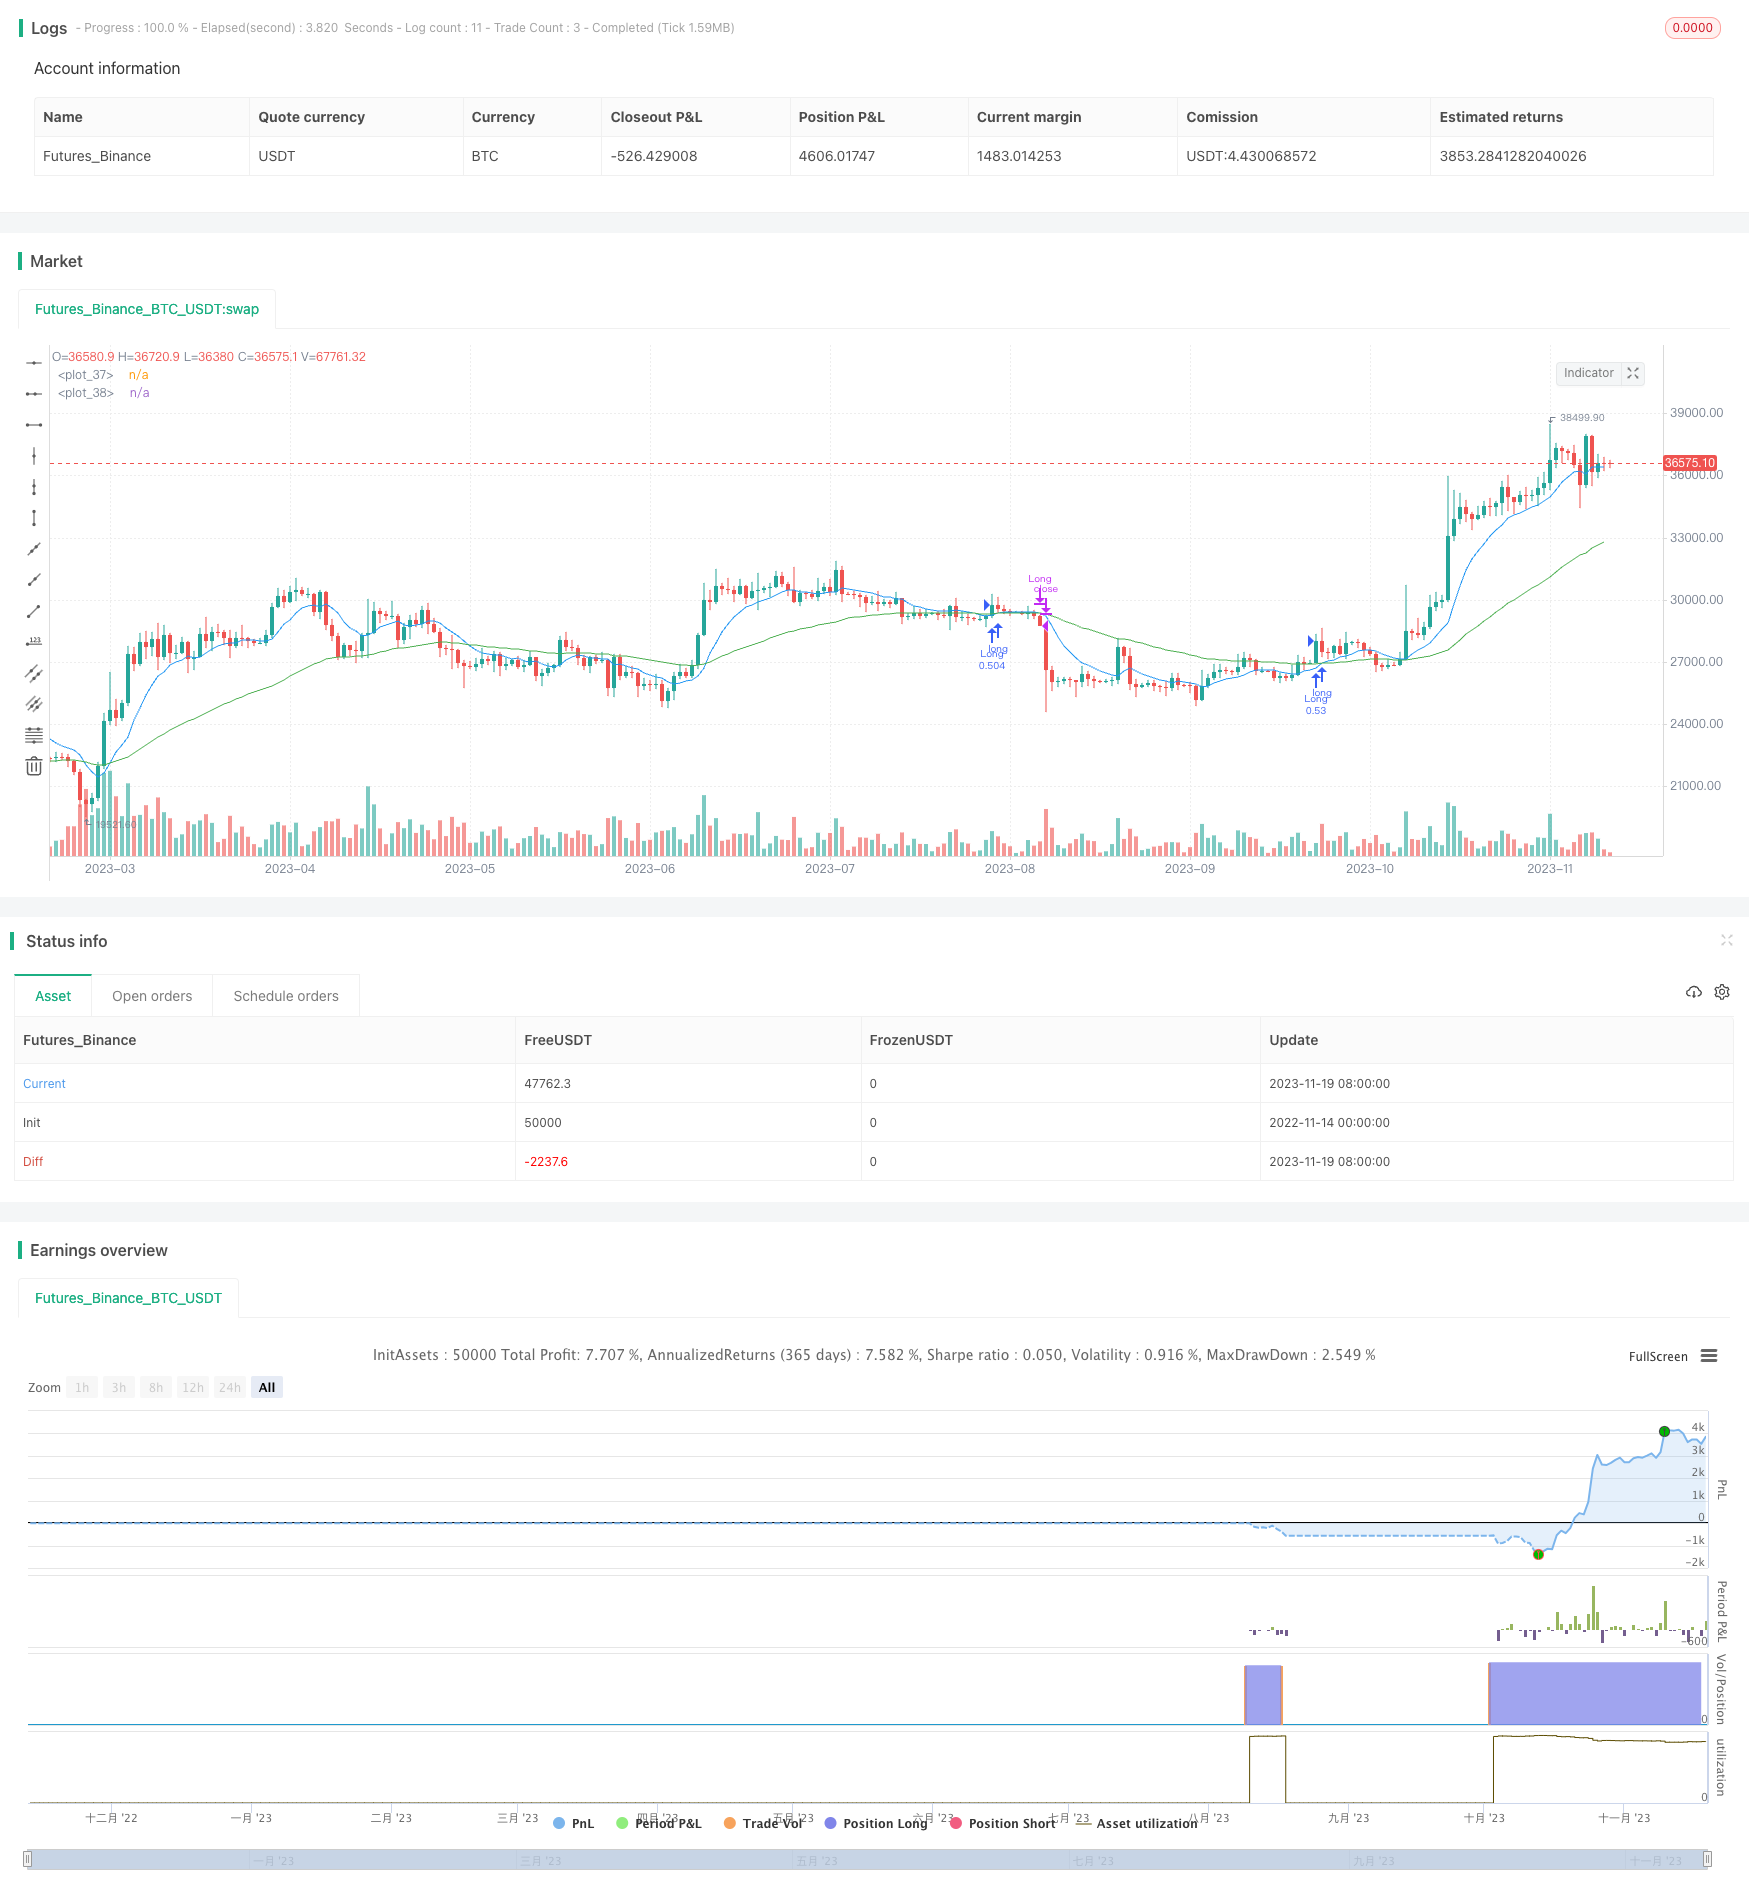 [trans]
概述
本策略通过结合双均线交叉和RSI指标来识别趋势方向和超买超卖情况,在符合买入条件时做多,在符合卖出条件时平仓。该策略旨在利用均线交叉来确定趋势方向,同时利用RSI指标来避免在市场顶部做多和市场底部做空,从而获得更好的收益。
策略原理
当快速9周期均线上穿慢速50周期均线时,表示短期趋势上升叠加长期趋势上升,属于典型的多头信号。同时,如果RSI指标大于上一周期5个点且小于70时,则表明处于超买前的区域,这时做多则是比较合适的时机。
当快速9周期均线下穿慢速50周期均线时,表示处于空头市场,需要平仓。
优势分析
- 利用双均线交叉判断大趋势,避免被假突破误导
- RSI指标避免市场转折点做出错误决策
- 可以灵活调整均线周期,适应不同品种和时间维度
- 可控的止损策略
风险分析
- 均线交叉做出决策有时效性不高,可能出现亏损
- RSI参数设置不当可能导致错过最佳入场时机
- 需要关注交易量能否支撑价格行情
- 突发事件带来的非理性行情需要手工干预
优化方向
- 优化RSI的参数以取得最佳结果
- 结合交易量指标避免虚假信号
- 根据不同品种和时间维度测试最佳均线参数
- 适当放宽止损幅度,避免被套
总结
本策略通过双均线交叉判断方向和RSI避免追高追低,能够有效利用中长线趋势获得稳定收益。但也需要警惕均线交叉信号的滞后性和RSI参数的调整,同时关注价格与成交量的关系。通过持续测试和优化,本策略有望取得更好的效果。
||
Overview
This strategy combines dual moving average crossover and RSI indicator to identify trend direction and overbought/oversold situations. It goes long when the buying conditions are met and closes positions when the selling conditions are triggered. The goal is to use moving average crossover to determine trend direction while utilizing RSI indicator to avoid wrongly buying at tops and selling at bottoms, thus generating better profits.
Strategy Logic
When the fast 9-period moving average crosses above the slow 50-period moving average, it signals an uptrend in shorter timeframe overlapping with an uptrend in longer timeframe, which is a typical bullish signal. Meanwhile, if RSI is greater than the previous period by 5 points and less than 70, it means the asset is approaching but not yet in the overbought territory, making it a good timing to go long.
When the fast 9-period moving average crosses below the slow 50-period moving average, it signals the beginning of a bearish market and existing long positions should be closed.
Advantage Analysis
- Dual moving averages help determine overall market direction and avoid false breakout
- RSI indicator prevents wrong moves at turning points
- Flexibility in adjusting moving average periods to suit different symbols and timeframes
- Controllable stop loss strategy
Risk Analysis
- Crossover signal may lag and cause some losses
- Improper RSI parameter setting may miss best entry timing
- Need to watch trading volume to see if it supports price move
- Black swan events require manual intervention
Optimization Directions
- Optimize RSI parameters for best results
- Incorporate trading volume to avoid false signals
- Test optimal moving average periods based on symbol and timeframe
- Loosen stop loss to avoid being stopped out early
Summary
This strategy utilizes dual moving average crossover to determine direction and RSI to avoid chasing tops and bottoms. It can effectively ride medium- to long-term trends for steady profits. But the lagging nature of crossover signals and tuning of RSI parameters should be watched out for. Also need to correlate price with volume. With continuous testing and optimization, this strategy shows promise for even better results.
[/trans]
Strategy Arguments
| Argument | Default | Description |
|---|---|---|
| v_input_1 | true | Show Date Range |
| v_input_2 | 14 | length |
Source (PineScript)
/*backtest
start: 2022-11-14 00:00:00
end: 2023-11-20 00:00:00
period: 1d
basePeriod: 1h
exchanges: [{"eid":"Futures_Binance","currency":"BTC_USDT"}]
*/

// This source code is subject to the terms of the Mozilla Public License 2.0 at https://mozilla.org/MPL/2.0/
// © joshuajcoop01

//@version=5
strategy("Bitpanda Coinrule Template",
         overlay=true,
         initial_capital=1000,
         process_orders_on_close=true,
         default_qty_type=strategy.percent_of_equity,
         default_qty_value=30,
         commission_type=strategy.commission.percent,
         commission_value=0.1)

showDate = input(defval=true, title='Show Date Range')
timePeriod = time >= timestamp(syminfo.timezone, 2020, 1, 1, 0, 0)
notInTrade = strategy.position_size <= 0


// RSI
length = input(14)
vrsi = ta.rsi(close, length)

// Moving  Averages for Buy Condition
buyFastEMA = ta.ema(close, 9)
buySlowEMA = ta.ema(close, 50)
buyCondition1 = ta.crossover(buyFastEMA, buySlowEMA)


increase = 5
if ((vrsi > vrsi[1]+increase) and buyCondition1 and vrsi < 70 and timePeriod)
    strategy.entry("Long", strategy.long)


// Moving  Averages for Sell Condition
sellFastEMA = ta.ema(close, 9)
sellSlowEMA = ta.ema(close, 50)
plot(request.security(syminfo.tickerid, "60", sellFastEMA), color = color.blue)
plot(request.security(syminfo.tickerid, "60", sellSlowEMA), color = color.green)


condition = ta.crossover(sellSlowEMA, sellFastEMA)
//sellCondition1 = request.security(syminfo.tickerid, "60", condition)

strategy.close('Long', when = condition and timePeriod)
Detail
https://www.fmz.com/strategy/432767
Last Modified
2023-11-21 12:09:50