
18 KiB
Name
双均线交叉与随机指标结合的自适应追踪止损策略-Dual-Moving-Average-Crossover-with-Stochastic-Filter-and-Adaptive-Trailing-Stop-Strategy
Author
ianzeng123
Strategy Description
[trans]## 策略概述
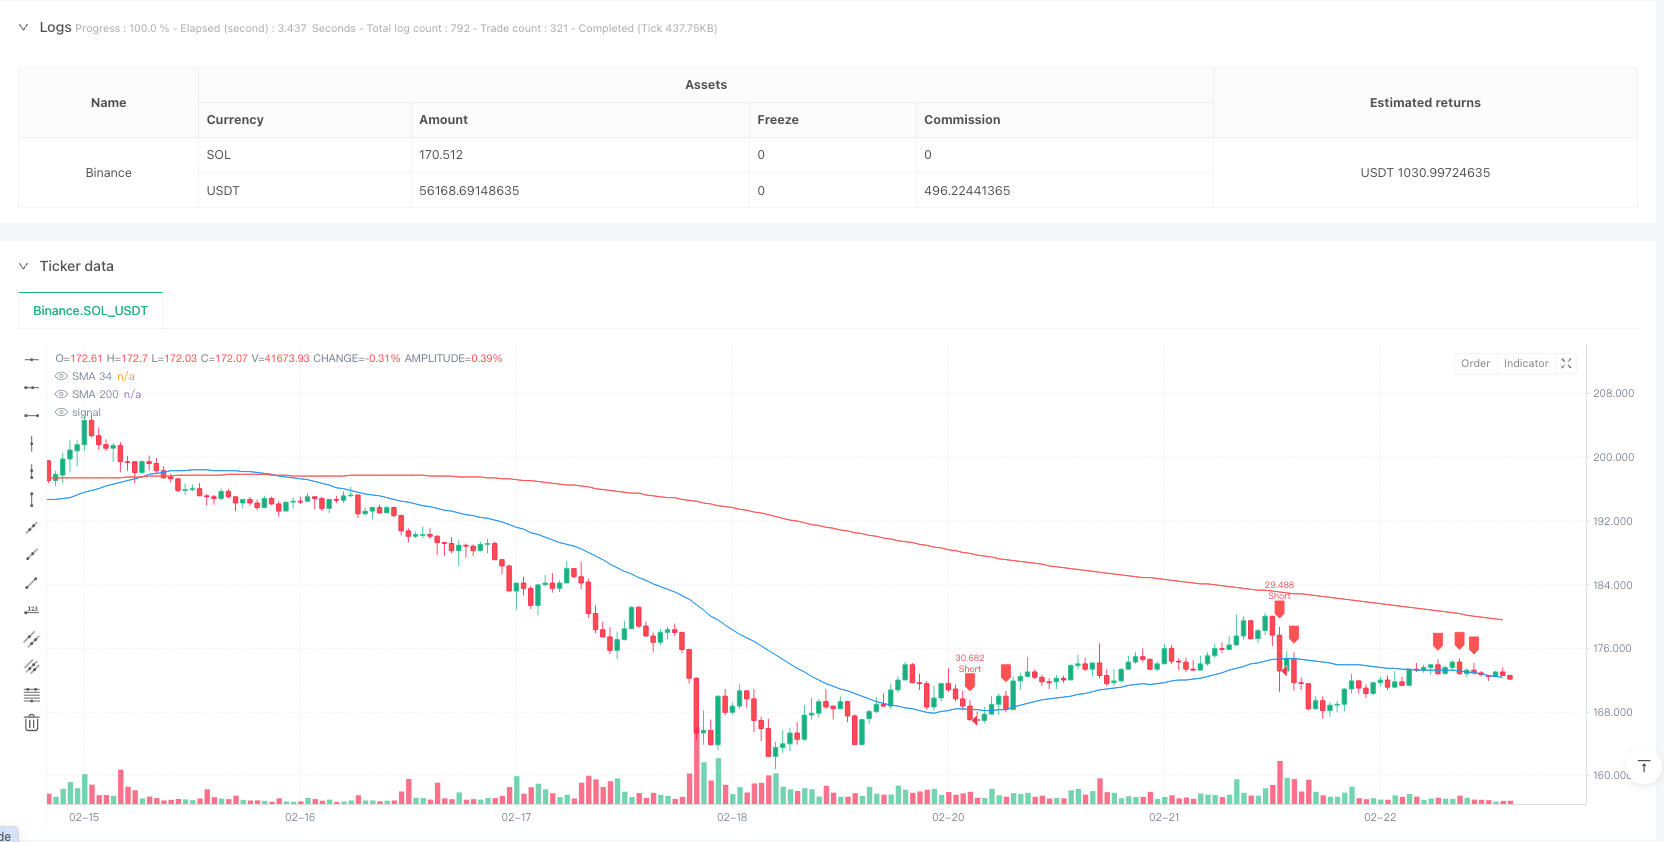
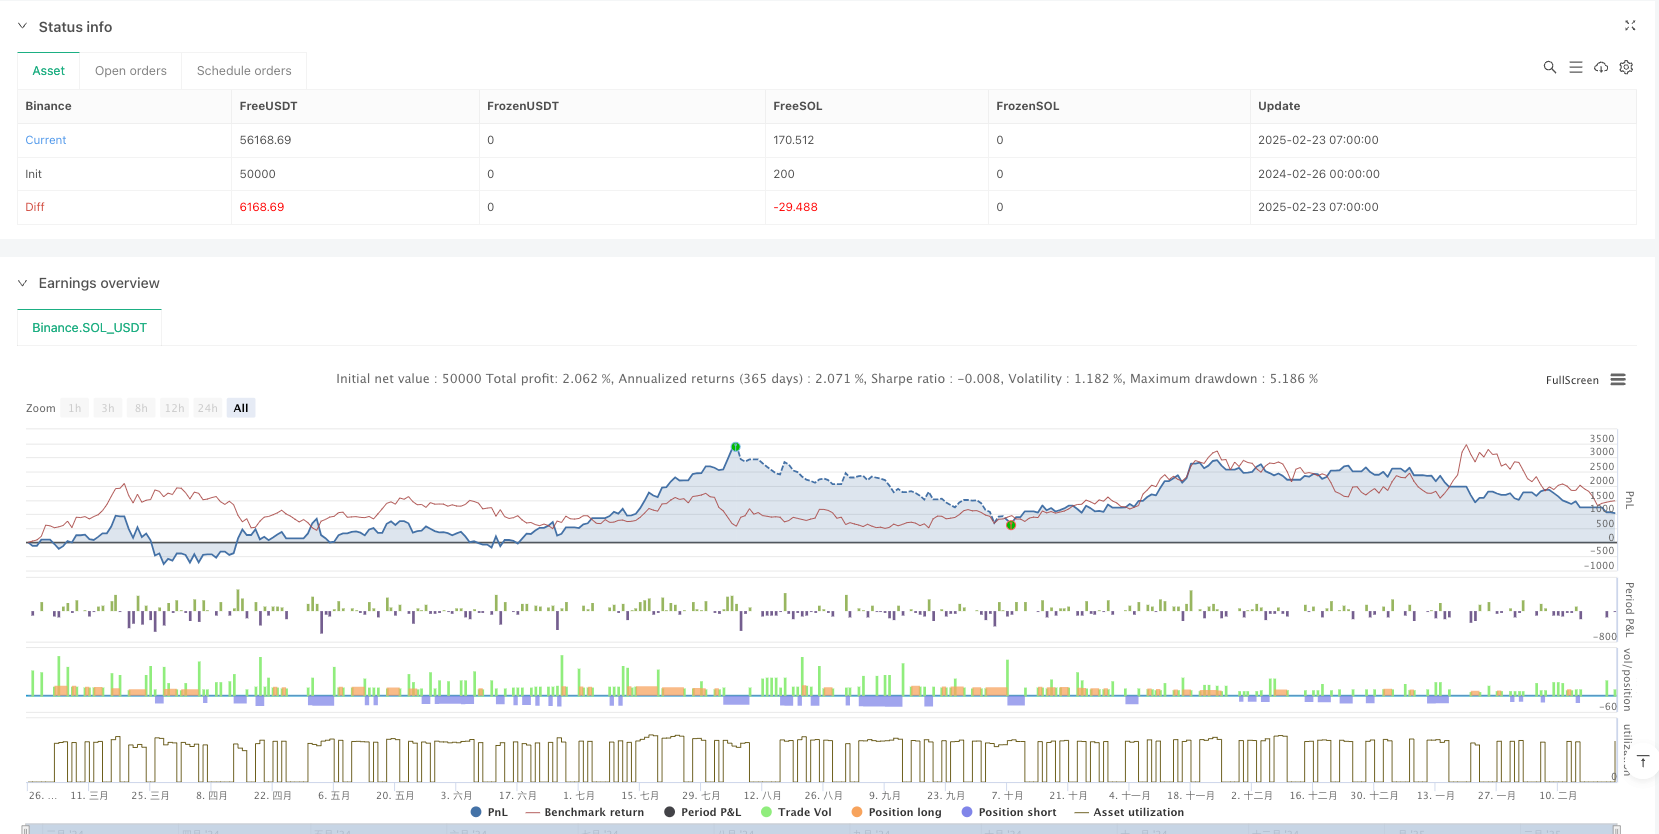
该策略是一种结合了均线交叉、随机指标过滤和自适应追踪止损的综合交易系统。它主要基于快速移动平均线(SMA 34)与慢速移动平均线(SMA 200)的交叉信号,同时使用Stochastic(9-3-3)随机指标作为额外的过滤条件,以增强信号的可靠性。此外,策略还设计了完善的风险管理模块,包括固定止损、获利目标以及根据价格走势自动调整的追踪止损功能。特别值得注意的是,当利润达到预设阈值时,策略会将止损点自动调整至入场价,以保护已获利润,实现"保本出局"的风险控制目标。
策略原理
策略的核心逻辑建立在以下几个关键组件上:
-
双均线系统:使用34周期和200周期的简单移动平均线(SMA),分别代表中期和长期趋势。当短期均线上穿长期均线时,表明上升趋势形成;反之,当短期均线下穿长期均线时,表明下降趋势形成。
-
随机指标过滤:采用参数为9-3-3的Stochastic随机指标,作为辅助的市场超买超卖判断工具。当考虑做多信号时,要求随机指标值高于20,避免在超卖区域反弹尚未充分时入场;当考虑做空信号时,要求随机指标值低于80,避免在超买区域回落尚未确认时入场。
-
入场条件:
- 做多条件:价格上穿SMA 34,同时SMA 34位于SMA 200之上,且Stochastic %K线大于20。
- 做空条件:价格下穿SMA 34,同时SMA 34位于SMA 200之下,且Stochastic %K线小于80。
-
风险管理机制:
- 固定止损:设置为入场价格的2%。
- 获利目标:设置为入场价格的4%。
- 保本止损功能:当盈利达到2%时,止损点自动上调至入场价(做多)或下调至入场价(做空),确保交易至少不亏损。
-
执行逻辑:策略通过TradingView的strategy模块实现自动化交易执行,每次交易使用账户权益的10%进行操作。
策略优势
-
趋势跟踪与震荡结合:通过结合均线系统(趋势跟踪)和Stochastic随机指标(震荡指标),该策略能够同时捕捉趋势和市场状态,提高入场时机的准确性。
-
多层级确认:入场信号需要满足价格与均线的交叉、均线相对位置以及随机指标的状态三重条件,有效减少了假突破和错误信号。
-
风险收益比合理:策略设置的止损为2%,获利目标为4%,风险收益比为1:2,符合健康的交易原则。
-
动态保本机制:通过breakevenTrigger参数(2%),实现了自动化的保本功能,在行情朝有利方向发展到一定程度后,确保交易不会从盈利转为亏损。
-
可视化交易信号:策略在价格图表上直观显示买卖信号,方便交易者监控和分析策略表现。
-
参数可调整性:所有关键参数都可以通过输入界面调整,包括均线周期、Stochastic参数、止损比例、获利目标以及保本触发点,使策略具有良好的适应性。
策略风险
-
趋势反转风险:虽然使用了SMA 200作为长期趋势过滤,但市场可能在短期内出现快速反转,导致止损被触发。解决方法:可以考虑结合波动率指标,在波动率异常高的时期减小仓位或暂停交易。
-
滑点和交易成本:策略在实际环境中可能面临滑点和交易成本问题,影响实际收益率。解决方法:优化交易频率,避免过于频繁的交易,或调整入场条件要求更强的信号确认。
-
参数敏感性:策略效果高度依赖于参数设置,不同市场和时间周期可能需要不同的参数组合。解决方法:进行回测优化,为不同市场环境预设不同的参数配置文件。
-
均线滞后性:移动平均线本质上是滞后指标,可能导致入场或出场时机延迟。解决方法:可以考虑使用指数移动平均线(EMA)代替简单移动平均线(SMA),或结合其他领先指标进行确认。
-
固定百分比风险:使用固定的止损百分比可能无法适应市场波动率的变化。解决方法:设计基于ATR(Average True Range)的动态止损机制,使止损点更贴合当前市场波动特性。
策略优化方向
-
动态调整的均线周期:目前策略使用固定的34和200周期均线,可以考虑根据市场波动率自动调整均线周期,在高波动率环境中使用较长周期,在低波动率环境中使用较短周期,以提高适应性。
-
加入交易量确认:目前的入场信号仅基于价格和指标,可以增加交易量条件,要求在信号发生时交易量显著增加,以确认突破的有效性。
-
多时间框架分析:实现多时间框架确认机制,例如要求较大时间框架的趋势方向与交易方向一致,增强交易信号的可靠性。
-
优化追踪止损逻辑:当前的保本机制相对简单,可以设计更复杂的追踪止损逻辑,例如根据ATR动态设置追踪距离,或随着利润的增加逐步收紧追踪止损。
-
增加市场状态过滤器:引入市场状态识别机制,例如通过ADX指标识别趋势强度,在强趋势市场中采用更激进的参数设置,在震荡市场中采用更保守的设置。
-
优化Stochastic参数:考虑使用自适应的Stochastic参数,而不是固定的9-3-3,使其更好地适应不同市场条件。
总结
"双均线交叉与随机指标结合的自适应追踪止损策略"是一个结构完善、逻辑清晰的交易系统,它有效地整合了趋势跟踪、震荡指标过滤和风险管理机制。通过SMA 34与SMA 200的交叉结合Stochastic随机指标的确认,该策略能够捕捉市场中的有效趋势变化,同时避免在不利市场条件下入场。特别是其自适应的保本机制,为交易提供了重要的风险控制手段。
然而,该策略仍有提升空间,尤其是在应对不同市场环境的适应性方面。通过引入动态参数调整、交易量确认、多时间框架分析等优化措施,策略的性能可以进一步提高。对于交易者而言,理解策略背后的逻辑原理并根据自身风险承受能力和交易目标进行适当调整,是成功应用该策略的关键。
无论是追求稳健收益的长期投资者,还是寻求短期交易机会的活跃交易者,这一策略都提供了一个结构化的框架,帮助交易者在复杂多变的市场中做出更加系统化和纪律性的交易决策。 || ## Strategy Overview
This strategy is a comprehensive trading system that combines moving average crossovers, Stochastic indicator filtering, and adaptive trailing stop loss. It primarily relies on crossover signals between a fast moving average (SMA 34) and a slow moving average (SMA 200), while using the Stochastic (9-3-3) indicator as an additional filter to enhance signal reliability. Additionally, the strategy incorporates a sophisticated risk management module, including fixed stop loss, take profit targets, and an automatically adjusting trailing stop function based on price movement. Notably, when profit reaches a preset threshold, the strategy automatically adjusts the stop loss to the entry price, protecting accumulated profits and achieving a "breakeven exit" risk control objective.
Strategy Principles
The core logic of the strategy is built on several key components:
-
Dual Moving Average System: Uses 34-period and 200-period Simple Moving Averages (SMA), representing medium and long-term trends respectively. When the shorter-term moving average crosses above the longer-term moving average, it indicates an uptrend formation; conversely, when the shorter-term moving average crosses below the longer-term moving average, it signals a downtrend formation.
-
Stochastic Indicator Filter: Employs a Stochastic indicator with 9-3-3 parameters as a supplementary tool for market overbought/oversold conditions. For long signals, the Stochastic value must be above 20, avoiding entry during insufficient rebounds from oversold areas; for short signals, the Stochastic value must be below 80, avoiding entry during unconfirmed pullbacks from overbought areas.
-
Entry Conditions:
- Long Entry: Price crosses above SMA 34, while SMA 34 is above SMA 200, and Stochastic %K line is greater than 20.
- Short Entry: Price crosses below SMA 34, while SMA 34 is below SMA 200, and Stochastic %K line is less than 80.
-
Risk Management Mechanism:
- Fixed Stop Loss: Set at 2% from entry price.
- Take Profit: Set at 4% from entry price.
- Breakeven Function: When profit reaches 2%, stop loss automatically moves to entry price (for long positions) or down to entry price (for short positions), ensuring the trade at least doesn't lose money.
-
Execution Logic: The strategy implements automated trade execution through TradingView's strategy module, allocating 10% of account equity per trade.
Strategy Advantages
-
Combination of Trend Following and Oscillation: By integrating a moving average system (trend following) with the Stochastic indicator (oscillator), this strategy can simultaneously capture trends and market conditions, improving entry timing accuracy.
-
Multi-level Confirmation: Entry signals must satisfy three conditions - price and moving average crossover, relative moving average positions, and Stochastic indicator status - effectively reducing false breakouts and incorrect signals.
-
Reasonable Risk-Reward Ratio: The strategy sets a stop loss at 2% and a profit target at 4%, creating a risk-reward ratio of 1:2, which aligns with healthy trading principles.
-
Dynamic Breakeven Mechanism: Through the breakevenTrigger parameter (2%), the strategy implements an automated breakeven function, ensuring trades don't turn from profitable to losing once the market has moved favorably to a certain extent.
-
Visualization of Trading Signals: The strategy displays buy and sell signals intuitively on the price chart, facilitating monitoring and analysis of strategy performance.
-
Parameter Adjustability: All key parameters can be adjusted through the input interface, including moving average periods, Stochastic parameters, stop loss percentage, profit target, and breakeven trigger point, giving the strategy good adaptability.
Strategy Risks
-
Trend Reversal Risk: Although SMA 200 is used as a long-term trend filter, markets can experience rapid reversals in the short term, triggering stop losses. Solution: Consider incorporating volatility indicators and reduce position size or pause trading during periods of abnormally high volatility.
-
Slippage and Trading Costs: In real environments, the strategy may face slippage and trading cost issues that impact actual returns. Solution: Optimize trading frequency, avoid excessively frequent trading, or adjust entry conditions to require stronger signal confirmation.
-
Parameter Sensitivity: Strategy effectiveness highly depends on parameter settings, with different markets and timeframes potentially requiring different parameter combinations. Solution: Conduct backtesting optimization and preset different parameter configuration files for various market environments.
-
Moving Average Lag: Moving averages are inherently lagging indicators, potentially causing delayed entry or exit timing. Solution: Consider using Exponential Moving Averages (EMA) instead of Simple Moving Averages (SMA), or combine with other leading indicators for confirmation.
-
Fixed Percentage Risk: Using fixed stop loss percentages may not adapt to changes in market volatility. Solution: Design a dynamic stop loss mechanism based on ATR (Average True Range) to better align stop loss points with current market volatility characteristics.
Strategy Optimization Directions
-
Dynamically Adjusted Moving Average Periods: Currently, the strategy uses fixed 34 and 200 period moving averages. Consider automatically adjusting moving average periods based on market volatility, using longer periods in high-volatility environments and shorter periods in low-volatility environments to improve adaptability.
-
Add Volume Confirmation: Current entry signals are based solely on price and indicators. Add volume conditions requiring significant volume increases when signals occur to confirm breakout validity.
-
Multiple Timeframe Analysis: Implement a multiple timeframe confirmation mechanism, for example, requiring that the trend direction in larger timeframes aligns with the trading direction, enhancing trade signal reliability.
-
Optimize Trailing Stop Logic: The current breakeven mechanism is relatively simple. Design more sophisticated trailing stop logic, such as dynamically setting trailing distances based on ATR, or gradually tightening trailing stops as profits increase.
-
Add Market State Filters: Introduce market state recognition mechanisms, such as using the ADX indicator to identify trend strength, adopting more aggressive parameter settings in strong trend markets and more conservative settings in oscillating markets.
-
Optimize Stochastic Parameters: Consider using adaptive Stochastic parameters instead of fixed 9-3-3 settings to better adapt to different market conditions.
Summary
The "Dual Moving Average Crossover with Stochastic Filter and Adaptive Trailing Stop Strategy" is a well-structured trading system with clear logic that effectively integrates trend following, oscillator filtering, and risk management mechanisms. Through SMA 34 and SMA 200 crossovers combined with Stochastic indicator confirmation, this strategy can capture effective trend changes in the market while avoiding entries under unfavorable market conditions. Its adaptive breakeven mechanism, in particular, provides an important risk control measure for trading.
However, the strategy still has room for improvement, especially in terms of adaptability to different market environments. By introducing dynamic parameter adjustments, volume confirmation, multiple timeframe analysis, and other optimization measures, strategy performance can be further enhanced. For traders, understanding the logical principles behind the strategy and making appropriate adjustments based on personal risk tolerance and trading objectives is key to successfully applying this strategy.
Whether for long-term investors seeking stable returns or active traders looking for short-term trading opportunities, this strategy provides a structured framework that helps traders make more systematic and disciplined trading decisions in complex and changing markets.[/trans]
Source (PineScript)
/*backtest
start: 2024-02-26 00:00:00
end: 2025-02-23 08:00:00
period: 1h
basePeriod: 1h
exchanges: [{"eid":"Binance","currency":"SOL_USDT"}]
*/

//@version=6
strategy('[DRAGON]SMA 34 & SMA 200 with Stochastic 9-3-3 & Trailing Stop (Price Chart)', overlay=true, default_qty_type=strategy.percent_of_equity, default_qty_value=10)

// Inputs for Moving Averages
SMA_fast_length = input.int(34, title='Fast SMA (34)', minval=1)
SMA_slow_length = input.int(200, title='Slow SMA (200)', minval=1)

// Inputs for Stochastic 9-3-3 (ใช้สำหรับเงื่อนไขเทรด แต่ไม่แสดงบนกราฟ)
stoK_length = input.int(9, title='Stochastic %K Length', minval=1)
stoD_length = input.int(3, title='Stochastic %D Smoothing', minval=1)
sto_smoothK = input.int(3, title='Stochastic Smoothing', minval=1)

// Define Stop Loss, Take Profit & Trailing Stop
stopLossPercent = input.float(2, title='Stop Loss %') / 100
takeProfitPercent = input.float(4, title='Take Profit %') / 100
breakevenTrigger = input.float(2, title='Move SL to BE when Profit Reaches (%)') / 100

// Calculate SMAs
sma34 = ta.sma(close, SMA_fast_length)
sma200 = ta.sma(close, SMA_slow_length)

// Calculate Stochastic (สำหรับใช้ในเงื่อนไขเทรด)
stoK = ta.sma(ta.stoch(close, high, low, stoK_length), sto_smoothK)
stoD = ta.sma(stoK, stoD_length)

// Plot Moving Averages บนกราฟราคา
plot(sma34, color=color.blue, title='SMA 34')
plot(sma200, color=color.red, title='SMA 200')

// Define Entry Conditions โดยมีเงื่อนไขจาก Stochastic
buySignal = ta.crossover(close, sma34) and sma34 > sma200 and stoK > 20
sellSignal = ta.crossunder(close, sma34) and sma34 < sma200 and stoK < 80

// Calculate Stop Loss & Take Profit Levels
longSL = strategy.position_avg_price * (1 - stopLossPercent)
longTP = strategy.position_avg_price * (1 + takeProfitPercent)
shortSL = strategy.position_avg_price * (1 + stopLossPercent)
shortTP = strategy.position_avg_price * (1 - takeProfitPercent)

// กำหนด Breakeven เมื่อได้กำไรตามที่ตั้งไว้
longBreakeven = strategy.position_avg_price * (1 + breakevenTrigger)
shortBreakeven = strategy.position_avg_price * (1 - breakevenTrigger)

longStop = close >= longBreakeven ? strategy.position_avg_price : longSL
shortStop = close <= shortBreakeven ? strategy.position_avg_price : shortSL

// Execute Trades
if buySignal
    strategy.entry('Long', strategy.long)
    strategy.exit('Long Exit', from_entry='Long', stop=longStop, limit=longTP)

if sellSignal
    strategy.entry('Short', strategy.short)
    strategy.exit('Short Exit', from_entry='Short', stop=shortStop, limit=shortTP)

// Plot Buy/Sell Signals บนกราฟราคา
plotshape(buySignal, location=location.belowbar, color=color.lime, style=shape.labelup, title='Buy Signal')
plotshape(sellSignal, location=location.abovebar, color=color.red, style=shape.labeldown, title='Sell Signal')
Detail
https://www.fmz.com/strategy/483679
Last Modified
2025-02-25 11:05:17