
8.9 KiB
Name
双均线与随机RSI趋势跟踪策略-Dual-EMA-and-Stochastic-RSI-Trend-Following-Strategy
Author
ChaoZhang
Strategy Description
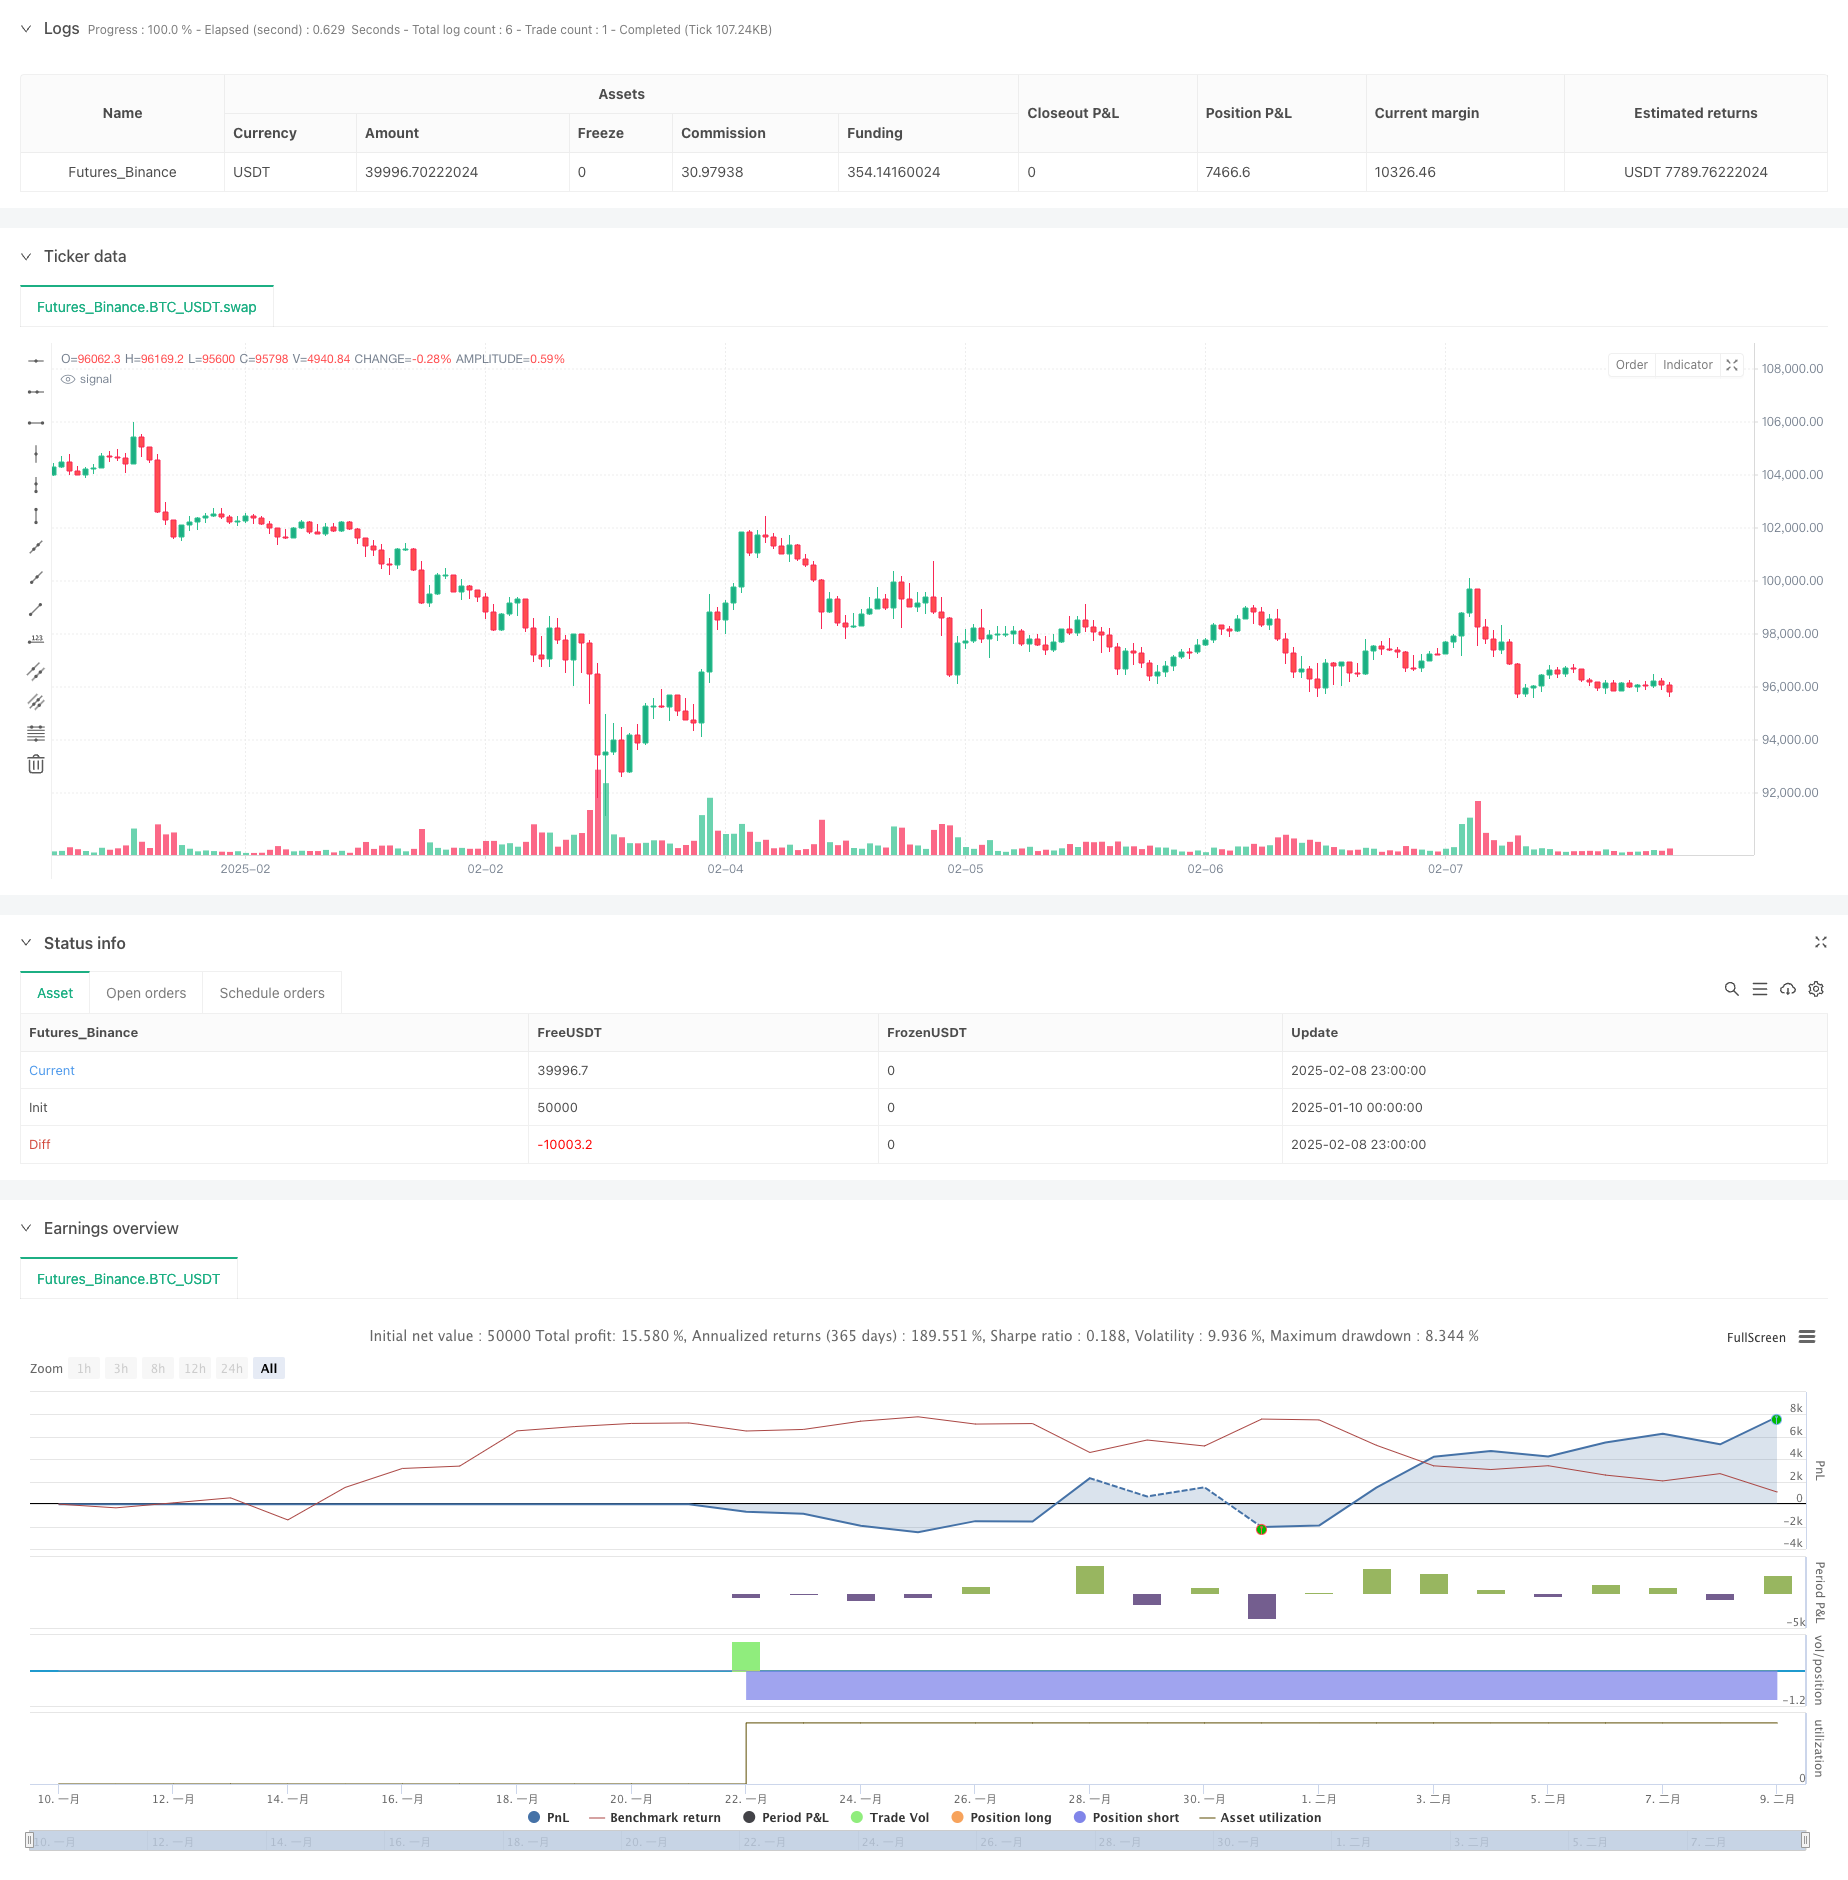
[trans]
概述
这是一个结合了指数移动平均线(EMA)和随机相对强弱指标(Stochastic RSI)的趋势跟踪策略。该策略通过分析价格趋势和超买超卖状态来识别高概率的交易机会。策略利用EMA 9和EMA 21的交叉来确定趋势方向,同时使用Stochastic RSI来确认市场状态,从而提高交易信号的质量。
策略原理
策略的核心逻辑基于两个主要技术指标的组合:
- 双均线系统:使用9周期和21周期的指数移动平均线(EMA)来识别趋势。当快速EMA(9)向上穿越慢速EMA(21)时产生做多信号,反之产生做空信号。
- 随机RSI指标:通过计算RSI值的随机指标来识别超买超卖区域。该指标首先计算14周期的RSI,然后将其转换为随机形式,最后使用3周期的简单移动平均线(SMA)进行平滑处理。
交易信号的触发条件:
- 做多条件:EMA 9向上穿越EMA 21,且Stochastic RSI低于超卖阈值(20)
- 做空条件:EMA 9向下穿越EMA 21,且Stochastic RSI高于超买阈值(80)
- 平仓条件:当出现相反的交易信号时
策略优势
- 信号确认机制:通过结合趋势和动量指标,降低了假突破的风险
- 灵活的参数设置:允许交易者根据不同市场条件调整EMA周期和Stochastic RSI的参数
- 清晰的可视化:策略在价格图表上直接显示EMA线,并在单独面板显示Stochastic RSI,便于分析
- 风险管理:包含了基本的止损和获利机制
- 双重过滤:使用趋势和超买超卖指标作为双重过滤,提高了交易质量
策略风险
- 趋势反转风险:在剧烈波动的市场中,可能会出现虚假的均线交叉信号
- 滞后性问题:移动平均线本质上是滞后指标,可能导致入场时机偏晚
- 横盘市场风险:在无明显趋势的市场中,可能产生频繁的假信号
- 参数敏感性:不同的参数设置可能导致显著不同的结果
- 市场环境依赖:策略在强趋势市场表现较好,但在震荡市场可能表现欠佳
策略优化方向
- 引入波动率过滤:可以添加ATR指标来过滤低波动率环境下的交易信号
- 优化止损机制:实现跟踪止损,可以更好地保护利润
- 增加时间过滤:添加交易时间窗口,避开低流动性期间
- 加入成交量确认:在生成交易信号时考虑成交量因素
- 优化参数自适应:实现参数根据市场状况动态调整的机制
总结
这是一个结构清晰、逻辑严谨的趋势跟踪策略。通过结合EMA和Stochastic RSI,策略在识别趋势和市场状态方面具有较好的平衡性。虽然存在一些固有的风险,但通过合理的参数优化和风险管理,该策略可以在多种市场环境下保持稳定的表现。建议交易者在实盘使用前进行充分的回测,并根据具体市场特点调整参数设置。
||
Overview
This is a trend-following strategy that combines Exponential Moving Averages (EMA) with Stochastic Relative Strength Index (Stochastic RSI). The strategy identifies high-probability trading opportunities by analyzing price trends and overbought/oversold conditions. It utilizes EMA 9 and EMA 21 crossovers to determine trend direction while using Stochastic RSI for market state confirmation to enhance signal quality.
Strategy Principles
The core logic is based on the combination of two main technical indicators:
- Dual EMA System: Uses 9-period and 21-period Exponential Moving Averages to identify trends. Long signals are generated when the fast EMA(9) crosses above the slow EMA(21), and vice versa for short signals.
- Stochastic RSI: Identifies overbought and oversold areas by calculating the stochastic oscillator of RSI values. It first calculates a 14-period RSI, converts it to stochastic form, and then smooths it with a 3-period Simple Moving Average (SMA).
Trading signal conditions:
- Long Entry: EMA 9 crosses above EMA 21 and Stochastic RSI is below the oversold threshold (20)
- Short Entry: EMA 9 crosses below EMA 21 and Stochastic RSI is above the overbought threshold (80)
- Exit: When opposite trading signals occur
Strategy Advantages
- Signal Confirmation: Reduces false breakout risks by combining trend and momentum indicators
- Flexible Parameters: Allows traders to adjust EMA periods and Stochastic RSI parameters for different market conditions
- Clear Visualization: Displays EMAs directly on the price chart and Stochastic RSI in a separate panel for easy analysis
- Risk Management: Includes basic stop-loss and profit-taking mechanisms
- Dual Filtering: Uses trend and overbought/oversold indicators as double filters to improve trade quality
Strategy Risks
- Trend Reversal Risk: False EMA crossover signals may occur in highly volatile markets
- Lag Issues: Moving averages are inherently lagging indicators, potentially leading to delayed entries
- Sideways Market Risk: May generate frequent false signals in markets without clear trends
- Parameter Sensitivity: Different parameter settings can lead to significantly different results
- Market Environment Dependency: Strategy performs well in trending markets but may underperform in ranging markets
Strategy Optimization
- Volatility Filter: Add ATR indicator to filter trades in low volatility environments
- Stop Loss Enhancement: Implement trailing stops for better profit protection
- Time Filter: Add trading time windows to avoid low liquidity periods
- Volume Confirmation: Consider volume factors when generating trading signals
- Adaptive Parameters: Implement dynamic parameter adjustment based on market conditions
Summary
This is a well-structured trend-following strategy with rigorous logic. By combining EMA and Stochastic RSI, the strategy achieves a good balance in identifying trends and market conditions. While there are inherent risks, the strategy can maintain stable performance across various market environments through proper parameter optimization and risk management. Traders are advised to conduct thorough backtesting and adjust parameters according to specific market characteristics before live trading.
[/trans]
Source (PineScript)
/*backtest
start: 2025-01-10 00:00:00
end: 2025-02-09 00:00:00
period: 1h
basePeriod: 1h
exchanges: [{"eid":"Futures_Binance","currency":"BTC_USDT"}]
*/

//@version=5
strategy("EMA 9/21 + Stoch RSI Strategy", shorttitle="EMA+StochRSI", overlay=true)

// ===== Užívateľské vstupy ===== //
emaFastLen     = input.int(9,   "Rýchla EMA (9)")
emaSlowLen     = input.int(21,  "Pomalá EMA (21)")
rsiLen         = input.int(14,  "RSI Length")
stochRsiLen    = input.int(14,  "Stoch RSI Length")     // úsek, z ktorého berieme min/max RSI
stochSignalLen = input.int(3,   "Stoch RSI K/D Smoothing")
overSold       = input.int(20,  "Stoch RSI Oversold (%)")
overBought     = input.int(80,  "Stoch RSI Overbought (%)")

// ===== Výpočet EMA(9) a EMA(21) ===== //
emaFast = ta.ema(close, emaFastLen)
emaSlow = ta.ema(close, emaSlowLen)

// ===== Výpočet RSI a Stoch RSI ===== //
// 1) Klasické RSI
rsiValue = ta.rsi(close, rsiLen)

// 2) Prevod RSI -> Stoch RSI:
//    (rsiValue - min(rsiValue, stochRsiLen)) / (max(rsiValue, stochRsiLen) - min(rsiValue, stochRsiLen)) * 100
//    Následne vyhladíme K a D (podobne ako pri bežnom Stochastic)
rsiLowest  = ta.lowest(rsiValue,  stochRsiLen)
rsiHighest = ta.highest(rsiValue, stochRsiLen)
stochRaw   = (rsiValue - rsiLowest) / math.max(rsiHighest - rsiLowest, 1e-10) * 100.0
stochK     = ta.sma(stochRaw, stochSignalLen)
stochD     = ta.sma(stochK,   stochSignalLen)

// ===== Podmienky pre LONG / SHORT ===== //
// LONG, ak:
//  - EMA(9) prekríži EMA(21) smerom nahor
//  - Stoch RSI je v prepredanej zóne (t.j. stochK < overSold)
longCondition  = ta.crossover(emaFast, emaSlow) and (stochK < overSold)

// SHORT, ak:
//  - EMA(9) prekríži EMA(21) smerom nadol
//  - Stoch RSI je v prekúpenej zóne (stochK > overBought)
shortCondition = ta.crossunder(emaFast, emaSlow) and (stochK > overBought)

// ===== Vstup do pozícií ===== //
if longCondition
    strategy.entry("Long", strategy.long)

if shortCondition
    strategy.entry("Short", strategy.short)

// ===== Výstup z pozície pri opačnom signáli (okamžite na trhu) ===== //
if strategy.position_size > 0 and shortCondition
    // Ak držíme LONG a príde signál na SHORT, zavrieme LONG
    strategy.close("Long", comment="Exit Long")

if strategy.position_size < 0 and longCondition
    // Ak držíme SHORT a príde signál na LONG, zavrieme SHORT
    strategy.close("Short", comment="Exit Short")

// ===== (Nepovinné) Môžeš pridať stop-loss, take-profit, trailing stop atď. ===== //
Detail
https://www.fmz.com/strategy/481394
Last Modified
2025-02-10 16:56:56