
9.2 KiB
Name
双均线与相对强弱混合型自适应策略-Dual-EMA-and-Relative-Strength-Adaptive-Trading-Strategy
Author
ChaoZhang
Strategy Description
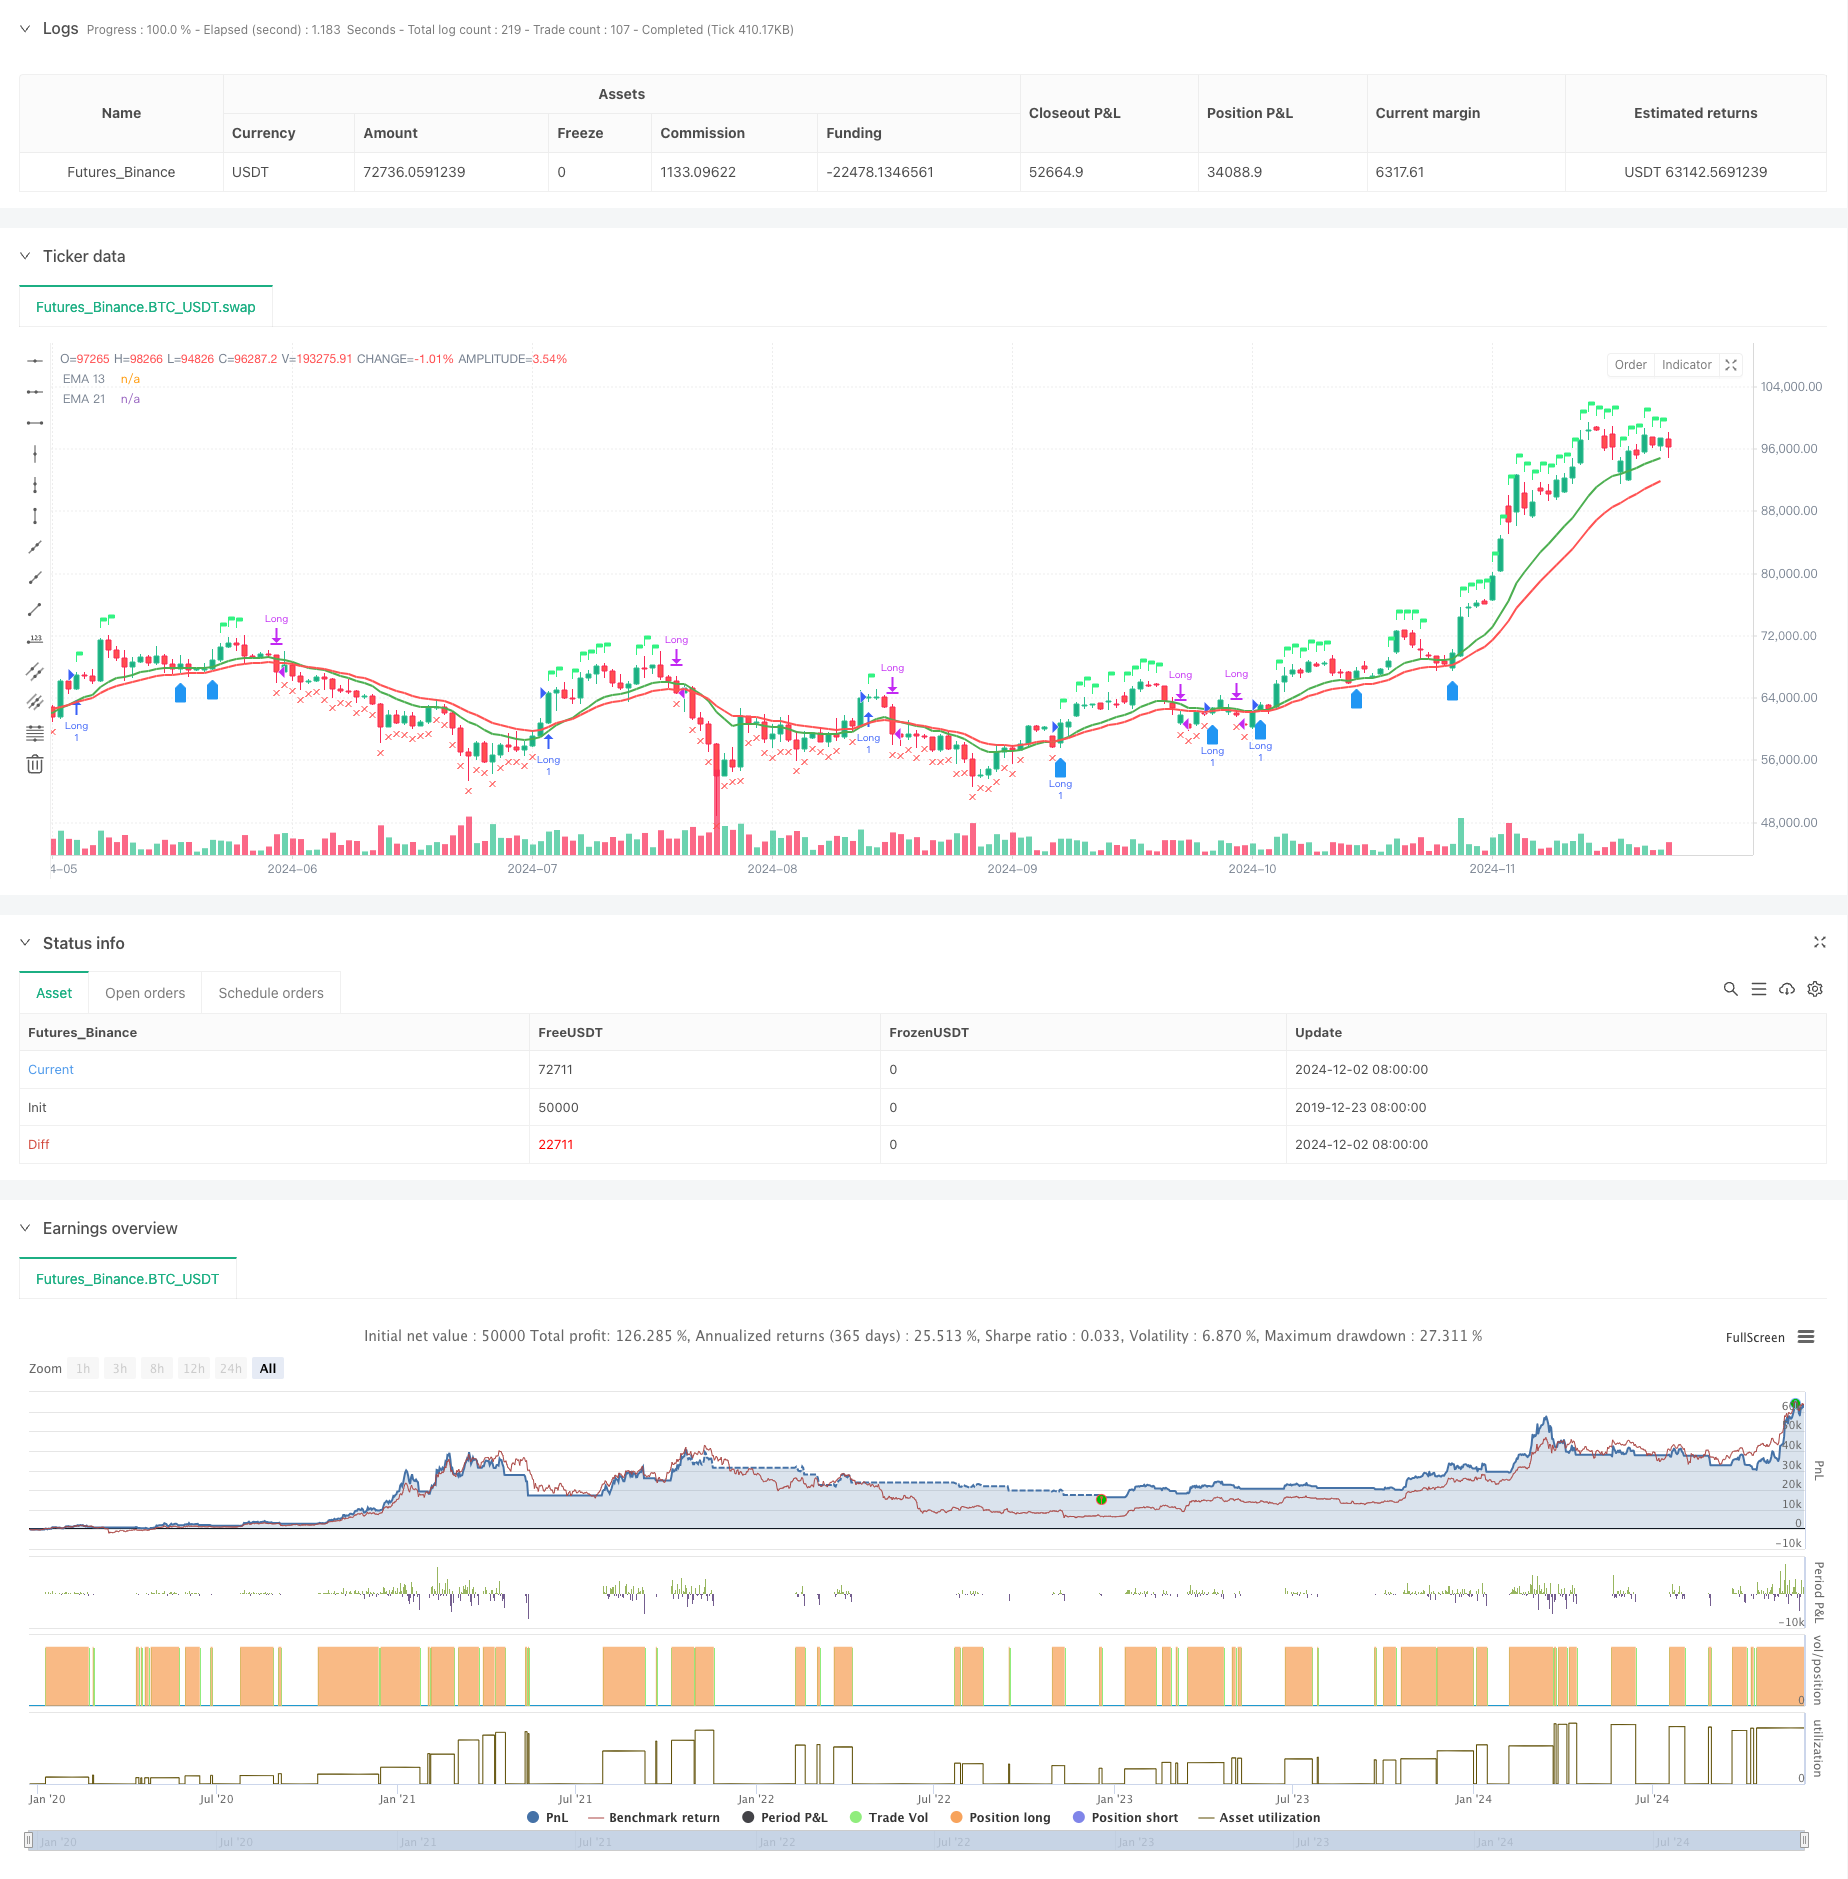
[trans]
概述
本策略是一个结合了双均线系统、相对强弱指标(RSI)和相对强度(RS)分析的综合交易系统。策略通过13日与21日指数移动平均线(EMA)的交叉确认趋势,同时结合RSI和相对于基准指数的RS值进行交易信号的确认,实现了多维度的交易决策机制。该策略还包含了基于52周高点的风险控制机制和重新入场条件的判断。
策略原理
策略采用多重信号确认机制:
- 入场信号需同时满足以下条件:
- EMA13上穿EMA21或价格高于EMA13
- RSI大于60
- 相对强度(RS)为正值
- 退出条件包括:
- 价格跌破EMA21
- RSI低于50
- RS转为负值
- 重新入场条件:
- 价格上穿EMA13且EMA13大于EMA21
- RS保持为正值
- 或价格突破上周高点
策略优势
- 多重信号确认机制降低了假突破风险
- 结合相对强度分析,有效筛选强势品种
- 采用自适应的时间周期调整机制
- 具备完善的风险控制体系
- 包含智能的重新入场机制
- 提供实时的交易状态可视化
策略风险
- 震荡市场可能产生频繁交易
- 依赖多重指标可能导致信号滞后
- 固定的RSI阈值可能不适应所有市场环境
- 相对强度计算依赖基准指数的准确性
- 52周高点止损位可能过于宽松
策略优化方向
- 引入自适应的RSI阈值
- 优化重新入场条件的判断逻辑
- 增加交易量分析维度
- 完善止盈止损机制
- 加入波动率过滤器
- 优化相对强度计算周期
总结
该策略通过结合技术分析和相对强度分析,构建了一个全面的交易系统。其多重信号确认机制和风险控制体系使其具有较强的实用性。通过建议的优化方向,策略还有进一步提升的空间。策略的成功实施需要交易者对市场有深入的理解,并根据具体交易品种特点进行适当的参数调整。 ||
Overview
This strategy is a comprehensive trading system that combines a dual EMA system, Relative Strength Index (RSI), and Relative Strength (RS) analysis. The strategy confirms trends through the crossover of 13-day and 21-day Exponential Moving Averages (EMA) while utilizing RSI and RS values relative to a benchmark index for signal confirmation, implementing a multi-dimensional trading decision mechanism. It also includes risk control mechanisms based on 52-week highs and re-entry condition judgments.
Strategy Principles
The strategy employs a multiple signal confirmation mechanism:
- Entry signals require the following conditions:
- EMA13 crosses above EMA21 or price above EMA13
- RSI above 60
- Positive Relative Strength (RS)
- Exit conditions include:
- Price falls below EMA21
- RSI below 50
- RS turns negative
- Re-entry conditions:
- Price crosses above EMA13 and EMA13 above EMA21
- RS remains positive
- Or price breaks above last week's high
Strategy Advantages
- Multiple signal confirmation reduces false breakout risks
- Integration of relative strength analysis effectively filters strong performers
- Adopts adaptive timeframe adjustment mechanism
- Comprehensive risk control system
- Intelligent re-entry mechanism
- Real-time trade status visualization
Strategy Risks
- Potential frequent trading in choppy markets
- Multiple indicators may lead to lagging signals
- Fixed RSI thresholds may not suit all market conditions
- RS calculation depends on benchmark index accuracy
- 52-week high stop-loss might be too loose
Strategy Optimization Directions
- Introduction of adaptive RSI thresholds
- Optimization of re-entry condition logic
- Addition of volume analysis dimension
- Enhancement of profit-taking and stop-loss mechanisms
- Implementation of volatility filters
- Optimization of relative strength calculation periods
Summary
The strategy builds a comprehensive trading system by combining technical analysis and relative strength analysis. Its multiple signal confirmation mechanism and risk control system make it highly practical. Through the suggested optimization directions, there is room for further improvement. Successful implementation requires traders to have a deep understanding of the market and make appropriate parameter adjustments based on specific trading instrument characteristics.[/trans]
Source (PineScript)
/*backtest
start: 2019-12-23 08:00:00
end: 2024-12-03 00:00:00
period: 1d
basePeriod: 1d
exchanges: [{"eid":"Futures_Binance","currency":"BTC_USDT"}]
*/

//@version=5
strategy("EMA 13 & 21 Entry Exit", overlay=true)

// Define the EMAs
ema13 = ta.ema(close, 13)
ema21 = ta.ema(close, 21)

// Define the RSI
rsi = ta.rsi(close, 14)

// Calculate the closing price relative to Nifty 50
//nifty50 = request.security("NSE:NIFTY", timeframe.period, close)
//closeRelative = close / nifty50

// Define a base period (e.g., 123) and adjust it based on the timeframe
//basePeriod = 123

// Calculate the effective period based on the timeframe
//effectivePeriod = basePeriod * (timeframe.isintraday ? (60 / timeframe.multiplier) : 1)

// Calculate the EMA
//rs = ta.ema(closeRelative, effectivePeriod)

// Define the Relative Strength with respect to NIFTY 50
nifty50 = request.security("swap", "D", close)
rs = ta.ema(close / nifty50, 55 )

// Define the previous 2-week low and last week's high
twoWeekLow = ta.lowest(low, 10)  // 10 trading days roughly equal to 2 weeks
lastWeekHigh = ta.highest(high, 5)  // 5 trading days roughly equal to 1 week
fiftytwoWeekhigh = ta.highest(high, 52*5) // 252 tradingdays roughly equal to 52 week.

// Long condition: EMA 21 crossing above EMA 55, price above EMA 21, RSI > 50, and RS > 0
longCondition = ta.crossover(ema13, ema21) or close > ema13 and rsi > 60 and rs > 0

// Exit condition: Price closing below EMA 55 or below the previous 2-week low
exitCondition = close < ema21 or rsi < 50 or rs < 0 //or close < fiftytwoWeekhigh*0.80

// Re-entry condition: Price crossing above EMA 21 after an exit, EMA 21 > EMA 55, and RS > 1
reEntryCondition = ta.crossover(close, ema13) and ema13 > ema21 and rs > 0

// Re-entry condition if trailing stop loss is hit: Price crossing above last week's high
reEntryAfterSL = ta.crossover(close, lastWeekHigh)

// Plot the EMAs
plot(ema13 ,color=color.green, title="EMA 13",linewidth = 2)
plot(ema21, color=color.red, title="EMA 21",linewidth = 2)


// Plot buy and sell signals
plotshape(series=longCondition, location=location.abovebar, color=color.rgb(50, 243, 130), style=shape.flag, title="Buy Signal")
plotshape(series=exitCondition, location=location.belowbar, color=color.red, style=shape.xcross, title="Sell Signal")
plotshape(series=reEntryCondition or reEntryAfterSL, location=location.belowbar, color=color.blue, style=shape.labelup, title="Re-entry Signal")
//plotshape(series = fiftytwoWeekhigh,location=location.abovebar, color=color.blue,style=shape.flag, title="52WH")

// Plot background color for RS > 0
//bgcolor(rs > 0 ? color.new(color.green, 90) : na, title="RS Positive Background")
// Plot the previous 2-week low and last week's high
// plot(twoWeekLow, color=color.orange, title="2-Week Low")
// plot(lastWeekHigh, color=color.purple, title="Last Week High")

// Strategy logic
if (longCondition or reEntryCondition or reEntryAfterSL)
    strategy.entry("Long", strategy.long)

if (exitCondition)
    strategy.close("Long")

 // Calculate Stop Loss (SL) and Profit
var float entryPrice = na
var float stopLoss = na
var float profit = na

if (strategy.opentrades > 0)
    entryPrice := strategy.opentrades.entry_price(strategy.opentrades - 1)
    stopLoss := fiftytwoWeekhigh * 0.80
    profit := (close - entryPrice) / entryPrice * 100

// Display the strategy table
var table strategyTable = table.new(position.top_right, 4, 2, border_width = 1)

// Make the table movable
tableX = input.int(0, title="Table X Position")
tableY = input.int(0, title="Table Y Position")

// Add size options for the table
tableSize = input.string("small", title="Table Size", options=["tiny", "small", "large"])

// Adjust table size based on user input
tableWidth = tableSize == "tiny" ? 2 : tableSize == "small" ? 4 : 6
tableHeight = tableSize == "tiny" ? 1 : tableSize == "small" ? 2 : 3

// Create the table with the specified size
//table = table.new(position.top_right, tableWidth, tableHeight, border_width = 1)

// Position the table based on user input
// table.cell(strategyTable, tableX, tableY, "Entry Price",  bgcolor=#18eef9)
// table.cell(strategyTable, tableX, tableY + 1, str.tostring(entryPrice, format.mintick), bgcolor=#18eef9)
// table.cell(strategyTable, tableX + 1, tableY, "Stop Loss (20%)", bgcolor=color.red)
// table.cell(strategyTable, tableX + 1, tableY + 1, str.tostring(stopLoss, format.mintick), bgcolor=color.red)
// table.cell(strategyTable, tableX + 2, tableY, "Profit (%)", bgcolor=color.green)
// table.cell(strategyTable, tableX + 2, tableY + 1, str.tostring(profit, format.percent), bgcolor=color.green)
Detail
https://www.fmz.com/strategy/473940
Last Modified
2024-12-04 15:29:05