
8.1 KiB
Name
双周期RSI趋势动量强度策略结合金字塔式仓位管理系统-Dual-Period-RSI-Trend-Momentum-Strategy-with-Pyramiding-Position-Management-System
Author
ChaoZhang
Strategy Description
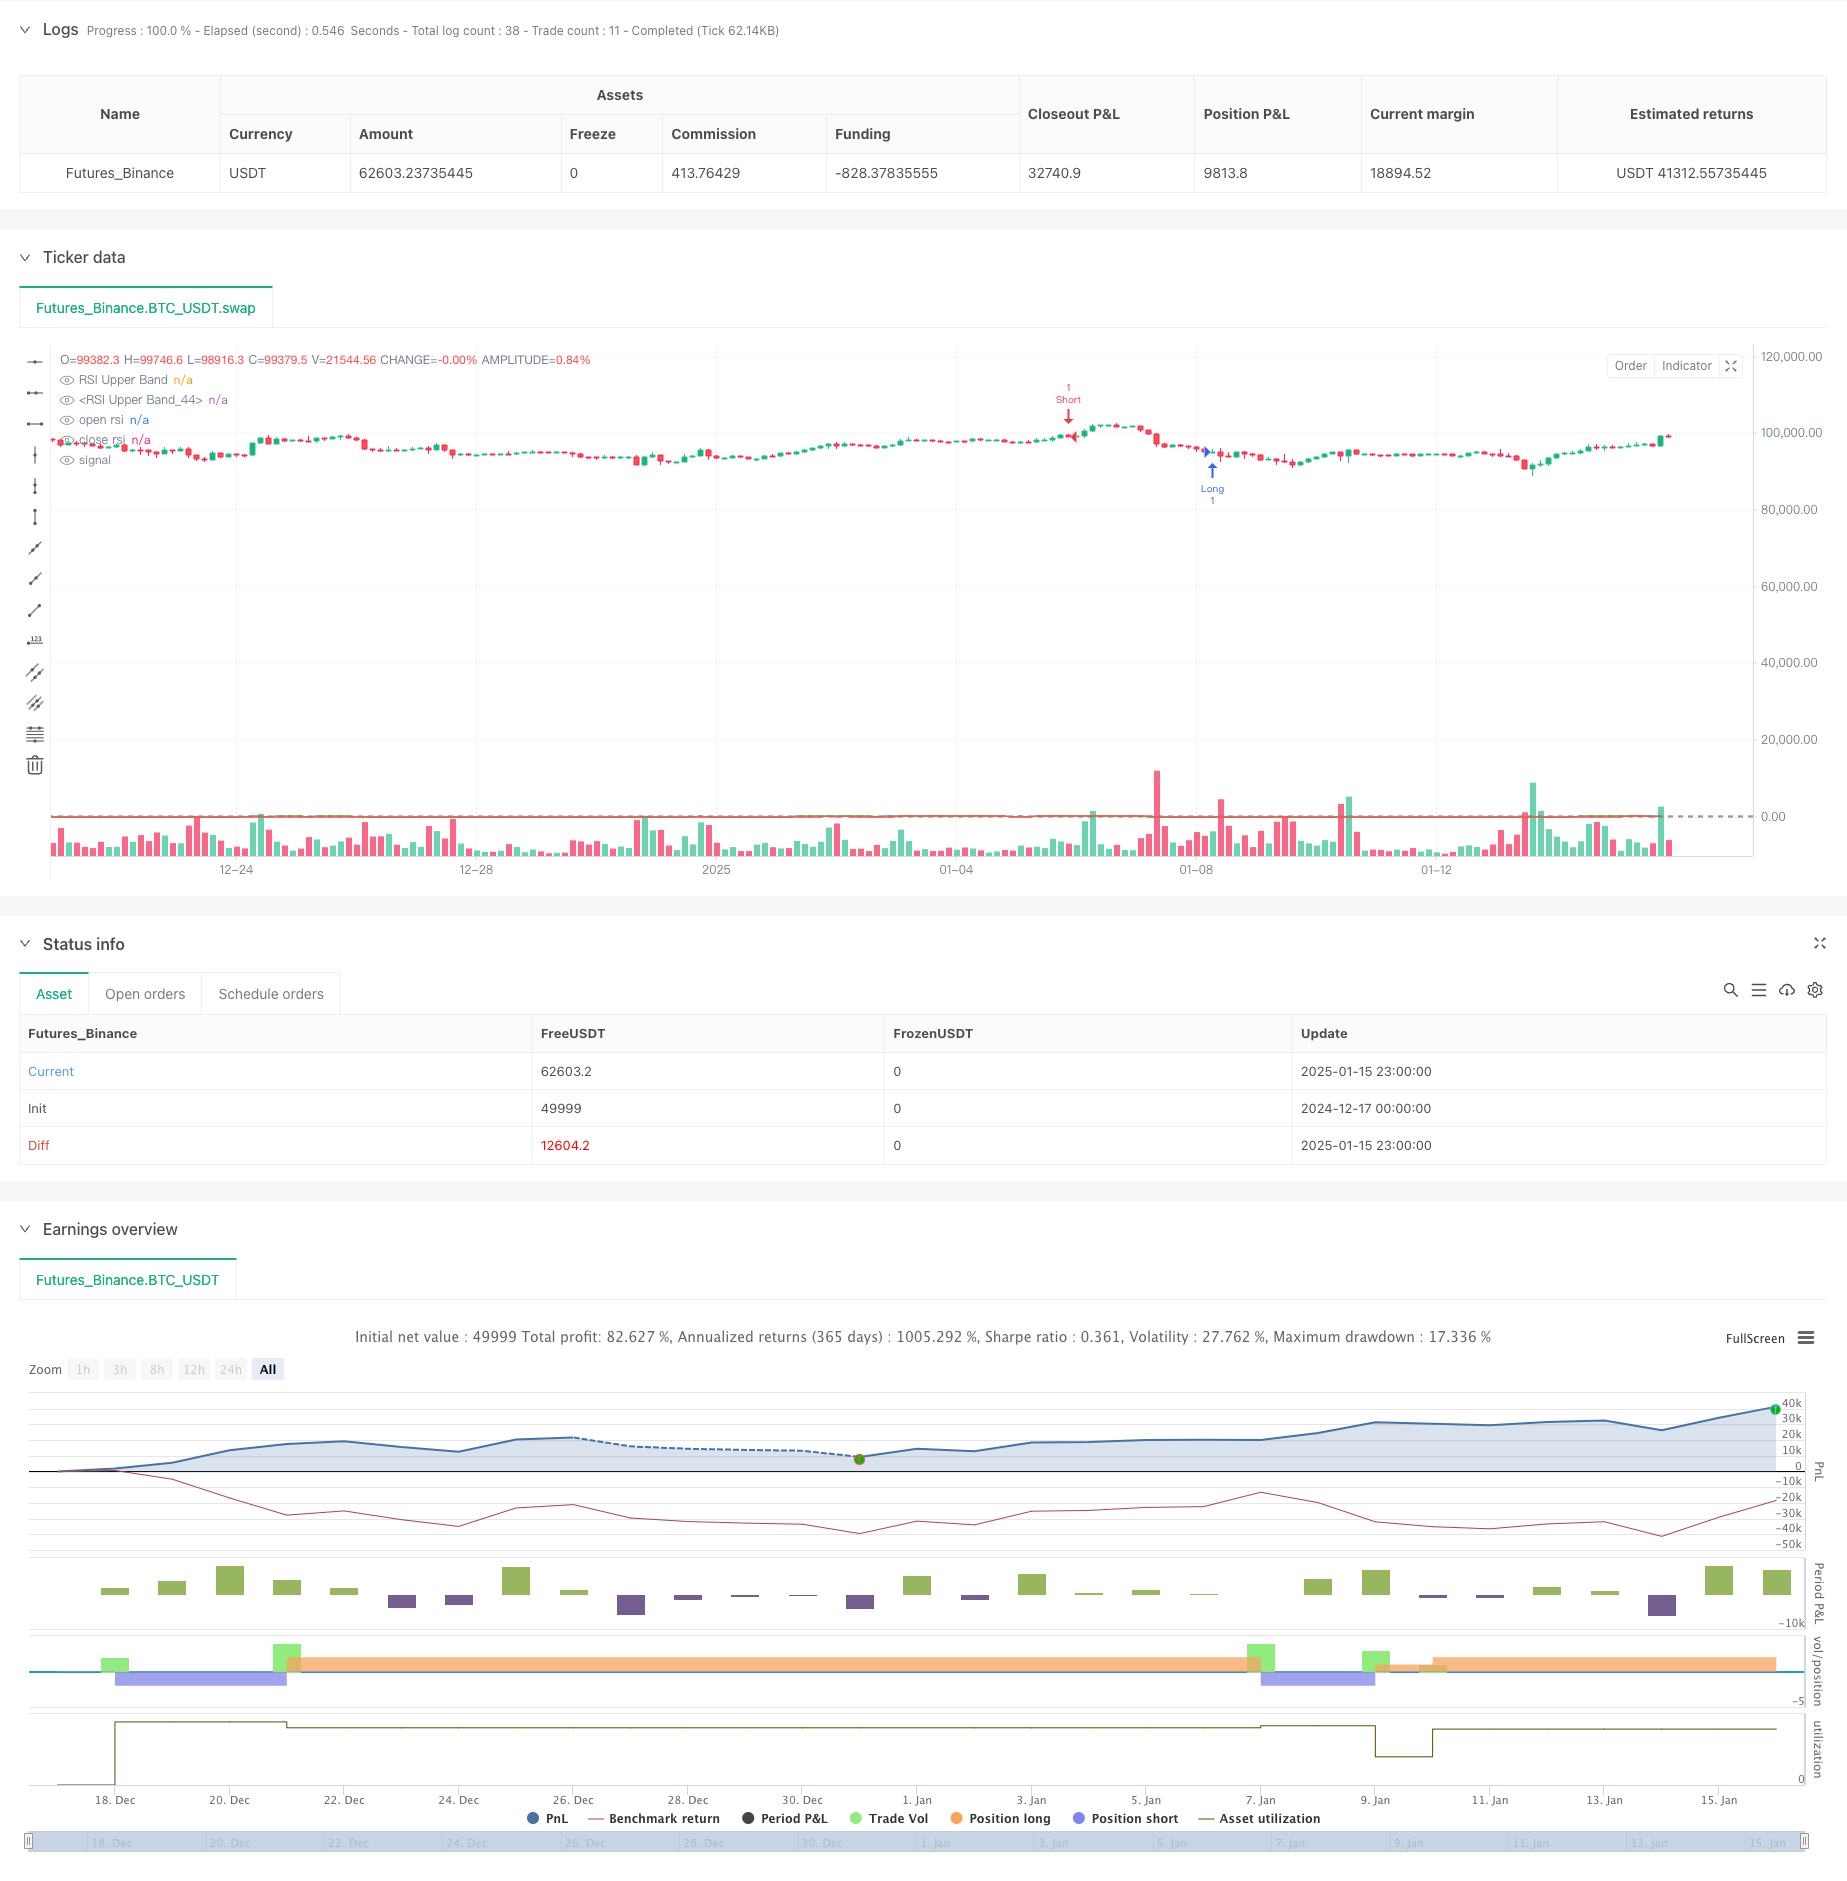
[trans]
概述
本策略是一个基于双周期RSI(相对强弱指标)的趋势跟踪交易系统,结合了金字塔式加仓管理。策略通过对比两个不同周期(14和30)的RSI指标,在趋势初期介入并在趋势延续时通过限价单进行加仓,实现对趋势的最大化把握。系统设计了完整的风险控制机制,包括仓位管理和动态平仓条件。
策略原理
策略采用双周期RSI交叉信号作为交易触发条件,并结合金字塔式加仓管理。具体来说:
- 入场信号:使用14周期RSI突破超卖(30)和超买(70)水平作为开仓信号
- 加仓管理:在开仓后通过设定价格偏离1.5%的限价单实现二次加仓
- 平仓信号:使用30周期RSI作为平仓指标,当RSI从超买区回落或从超卖区反弹时触发平仓
- 仓位控制:系统允许最多持有两个头寸(pyramiding=2),每次开仓数量可独立设置
策略优势
- 趋势把握能力强:通过双周期RSI的配合,能够更好地识别和跟踪中长期趋势
- 风险收益比优化:采用金字塔式加仓策略,在趋势确立后通过加仓放大收益
- 灵活的仓位管理:可以根据市场情况和资金量调整开仓和加仓数量
- 动态止损设计:使用长周期RSI作为平仓指标,避免过早离场
- 参数可调性强:主要参数都可以根据不同市场特征进行优化调整
策略风险
- 震荡市场风险:在区间震荡市场中可能频繁进出导致损失
- 滑点风险:加仓订单采用限价单执行,在剧烈行情中可能错过最佳加仓时机
- 资金管理风险:双倍仓位可能带来较大的回撤
- 趋势反转风险:RSI指标具有一定滞后性,可能在趋势反转时未能及时止损
- 参数优化风险:过度优化可能导致策略在实盘中表现不佳
策略优化方向
- 引入趋势过滤器:可以添加均线或者ADX等趋势指标,提高入场信号的可靠性
- 优化仓位管理:可以设计动态的仓位管理系统,根据波动率调整开仓数量
- 完善止损机制:考虑添加跟踪止损或者基于ATR的止损方案
- 增加市场环境过滤:引入波动率指标,在不同市场环境下调整策略参数
- 改进加仓逻辑:可以基于波动率动态调整加仓价格偏离度
总结
该策略通过双周期RSI和金字塔式加仓的结合,实现了对趋势的良好把握。策略设计了完整的交易系统,包括入场、加仓、止损和仓位管理等关键要素。通过参数优化和风险管理的改进,策略有望在实际交易中取得稳定表现。建议交易者在实盘使用前,充分测试并根据具体市场特征调整参数。 ||
Overview
This strategy is a trend-following trading system based on dual-period RSI (Relative Strength Index) combined with pyramiding position management. The strategy compares RSI indicators of two different periods (14 and 30) to enter trades at trend initiation and adds positions through limit orders during trend continuation, maximizing trend capture. The system includes comprehensive risk control mechanisms, including position management and dynamic exit conditions.
Strategy Principle
The strategy employs dual-period RSI crossover signals as trading triggers combined with pyramiding position management. Specifically:
- Entry signals: Uses 14-period RSI breakthrough of oversold (30) and overbought (70) levels as entry signals
- Position adding: Implements secondary position adding through limit orders set at 1.5% price deviation after initial entry
- Exit signals: Uses 30-period RSI as exit indicator, triggering closure when RSI falls from overbought or rebounds from oversold zones
- Position control: System allows maximum of two positions (pyramiding=2) with independently configurable entry quantities
Strategy Advantages
- Strong trend capture: Better identifies and tracks medium to long-term trends through dual-period RSI coordination
- Optimized risk-reward ratio: Uses pyramiding strategy to amplify returns after trend confirmation
- Flexible position management: Adjustable entry and additional position sizes based on market conditions and capital
- Dynamic stop-loss design: Uses long-period RSI as exit indicator to avoid premature exits
- Strong parameter adaptability: Key parameters can be optimized for different market characteristics
Strategy Risks
- Choppy market risk: May incur losses from frequent trading in range-bound markets
- Slippage risk: Additional position orders using limit orders may miss optimal entry timing in volatile markets
- Capital management risk: Double positions may lead to significant drawdowns
- Trend reversal risk: RSI indicator's inherent lag may delay stop-loss execution during trend reversals
- Parameter optimization risk: Over-optimization may lead to poor real-trading performance
Strategy Optimization Directions
- Introduce trend filters: Add moving averages or ADX indicators to improve entry signal reliability
- Optimize position management: Design dynamic position sizing system based on volatility
- Enhance stop-loss mechanism: Consider adding trailing stops or ATR-based stop-loss solutions
- Add market environment filters: Incorporate volatility indicators to adjust strategy parameters in different market conditions
- Improve position adding logic: Dynamically adjust position addition price deviation based on volatility
Summary
The strategy achieves effective trend capture through the combination of dual-period RSI and pyramiding positions. It implements a complete trading system including entry, position adding, stop-loss, and position management elements. Through parameter optimization and risk management improvements, the strategy shows promise for stable performance in actual trading. Traders are advised to thoroughly test and adjust parameters according to specific market characteristics before live implementation.[/trans]
Source (PineScript)
/*backtest
start: 2024-12-17 00:00:00
end: 2025-01-16 00:00:00
period: 3h
basePeriod: 3h
exchanges: [{"eid":"Futures_Binance","currency":"BTC_USDT","balance":49999}]
*/

//@version=5
strategy("RSI Top Strategy", overlay=true, pyramiding=2)

qty1 = input( 1 , "Qty first entry", group="Strategy settings")
qty2 = input( 1 , "Qty second entry", group="Strategy settings")
avg1 = input.float( 1.5 , "% averaging ", group="Strategy settings")

overSold = input( 30 , group="open RSI Settings")
overBought = input( 70 , group="open RSI Settings")
rsi1len = input.int(14, minval=1, title="open RSI Length", group="open RSI Settings")

overSold2 = input( 30 , group="close RSI Settings")
overBought2 = input( 70 , group="close RSI Settings")
rsi2len = input.int(30, minval=1, title="close RSI Length", group="close RSI Settings")

price = close
vrsi = ta.rsi(price, rsi1len)
vrsi2 = ta.rsi(price, rsi2len)

sz=strategy.position_size

co = ta.crossover(vrsi, overSold)
cu = ta.crossunder(vrsi, overBought)
if (not na(vrsi))
	if (co) and not (sz>0)
		strategy.entry("Long", strategy.long, qty = qty1, comment="Long")
		Avgl=close-close*0.01*avg1
		strategy.entry("AvgL", strategy.long, qty = qty2, limit=Avgl, comment="AvgL")
	if (cu) and not (sz<0)
		strategy.entry("Short", strategy.short, qty = qty1, comment="Short")
		Avgs=close+close*0.01*avg1
		strategy.entry("AvgS", strategy.short, qty = qty2, limit=Avgs, comment="AvgS")
//plot(strategy.equity, title="equity", color=color.red, linewidth=2, style=plot.style_areabr)

if sz[1]<0 and sz<0 and vrsi2<overBought2 and vrsi2[1]>=overBought2
    strategy.close_all("x")
if sz[1]>0 and sz>0 and vrsi2>overSold2  and vrsi2[1]<=overSold2
    strategy.close_all("x")

plot(vrsi,'open rsi',color=color.green)
plot(vrsi2,'close rsi',color=color.red)

hline(overBought, "RSI Upper Band", color=#787B86)
hline(overSold, "RSI Upper Band", color=#787B86)
Detail
https://www.fmz.com/strategy/478739
Last Modified
2025-01-17 16:22:28