
6.9 KiB
Name
双向MACD动量与EMA趋势判定交易策略-Bidirectional-MACD-Momentum-and-EMA-Trend-Trading-Strategy
Author
ianzeng123
Strategy Description
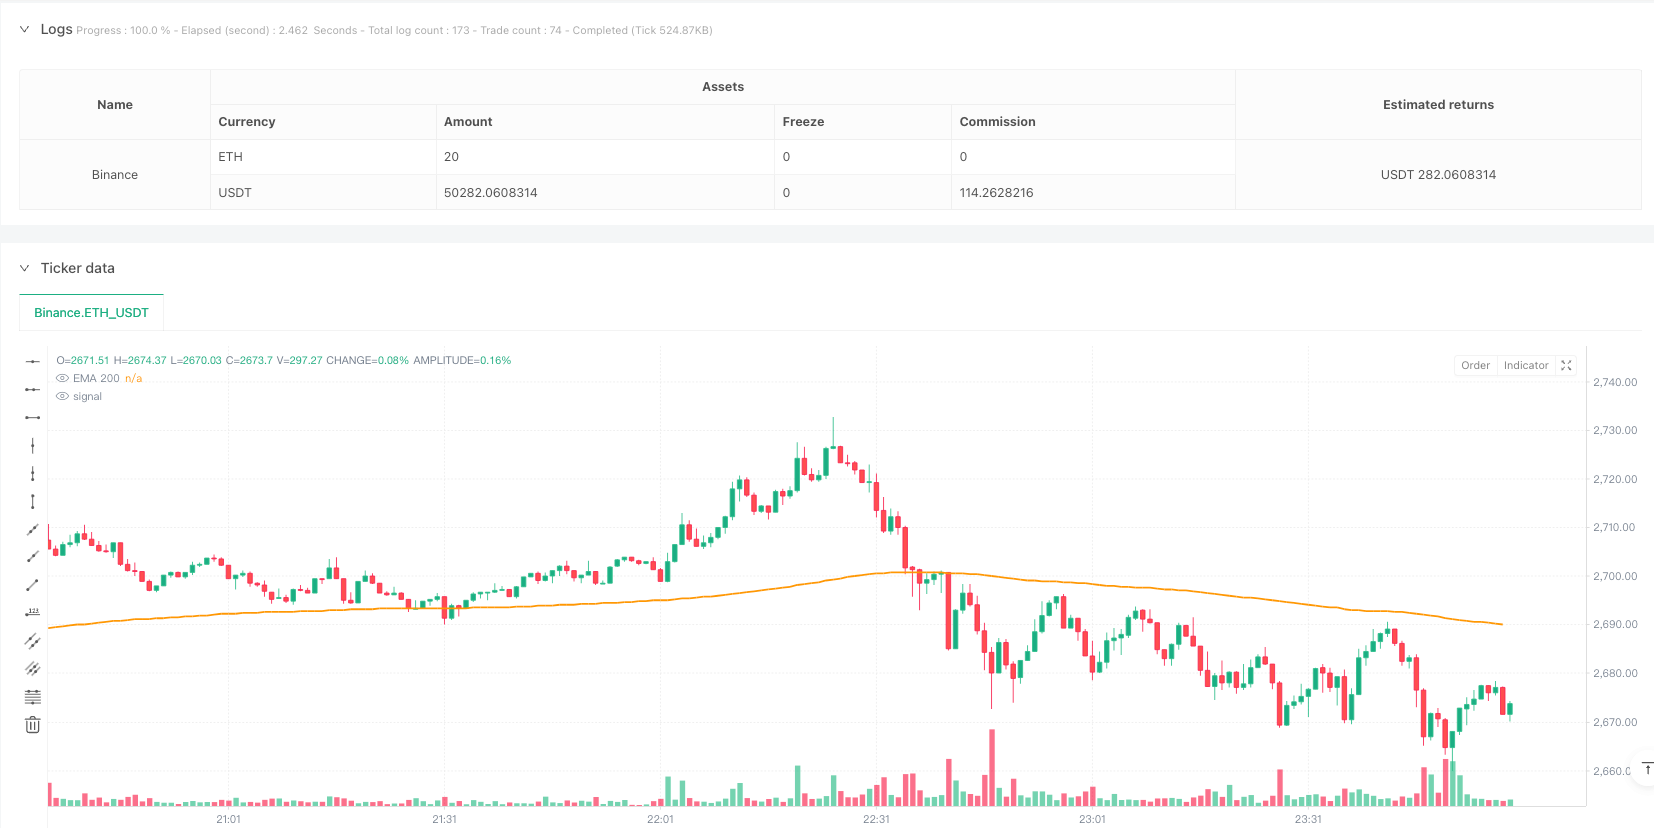
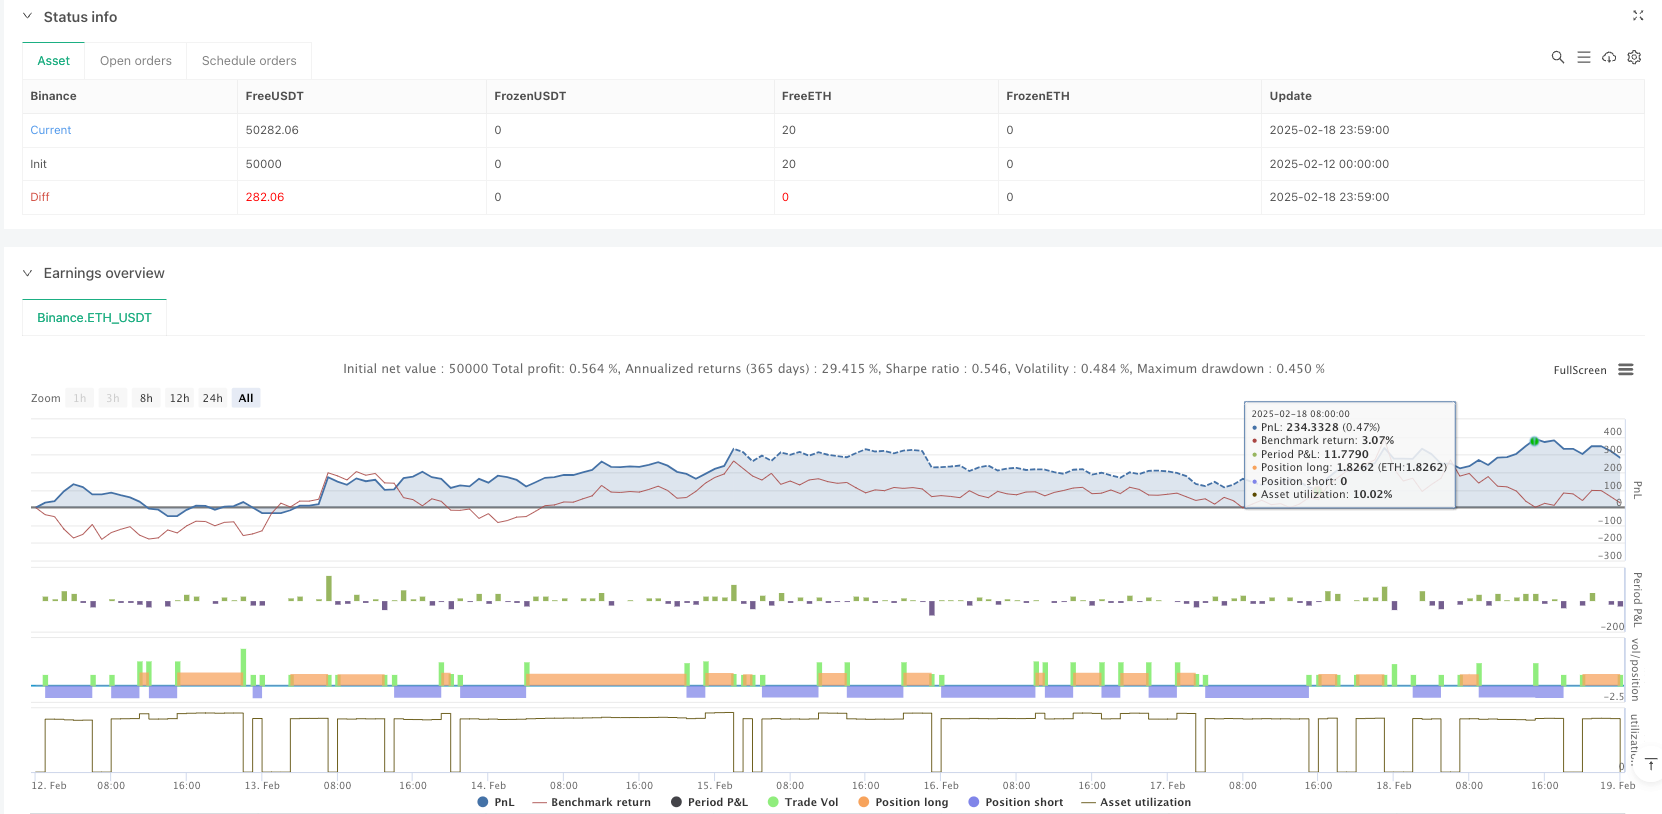
[trans]
概述
该策略是一个结合了MACD动量指标和EMA均线的双向交易系统。它主要基于MACD指标的交叉信号和价格相对于EMA(200)的位置来判断入场时机。策略采用了2:1的风险收益比,可以在5分钟时间周期上运行,并且支持灵活的参数调整。
策略原理
策略的核心逻辑基于以下几个关键条件:
- 多头入场条件:
- 价格位于EMA(200)之上
- MACD线从下方穿越信号线
- MACD值位于零线下方
- 空头入场条件:
- 价格位于EMA(200)之下
- MACD线从上方穿越信号线
- MACD值位于零线上方
- 风险管理采用预设的止损和止盈比率,默认为1:2
策略优势
- 逻辑清晰简单,易于理解和实施
- 结合了趋势和动量指标,提供了更可靠的交易信号
- 具有灵活的参数设置,可以根据不同市场条件进行优化
- 支持双向交易,可以充分把握市场机会
- 内置风险管理机制,有助于保护资金安全
策略风险
- 在横盘市场可能产生频繁的假信号
- 固定的止损止盈比率可能不适合所有市场环境
- 对市场波动性变化比较敏感
- 频繁交易可能导致较高的手续费支出
- 在快速行情中可能错过部分机会
策略优化方向
- 引入波动率指标来动态调整止损和止盈水平
- 增加交易量确认信号,提高入场质量
- 添加市场环境过滤器,避免在不利条件下交易
- 实现动态的参数优化系统
- 加入时间过滤器,避免在低流动性时期交易
总结
这是一个设计合理的策略系统,通过结合技术指标提供了相对可靠的交易信号。虽然存在一些潜在风险,但通过合理的优化和风险管理,该策略具有良好的实战应用潜力。建议在实盘使用前进行充分的回测,并根据具体市场情况调整参数。 ||
Overview
This strategy is a bidirectional trading system that combines MACD momentum indicator with EMA trend analysis. It primarily bases entry decisions on MACD crossover signals and price position relative to EMA(200). The strategy employs a 2:1 risk-reward ratio, can operate on a 5-minute timeframe, and supports flexible parameter adjustment.
Strategy Principles
The core logic is based on the following key conditions:
- Long Entry Conditions:
- Price above EMA(200)
- MACD line crosses signal line from below
- MACD value below zero line
- Short Entry Conditions:
- Price below EMA(200)
- MACD line crosses signal line from above
- MACD value above zero line
- Risk management uses preset stop-loss and take-profit ratios, defaulting to 1:2
Strategy Advantages
- Clear and simple logic, easy to understand and implement
- Combines trend and momentum indicators for more reliable trading signals
- Features flexible parameter settings for optimization across different market conditions
- Supports bidirectional trading to capture market opportunities
- Built-in risk management mechanism helps protect capital
Strategy Risks
- May generate frequent false signals in ranging markets
- Fixed stop-loss and take-profit ratios might not suit all market conditions
- Sensitive to changes in market volatility
- Frequent trading may result in high commission costs
- Might miss some opportunities in fast-moving markets
Strategy Optimization Directions
- Introduce volatility indicators for dynamic adjustment of stop-loss and take-profit levels
- Add volume confirmation signals to improve entry quality
- Implement market environment filters to avoid trading under unfavorable conditions
- Develop dynamic parameter optimization system
- Add time filters to avoid trading during low liquidity periods
Summary
This is a well-designed strategy system that provides relatively reliable trading signals through the combination of technical indicators. While there are some potential risks, the strategy shows good practical application potential through proper optimization and risk management. It is recommended to conduct thorough backtesting before live trading and adjust parameters according to specific market conditions.[/trans]
Source (PineScript)
/*backtest
start: 2025-02-12 00:00:00
end: 2025-02-19 00:00:00
period: 1m
basePeriod: 1m
exchanges: [{"eid":"Binance","currency":"ETH_USDT"}]
*/

// This Pine Script™ code is subject to the terms of the Mozilla Public License 2.0 at https://mozilla.org/MPL/2.0/
// © @DieBartDie

//@version=5
strategy("Strategy with MACD and EMA", overlay=true, default_qty_type=strategy.percent_of_equity, default_qty_value=10)

// Editable parameters
ema_length = input.int(200, title="EMA Length")
tp_ratio = input.float(2.0, title="Take Profit Ratio (%)") // Take Profit ratio
sl_ratio = input.float(1.0, title="Stop Loss Ratio (%)")   // Stop Loss ratio

// MACD configuration
fast_length = input.int(12, title="MACD Fast Length")
slow_length = input.int(26, title="MACD Slow Length")
signal_length = input.int(9, title="MACD Signal Length")

// Operation type configuration
operation_type = input.string("Long & Short", title="Operation Type", options=["Long", "Short", "Long & Short"])

// Indicators
ema_200 = ta.ema(close, ema_length)
[macd, signal, _] = ta.macd(close, fast_length, slow_length, signal_length)

// Conditions for LONG entries
price_above_ema = close > ema_200
macd_above_signal = ta.crossover(macd, signal) // MACD crosses above the signal line
macd_below_zero = macd < 0
long_condition = price_above_ema and macd_above_signal and macd_below_zero

// Conditions for SHORT entries
price_below_ema = close < ema_200
macd_below_signal = ta.crossunder(macd, signal) // MACD crosses below the signal line
macd_above_zero = macd > 0
short_condition = price_below_ema and macd_below_signal and macd_above_zero

// Calculate Stop Loss and Take Profit
stop_loss_long = close * (1 - sl_ratio / 100)
take_profit_long = close * (1 + tp_ratio / 100)
stop_loss_short = close * (1 + sl_ratio / 100)
take_profit_short = close * (1 - tp_ratio / 100)

// Execute LONG position if conditions are met
if (operation_type == "Long" or operation_type == "Long & Short") and long_condition
    strategy.entry("Long", strategy.long)
    strategy.exit("Take Profit/Stop Loss", "Long", stop=stop_loss_long, limit=take_profit_long)

// Execute SHORT position if conditions are met
if (operation_type == "Short" or operation_type == "Long & Short") and short_condition
    strategy.entry("Short", strategy.short)
    strategy.exit("Take Profit/Stop Loss", "Short", stop=stop_loss_short, limit=take_profit_short)

// Plot the EMA
plot(ema_200, color=color.orange, linewidth=2, title="EMA 200")
Detail
https://www.fmz.com/strategy/482872
Last Modified
2025-02-20 15:58:38