
12 KiB
Name
双信号趋势跟踪策略Dual-Signal-Trend-Tracking-Strategy
Author
ChaoZhang
Strategy Description
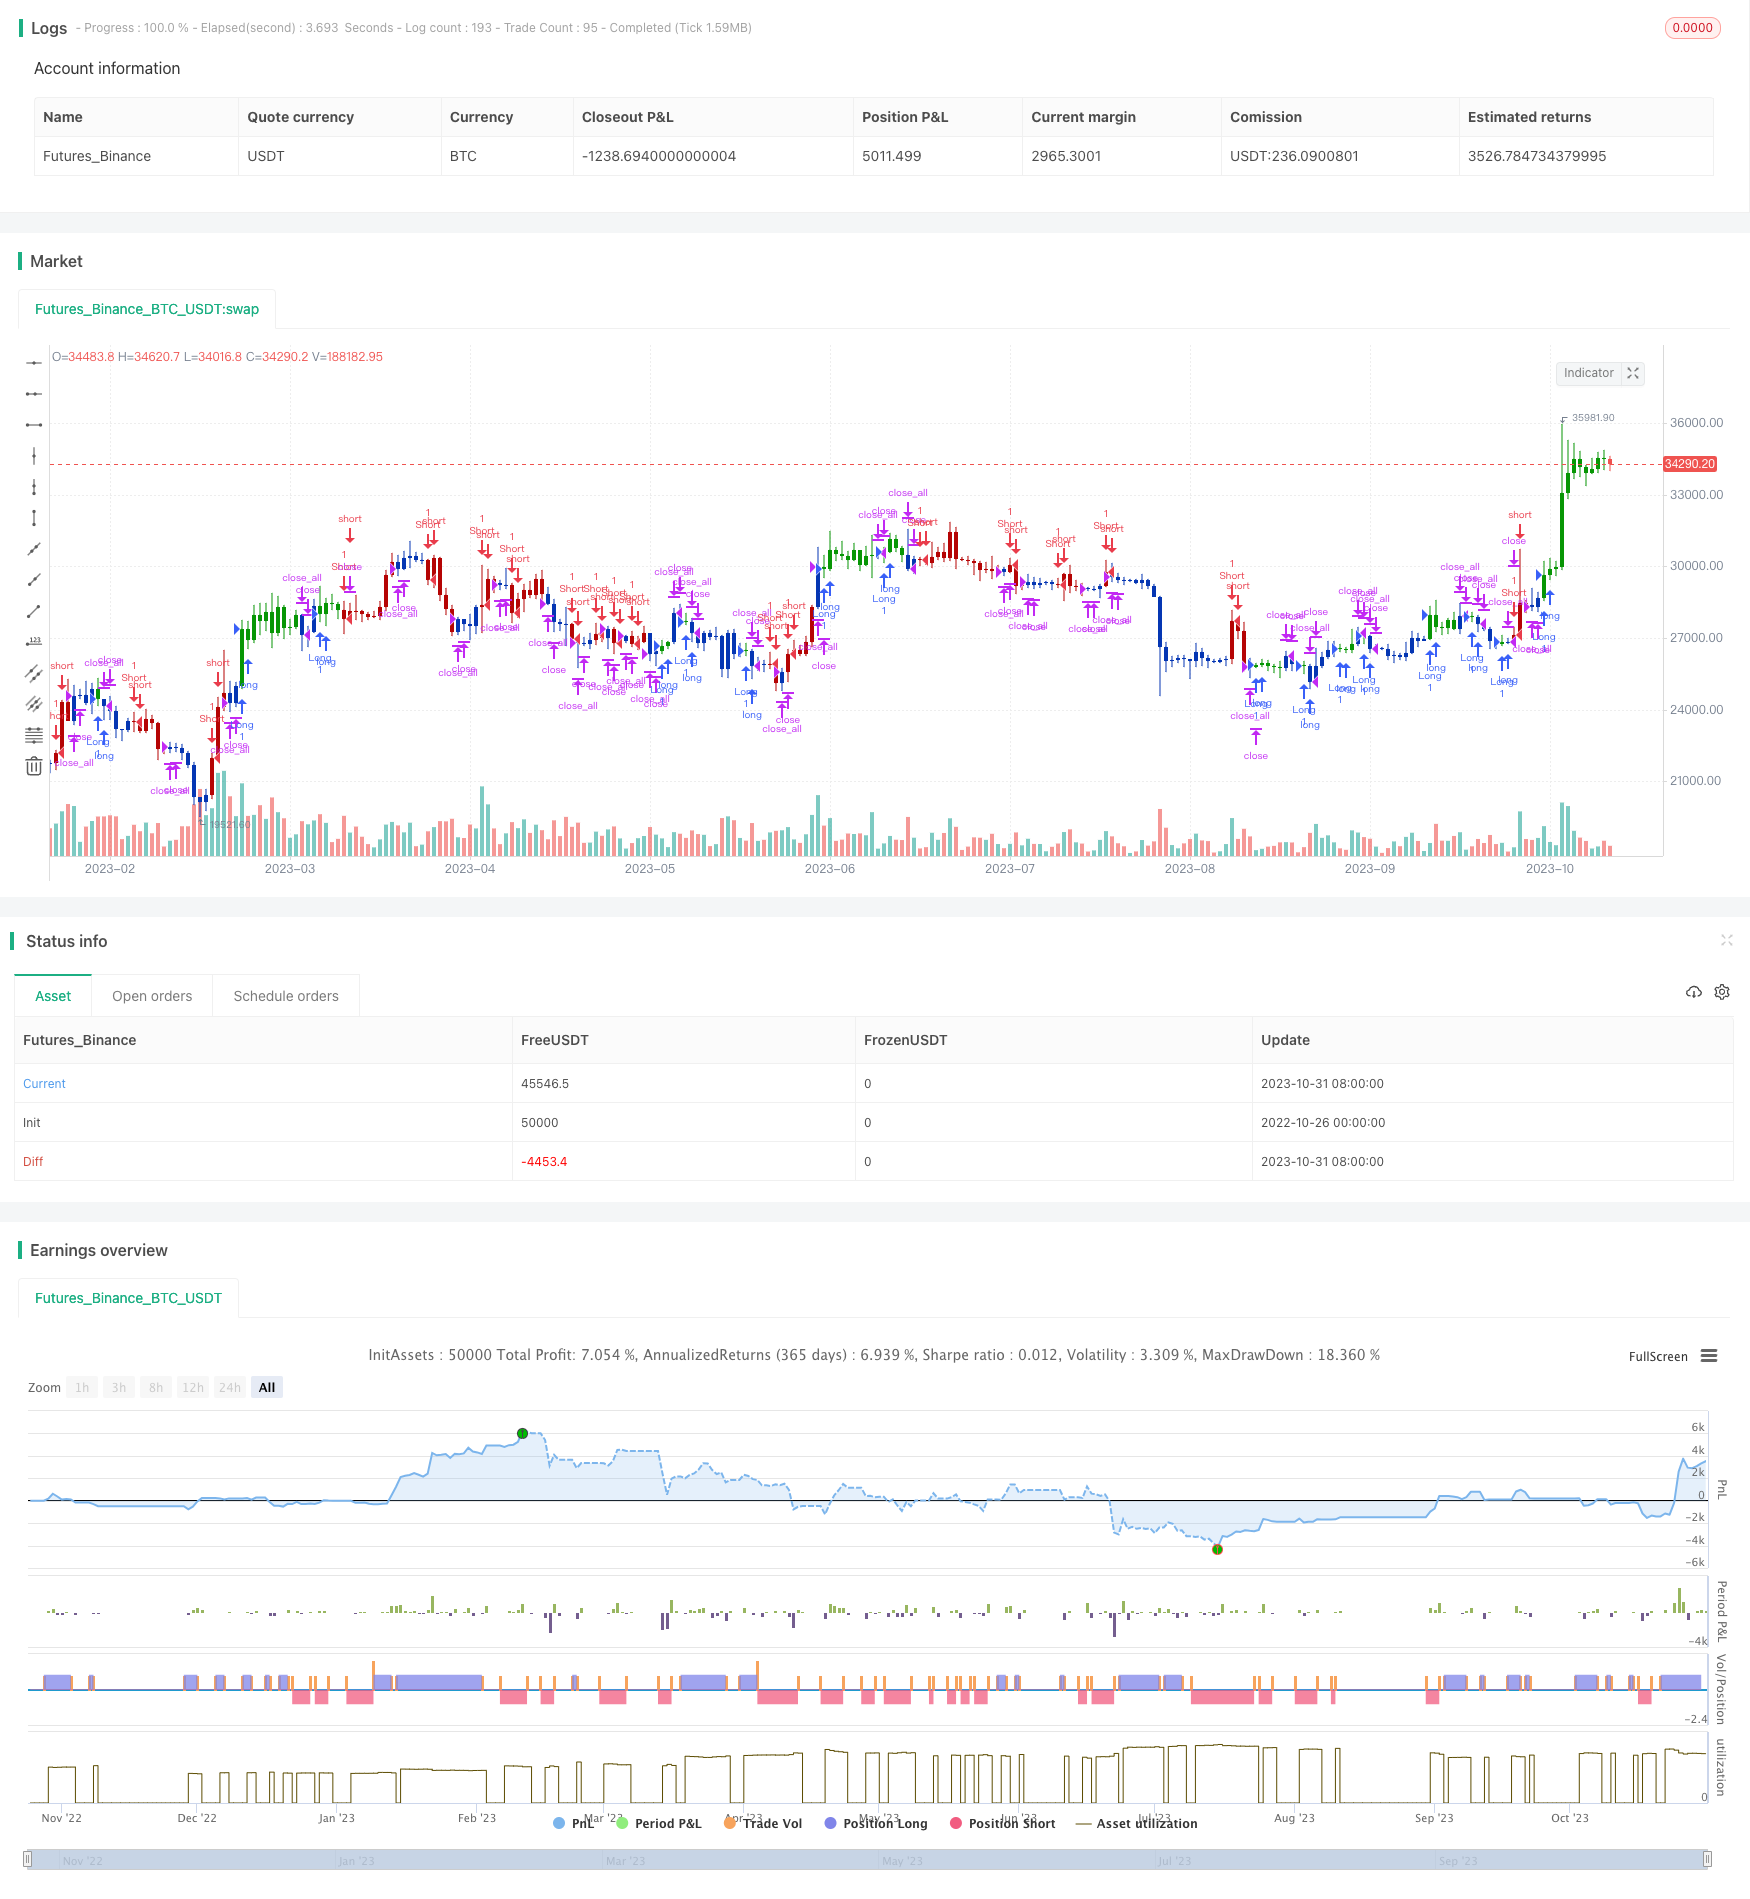 [trans]
概述
该策略通过组合使用双EMA和Awesome Oscillator两个指标,实现对趋势的识别和跟踪。其中EMA快速判断近期趋势方向,Awesome Oscillator过滤假突破提供入场时机。策略名称“双信号趋势跟踪策略”可以准确概括策略的主要功能。
策略原理
该策略主要运用双EMA和Awesome Oscillator两个技术指标进行信号过滤,具体逻辑如下:
-
计算2周期和20周期的EMA,当2周期EMA由下向上突破20周期EMA时,判断为上涨趋势;当2周期EMA由上向下突破20周期EMA时,判断为下跌趋势。
-
计算Awesome Oscillator,它由快速移动平均线减去慢速移动平均线得到,再用快速移动平均线减去MACD柱状图得到柱状图。当AO柱状图由红变蓝时视为买入信号,由蓝变红则为卖出信号。
-
只有当EMA显示上涨趋势,且AO同时显示买入信号时,才生成最终的买入信号;只有当EMA显示下跌趋势,且AO同时显示卖出信号时,才生成最终的卖出信号。
-
通过该双信号过滤机制,可以有效减少假突破操作,跟踪趋势中期方向。
优势分析
该策略具有以下优势:
-
双线联合过滤,可以减少噪音导致的错误交易。EMA判断大趋势方向,AO过滤进场时机,二者搭配可以提高信号的可靠性。
-
响应 Sensitivity 极快,可以及时捕捉短期内的趋势反转。2周期EMA对突破极为敏感,可以快速判断近期内趋势是否转变。
-
Awesome Oscillator 对MACD进行再次滤波,可以有效识别趋势中的假突破,避免不必要的反向操作。
-
策略方向明确,实现对中期趋势的跟踪。EMA确定基本趋势方向,AO进一步过滤确保符合大趋势方向交易,可以持续捕捉中期趋势行情。
-
策略参数选择合理,2周期和20周期EMA捕捉不同周期价格变化,5周期和34周期AO参数经过优化,可以较好地识别短期内的形态特征。
风险分析
该策略也存在一些风险:
-
在震荡行情中,EMA和AO可能发出较多错误信号,导致不必要的空头交易。可以通过调整EMA周期参数来降低误判风险。
-
AO在某些情况下可能滞后EMA,导致信号发生时间差,可以适当优化AO参数,使其更快地响应突破。
-
兼顾短中期特征的EMA和AO参数设定,对数据质量和计算力要求较高,需要根据不同品种特点调整。
-
频繁交易会产生更多手续费和滑点成本。可以适当放宽策略 Exit 标准,延长持仓周期。
-
策略没有考虑大周期趋势和关键支撑阻力位,应组合更多因素确保交易方向正确。
优化方向
该策略可以通过以下几个方面进行优化:
-
引入趋势判断指标,辅助EMA判断大趋势方向,例如常用的moving average ribbons、ATR等指标补充判断。
-
增加关键支撑阻力位识别机制,如Fibonacci回撤线,只在关键位附近发出信号。避免不利位置建仓。
-
优化EMA和AO参数组合,提高两者结合效果。例如使用类遗传算法自动寻找最佳参数对。
-
增加止损 Exit 机制。当价格突破最近Swing High/Low时,及时止损离场,控制单笔损失。
-
前期数据集验证,使用历史数据测评策略效果。检验是否可以稳定盈利,回测结果是否符合预期。
-
实盘模拟调参,逐步调整参数提高实盘指标效果。验证参数健壮性,得到更好的稳定参数组合。
总结
本策略整体思路清晰,以EMA判断大趋势方向,AO过滤信号的组合使用两种指标进行双重验证。可以有效识别趋势,跟踪中期行情。但也存在一定的风险与不足,需要继续优化测试以提高稳定性。关键是要选择合适的品种与参数,结合交易者的风格与法则进行应用。总体来说,该策略思路合理,具有实用价值。
||
Overview
This strategy combines dual EMA and Awesome Oscillator indicators to identify and track trends. EMA quickly judges short-term trend direction while Awesome Oscillator filters out false breakouts and provides entry timing. The strategy name "Dual Signal Trend Tracking Strategy" accurately summarizes its main functionality.
Strategy Logic
This strategy mainly utilizes two technical indicators, dual EMA and Awesome Oscillator, to filter signals with the following logic:
-
Calculate 2-period and 20-period EMA. When 2-period EMA breaks 20-period EMA upward, it signals an uptrend. When 2-period EMA breaks 20-period EMA downward, it signals a downtrend.
-
Calculate Awesome Oscillator, which is MACD histogram smoothed by fast EMA minus slow EMA. When AO histogram changes from red to blue, it is a buy signal. When it changes from blue to red, it is a sell signal.
-
Only when EMA shows uptrend and AO shows a buy signal at the same time, a final buy signal is generated. Only when EMA shows downtrend and AO shows a sell signal, a final sell signal is generated.
-
Through this dual signal filtering mechanism, false breakouts can be reduced and mid-term trends can be tracked.
Advantage Analysis
The advantages of this strategy are:
-
Dual line filtering reduces noisy trades caused by errors. EMA judges overall trend while AO filters entry timing. Combining the two improves signal reliability.
-
Extremely fast response sensitivity quickly captures short-term reversals. 2-period EMA is very sensitive to breakouts and can quickly determine if recent trends have changed.
-
Awesome Oscillator further filters MACD to effectively identify false breakouts in trends and avoid unnecessary reverse trades.
-
The strategy has a clear direction to track mid-term trends. EMA determines the basic trend while AO filters signals to ensure trading along overall trends.
-
Reasonable parameter selection. 2-period and 20-period EMA capture price changes over different timeframes. AO parameters 5 and 34 are optimized to identify short-term patterns.
Risk Analysis
Some risks also exist:
-
In ranging markets, EMA and AO may generate more false signals, causing unnecessary short trades. Adjusting EMA period can reduce errors.
-
AO may sometimes lag EMA, causing signal time delays. AO parameters can be optimized for faster response.
-
EMA and AO combing short and mid-term features require quality data and computing power. Parameters should be adjusted for different products.
-
Frequent trading leads to higher commissions and slippage costs. Exit criteria can be relaxed to extend holding periods.
-
The strategy does not consider long-term trends and key support/resistance levels. More factors should be combined to ensure correct trade direction.
Optimization Directions
The strategy can be optimized through several aspects:
-
Introduce trend indicators like moving average ribbons and ATR to assist EMA in determining overall trend.
-
Add key support/resistance detection like Fibonacci retracements, generating signals only around key levels to avoid bad entry positions.
-
Optimize EMA and AO parameter combinations to improve combo effects. For example, use genetic algorithms to find optimal parameter pairs.
-
Add stop loss exits. Exit when price breaks recent Swing High/Low to control single trade loss.
-
Backtest on historical data to evaluate strategy performance, check if stable profitability meets expectations.
-
Paper trade to gradually adjust parameters and improve live performance. Test parameter robustness to find better stable parameter sets.
Conclusion
The overall strategy idea is clear, combining EMA for overall trend and AO for signal filtering. It can effectively identify and track trends but also has some risks and limitations for further optimization and testing to improve stability. The key is choosing suitable products and parameters combined with proper trading principles and styles. Overall this strategy has sound logic and practical value.
[/trans]
Strategy Arguments
| Argument | Default | Description |
|---|---|---|
| v_input_int_1 | 14 | (?●═════ 2/20 EMA ═════●)Length |
| v_input_int_2 | 34 | (?●═════ Awesome Oscillator AC ═════●)Length Slow |
| v_input_int_3 | 5 | Length Fast |
| v_input_int_4 | 15 | MA |
| v_input_int_5 | 15 | EMA |
| v_input_int_6 | 15 | WMA |
| v_input_bool_1 | true | trading WMA |
| v_input_bool_2 | false | trading MA |
| v_input_bool_3 | false | trading EMA |
| v_input_bool_4 | false | (?●═════ MISC ═════●)Trade reverse |
| v_input_int_7 | true | (?●═════ Time Start ═════●)From Day |
| v_input_int_8 | true | From Month |
| v_input_int_9 | 2005 | From Year |
Source (PineScript)
/*backtest
start: 2022-10-26 00:00:00
end: 2023-11-01 00:00:00
period: 1d
basePeriod: 1h
exchanges: [{"eid":"Futures_Binance","currency":"BTC_USDT"}]
*/

//@version=5
////////////////////////////////////////////////////////////
//  Copyright by HPotter v1.0 27/04/2022
// This is combo strategies for get a cumulative signal.
//
// First strategy
// This indicator plots 2/20 exponential moving average. For the Mov
// Avg X 2/20 Indicator, the EMA bar will be painted when the Alert criteria is met.
//
// Second strategy
//    This indicator plots the oscillator as a histogram where blue denotes
//    periods suited for buying and red . for selling. If the current value
//    of AO (Awesome Oscillator) is above previous, the period is considered
//    suited for buying and the period is marked blue. If the AO value is not
//    above previous, the period is considered suited for selling and the
//    indicator marks it as red.
//
// WARNING:
// - For purpose educate only
// - This script to change bars colors.
////////////////////////////////////////////////////////////
EMA20(Length) =>
    pos = 0.0
    xPrice = close
    xXA = ta.ema(xPrice, Length)
    nHH = math.max(high, high[1])
    nLL = math.min(low, low[1])
    nXS = nLL > xXA or nHH < xXA ? nLL : nHH
    iff_1 = nXS < close[1] ? 1 : nz(pos[1], 0)
    pos := nXS > close[1] ? -1 : iff_1
    pos


AC(nLengthSlow,nLengthFast,nLengthMA,nLengthEMA,nLengthWMA,bShowWMA,bShowMA,bShowEMA) =>
    pos = 0.0
    xSMA1_hl2 = ta.sma(hl2, nLengthFast)
    xSMA2_hl2 = ta.sma(hl2, nLengthSlow)
    xSMA1_SMA2 = xSMA1_hl2 - xSMA2_hl2
    xSMA_hl2 = ta.sma(xSMA1_SMA2, nLengthFast)
    nRes =  xSMA1_SMA2 - xSMA_hl2
    xResWMA = ta.wma(nRes, nLengthWMA)
    xResMA = ta.sma(nRes, nLengthMA)
    xResEMA = ta.ema(nRes, nLengthEMA)
    xSignalSeries = bShowWMA ? xResWMA :
                     bShowMA ? xResMA :
                      bShowEMA ? xResEMA : na
    pos :=  xSignalSeries[2] < 0 and xSignalSeries[1] > 0? 1:
    	     xSignalSeries[2] > 0 and xSignalSeries[1] < 0 ? -1 : nz(pos[1], 0)
    pos

strategy(title='Combo 2/20 EMA & Bill  Awesome Oscillator (AC)', shorttitle='Combo', overlay=true)
var I1 = '●═════ 2/20 EMA ═════●'
Length = input.int(14, minval=1, group=I1)
var I2 = '●═════  Awesome Oscillator (AC) ═════●'
nLengthSlow = input.int(34, minval=1, title="Length Slow", group=I2)
nLengthFast = input.int(5, minval=1, title="Length Fast", group=I2)
nLengthMA = input.int(15, minval=1, title="MA", group=I2)
nLengthEMA = input.int(15, minval=1, title="EMA", group=I2)
nLengthWMA = input.int(15, minval=1, title="WMA", group=I2)
bShowWMA = input.bool( defval=true, title="trading WMA", group=I2)
bShowMA = input.bool( defval=false, title="trading MA", group=I2)
bShowEMA = input.bool( defval=false, title="trading EMA", group=I2)
var misc = '●═════ MISC ═════●'
reverse = input.bool(false, title='Trade reverse', group=misc)
var timePeriodHeader = '●═════ Time Start ═════●'
d = input.int(1, title='From Day', minval=1, maxval=31, group=timePeriodHeader)
m = input.int(1, title='From Month', minval=1, maxval=12, group=timePeriodHeader)
y = input.int(2005, title='From Year', minval=0, group=timePeriodHeader)
StartTrade = time > timestamp(y, m, d, 00, 00) ? true : false
posEMA20 = EMA20(Length)
prePosAC = AC(nLengthSlow,nLengthFast,nLengthMA,nLengthEMA,nLengthWMA,bShowWMA,bShowMA,bShowEMA)
iff_1 = posEMA20 == -1 and prePosAC == -1 and StartTrade ? -1 : 0
pos = posEMA20 == 1 and prePosAC == 1 and StartTrade ? 1 : iff_1
iff_2 = reverse and pos == -1 ? 1 : pos
possig = reverse and pos == 1 ? -1 : iff_2
if possig == 1
    strategy.entry('Long', strategy.long)
if possig == -1
    strategy.entry('Short', strategy.short)
if possig == 0
    strategy.close_all()
barcolor(possig == -1 ? #b50404 : possig == 1 ? #079605 : #0536b3)
Detail
https://www.fmz.com/strategy/430896
Last Modified
2023-11-02 17:02:06