
8.5 KiB
Name
历史价格突破型混合趋势交易系统HBTSHistorical-Breakout-Trend-System-with-Moving-Average-Filter-HBTS
Author
ChaoZhang
Strategy Description
[trans]
概述
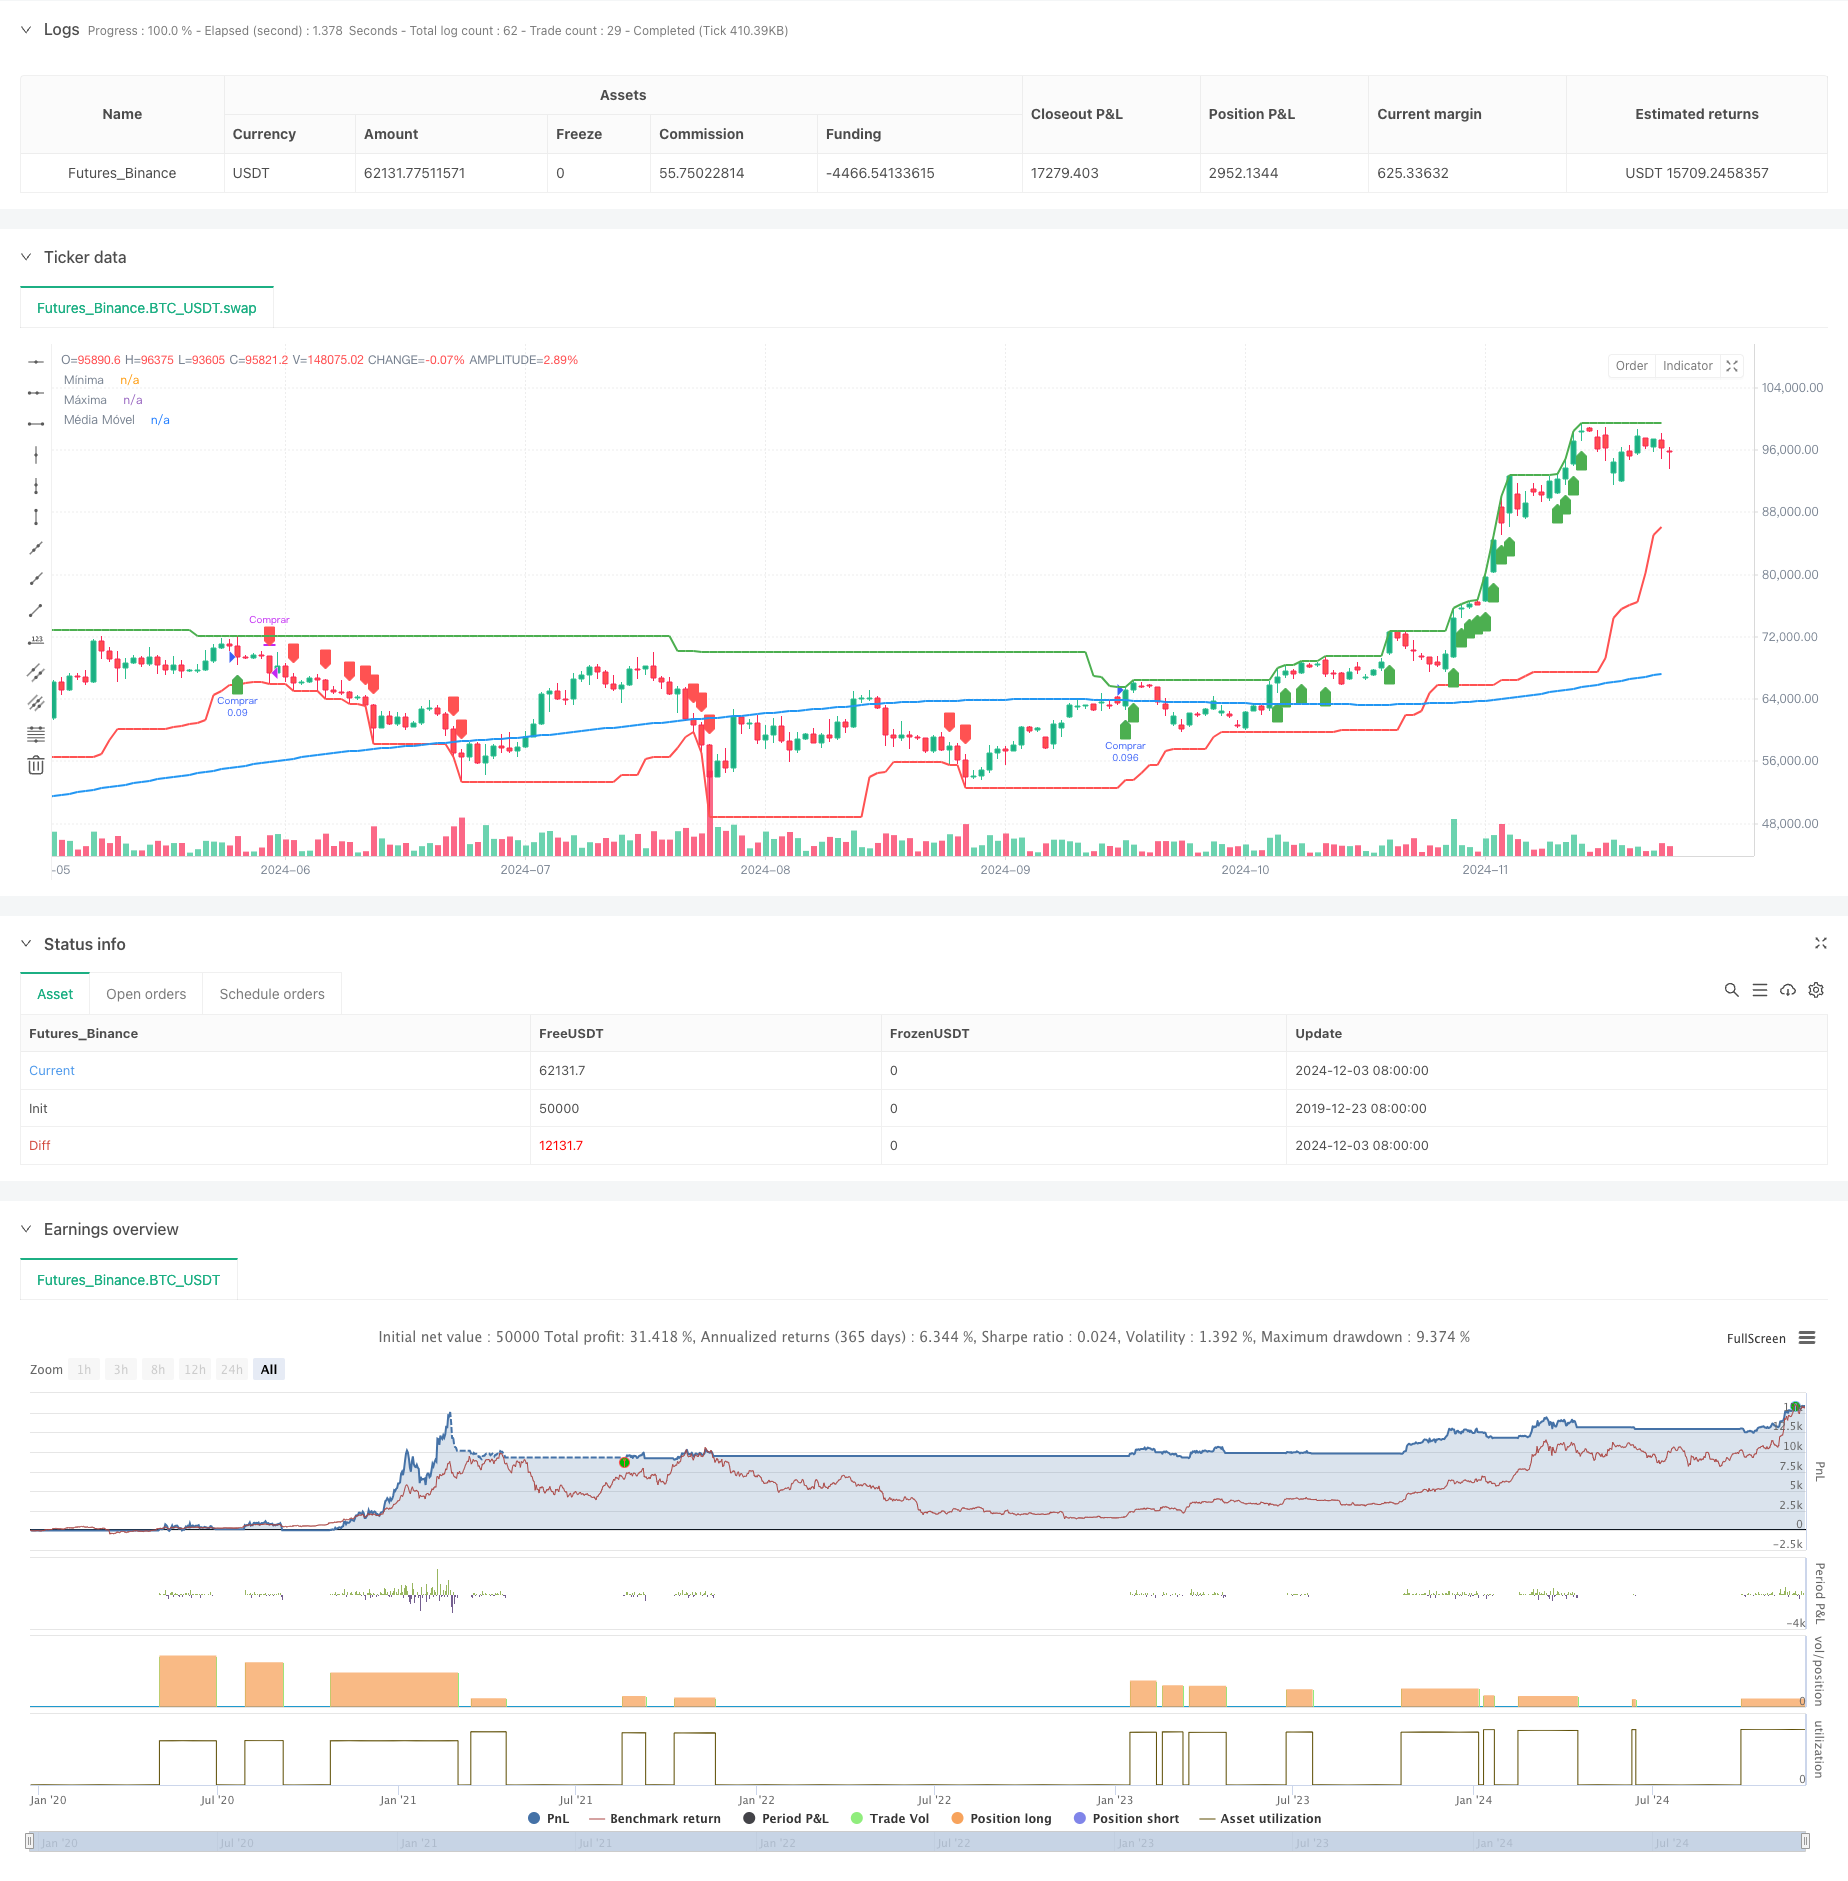
该策略是一个基于历史价格突破和均线过滤的趋势跟踪系统。它结合了多周期价格突破信号和移动平均线来识别市场趋势,通过严格的进出场规则来捕捉中长期市场走势。策略采用55天价格突破作为做多信号,20天价格突破作为平仓信号,同时引入200日均线作为趋势过滤器,有效降低假突破带来的风险。
策略原理
策略的核心逻辑建立在价格突破和趋势跟踪的基础上。具体来说:
- 入场信号:当价格创55天新高且收盘价位于200日均线上方时,系统发出做多信号
- 出场信号:当价格跌破20天低点时,系统平仓结束交易
- 趋势过滤:使用200日均线作为大趋势判断依据,只在均线上方开仓
- 仓位管理:采用账户净值的10%作为每次交易的资金比例
- 均线选择:支持SMA、EMA、WMA、VWMA四种均线方式,可根据不同市场特性灵活选择
策略优势
- 逻辑简单清晰:策略使用经典的价格突破和均线指标,易于理解和执行
- 风险控制完善:设置了明确的止损条件,并通过均线过滤和仓位控制来管理风险
- 适应性强:可以通过参数调整来适应不同市场环境
- 趋势捕捉能力强:通过多重时间周期的价格突破来确认趋势方向
- 自动化程度高:策略规则明确,便于程序化实现
策略风险
- 震荡市场风险:在横盘整理阶段容易产生假突破信号
- 滑点风险:在流动性较差的市场中,突破时的滑点可能较大
- 趋势反转风险:大趋势转折点附近可能出现较大回撤
- 参数敏感性:不同市场环境下最优参数可能存在较大差异
- 资金管理风险:固定比例仓位可能在某些情况下风险过大
策略优化方向
- 信号确认机制:可增加成交量突破等辅助指标来过滤假突破
- 动态止损:引入ATR等波动率指标来实现动态止损
- 仓位管理优化:根据市场波动率动态调整仓位比例
- 多周期分析:增加更多时间周期的分析来提高信号可靠性
- 市场环境识别:增加趋势强度指标来判断当前市场环境
总结
这是一个将经典的海龟交易法则与现代技术分析工具相结合的策略系统。通过价格突破捕捉趋势,利用均线过滤来确认方向,配合合理的仓位管理来控制风险。策略逻辑清晰,实用性强,具有良好的可扩展性。虽然在震荡市可能表现欠佳,但通过合理的参数优化和风险控制,仍能在趋势市场中获得稳定收益。建议交易者在实盘应用时,需要根据具体市场特点进行参数调整,并建立完善的资金管理制度。 ||
Overview
This strategy is a trend following system based on historical price breakouts and moving average filters. It combines multi-period price breakout signals with moving averages to identify market trends, using strict entry and exit rules to capture medium to long-term market movements. The strategy uses 55-day price breakouts for long signals, 20-day price breakouts for exits, and incorporates a 200-day moving average as a trend filter to effectively reduce false breakout risks.
Strategy Principles
The core logic is built on price breakouts and trend following. Specifically:
- Entry Signal: System generates a long signal when price makes a 55-day high and closes above the 200-day moving average
- Exit Signal: System closes positions when price breaks below the 20-day low
- Trend Filter: Uses 200-day moving average as major trend indicator, only entering longs above the average
- Position Management: Uses 10% of account equity for each trade
- Moving Average Options: Supports SMA, EMA, WMA, VWMA, allowing flexibility based on market characteristics
Strategy Advantages
- Clear Logic: Strategy uses classic price breakout and moving average indicators, easy to understand and execute
- Robust Risk Control: Has clear stop-loss conditions, manages risk through moving average filters and position control
- High Adaptability: Can be adjusted through parameters to suit different market environments
- Strong Trend Capturing: Uses multiple timeframe price breakouts to confirm trend direction
- High Automation: Clear strategy rules facilitate programmatic implementation
Strategy Risks
- Choppy Market Risk: Prone to false breakouts during consolidation phases
- Slippage Risk: May experience significant slippage in less liquid markets
- Trend Reversal Risk: Potential for large drawdowns near major trend turning points
- Parameter Sensitivity: Optimal parameters may vary significantly across different market environments
- Money Management Risk: Fixed proportion positioning may be too risky in certain situations
Optimization Directions
- Signal Confirmation: Can add volume breakout and other auxiliary indicators to filter false breakouts
- Dynamic Stop Loss: Incorporate ATR and other volatility indicators for dynamic stop loss
- Position Management: Dynamically adjust position size based on market volatility
- Multi-timeframe Analysis: Add more timeframe analysis to improve signal reliability
- Market Environment Recognition: Add trend strength indicators to judge current market conditions
Summary
This is a strategic system that combines classic turtle trading rules with modern technical analysis tools. It captures trends through price breakouts, confirms direction using moving averages, and controls risk with reasonable position management. The strategy logic is clear, practical, and has good scalability. While it may underperform in choppy markets, through proper parameter optimization and risk control, it can still achieve stable returns in trending markets. Traders are advised to adjust parameters based on specific market characteristics and establish comprehensive money management systems when applying to live trading.[/trans]
Source (PineScript)
/*backtest
start: 2019-12-23 08:00:00
end: 2024-12-04 00:00:00
period: 1d
basePeriod: 1d
exchanges: [{"eid":"Futures_Binance","currency":"BTC_USDT"}]
*/

//@version=5
strategy("Turtle Traders - Andrei", overlay=true,
     default_qty_type=strategy.percent_of_equity, default_qty_value=10)

// ====== Inputs ======
// Período para a máxima das compras
lookback_buy = input.int(title="Período para Máxima de Compra", defval=55, minval=1)

// Período para a mínima das vendas
lookback_sell = input.int(title="Período para Mínima de Venda", defval=20, minval=1)

// Período da Média Móvel
ma_length = input.int(title="Período da Média Móvel", defval=200, minval=1)

// Tipo de Média Móvel
ma_type = input.string(title="Tipo de Média Móvel", defval="SMA", options=["SMA", "EMA", "WMA", "VWMA"])

// ====== Cálculos ======
// Cálculo da Média Móvel baseada no tipo selecionado
ma = switch ma_type
    "SMA" => ta.sma(close, ma_length)
    "EMA" => ta.ema(close, ma_length)
    "WMA" => ta.wma(close, ma_length)
    "VWMA" => ta.vwma(close, ma_length)

// Cálculo da máxima dos últimos 'lookback_buy' candles
highest_buy = ta.highest(high, lookback_buy)

// Cálculo da mínima dos últimos 'lookback_sell' candles
lowest_sell = ta.lowest(low, lookback_sell)

// ====== Condições de Negociação ======
// Condição de entrada: fechamento acima da máxima dos últimos 'lookback_buy' candles E acima da MA
longCondition = (high == highest_buy) and (close > ma)

if (longCondition)
    strategy.entry("Comprar", strategy.long)

// Condição de saída: fechamento abaixo da mínima dos últimos 'lookback_sell' candles
exitCondition = (low == lowest_sell)

if (exitCondition)
    strategy.close("Comprar")

// ====== Plotagens ======
// Plotar a máxima de 'lookback_buy' candles
plot(highest_buy, color=color.green, title="Máxima", linewidth=2)

// Plotar a mínima de 'lookback_sell' candles
plot(lowest_sell, color=color.red, title="Mínima", linewidth=2)

// Plotar a Média Móvel
plot(ma, color=color.blue, title="Média Móvel", linewidth=2)

// ====== Sinais Visuais ======
// Sinal de entrada
plotshape(series=longCondition, location=location.belowbar, color=color.green,
          style=shape.labelup, title="Sinal de Compra", text="")

// Sinal de saída
plotshape(series=exitCondition, location=location.abovebar, color=color.red,
          style=shape.labeldown, title="Sinal de Venda", text="")
Detail
https://www.fmz.com/strategy/474020
Last Modified
2024-12-05 14:40:05