
9.4 KiB
Name
十五分钟图表高级交易信号策略-Advanced-15-Minute-Chart-Trading-Signal-Strategy
Author
ChaoZhang
Strategy Description
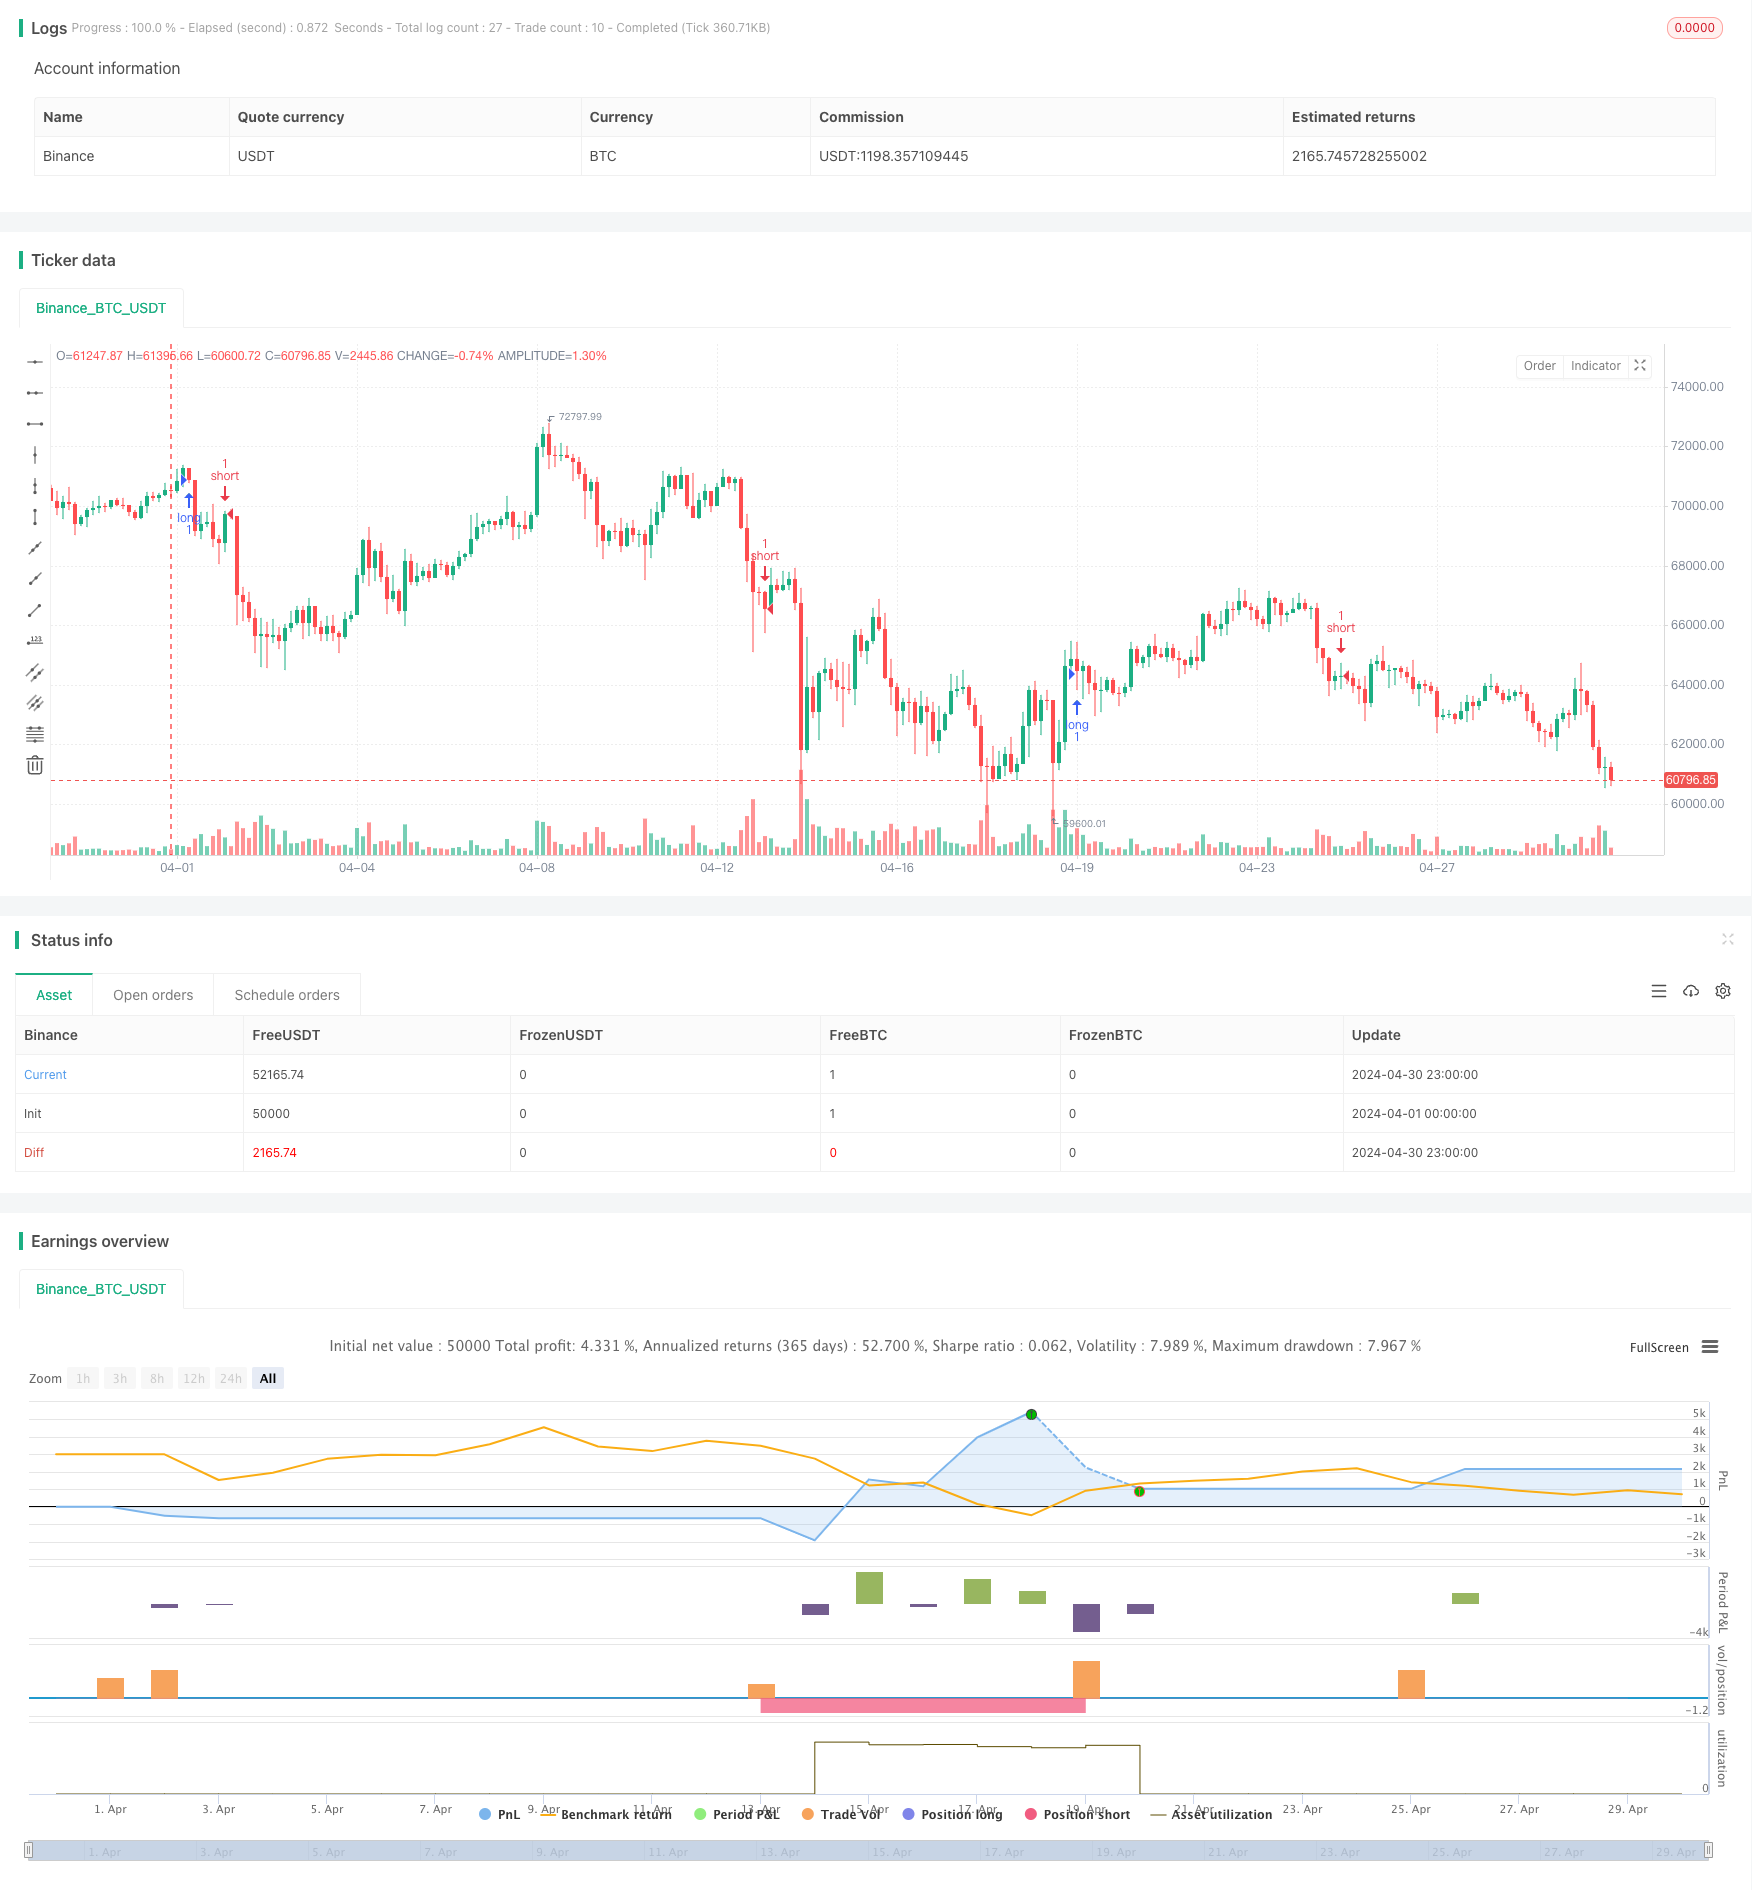
[trans]
概述
该策略使用15分钟图表数据,结合布林带(BB)、移动平均线(MA)、移动平均线收敛发散指标(MACD)、相对强弱指数(RSI)、随机振荡器(STOCH)以及成交量加权平均价格(VWAP)等多种技术指标,生成高级的交易信号。当多个指标同时给出买入或卖出信号时,策略会开仓做多或做空。同时,该策略还设置了止损和止盈,以控制风险和锁定利润。
策略原理
- 使用15分钟图表数据,获取收盘价。
- 计算布林带上轨和下轨,用于判断价格是否超买或超卖。
- 计算快速和慢速移动平均线,用于判断趋势方向。
- 计算MACD指标的MACD线和信号线,用于判断动量方向。
- 计算RSI指标,用于判断价格是否超买或超卖。
- 计算随机振荡器的%K和%D线,用于判断价格是否超买或超卖。
- 计算VWAP指标,用于判断价格相对于成交量加权平均价格的位置。
- 当快速移动平均线上穿慢速移动平均线、MACD线大于信号线、RSI大于50、收盘价大于VWAP、%K线大于%D线时,生成买入信号。
- 当快速移动平均线下穿慢速移动平均线、MACD线小于信号线、RSI小于50、收盘价小于VWAP、%K线小于%D线时,生成卖出信号。
- 当买入信号出现时,开仓做多,并设置止损和止盈。
- 当卖出信号出现时,开仓做空,并设置止损和止盈。
优势分析
- 综合运用多种技术指标,提高交易信号的可靠性。
- 使用15分钟图表数据,可以捕捉短期趋势和波动。
- 设置止损和止盈,有效控制风险和锁定利润。
- 策略逻辑清晰,易于理解和实现。
风险分析
- 在震荡市场中,频繁的交易信号可能导致过度交易和手续费损失。
- 止损和止盈的设置需要根据市场情况进行调整,不恰当的设置可能导致损失。
- 策略依赖于历史数据,对于突发事件和市场异常情况可能反应不及时。
优化方向
- 可以考虑引入其他技术指标,如布林带宽度、ADX等,以进一步提高交易信号的可靠性。
- 可以对止损和止盈的设置进行优化,如使用动态止损和止盈,或者根据市场波动性自适应调整。
- 可以结合基本面分析,如经济数据、政策变化等,对交易信号进行过滤和优化。
总结
该策略通过综合运用多种技术指标,在15分钟图表上生成高级交易信号,同时设置了止损和止盈以控制风险。策略逻辑清晰,易于实现,但在实际应用中需要注意过度交易、止损止盈设置以及对突发事件的反应等风险因素。未来可以考虑引入其他指标、优化止损止盈设置以及结合基本面分析等方式,进一步提高策略的可靠性和收益潜力。
||
Overview
This strategy uses 15-minute chart data and combines multiple technical indicators such as Bollinger Bands (BB), Moving Averages (MA), Moving Average Convergence Divergence (MACD), Relative Strength Index (RSI), Stochastic Oscillator (STOCH), and Volume Weighted Average Price (VWAP) to generate advanced trading signals. When multiple indicators simultaneously give buy or sell signals, the strategy opens long or short positions. Additionally, the strategy sets stop-loss and take-profit levels to control risk and lock in profits.
Strategy Principles
- Use 15-minute chart data to obtain closing prices.
- Calculate the upper and lower Bollinger Bands to determine if the price is overbought or oversold.
- Calculate fast and slow moving averages to determine trend direction.
- Calculate the MACD line and signal line of the MACD indicator to determine momentum direction.
- Calculate the RSI indicator to determine if the price is overbought or oversold.
- Calculate the %K and %D lines of the Stochastic Oscillator to determine if the price is overbought or oversold.
- Calculate the VWAP indicator to determine the price position relative to the volume-weighted average price.
- Generate a buy signal when the fast moving average crosses above the slow moving average, the MACD line is greater than the signal line, RSI is above 50, the closing price is above VWAP, and the %K line is above the %D line.
- Generate a sell signal when the fast moving average crosses below the slow moving average, the MACD line is less than the signal line, RSI is below 50, the closing price is below VWAP, and the %K line is below the %D line.
- When a buy signal appears, open a long position and set stop-loss and take-profit levels.
- When a sell signal appears, open a short position and set stop-loss and take-profit levels.
Advantage Analysis
- Integrates multiple technical indicators to improve the reliability of trading signals.
- Uses 15-minute chart data to capture short-term trends and fluctuations.
- Sets stop-loss and take-profit levels to effectively control risk and lock in profits.
- Clear and easy-to-understand strategy logic.
Risk Analysis
- In a sideways market, frequent trading signals may lead to overtrading and commission losses.
- The setting of stop-loss and take-profit levels needs to be adjusted according to market conditions; inappropriate settings may lead to losses.
- The strategy relies on historical data and may not react promptly to sudden events and market abnormalities.
Optimization Directions
- Consider introducing other technical indicators, such as Bollinger Band Width and ADX, to further improve the reliability of trading signals.
- Optimize the setting of stop-loss and take-profit levels, such as using dynamic stop-loss and take-profit or adaptively adjusting based on market volatility.
- Incorporate fundamental analysis, such as economic data and policy changes, to filter and optimize trading signals.
Summary
This strategy generates advanced trading signals on a 15-minute chart by comprehensively applying multiple technical indicators and sets stop-loss and take-profit levels to control risk. The strategy logic is clear and easy to implement, but in practical application, it is necessary to pay attention to risks such as overtrading, stop-loss and take-profit settings, and response to sudden events. In the future, we can consider introducing other indicators, optimizing stop-loss and take-profit settings, and combining fundamental analysis to further improve the strategy's reliability and profit potential. [/trans]
Source (PineScript)
/*backtest
start: 2024-04-01 00:00:00
end: 2024-04-30 23:59:59
period: 3h
basePeriod: 15m
exchanges: [{"eid":"Binance","currency":"BTC_USDT"}]
*/

//@version=5
strategy("Gelişmiş Al-Sat Sinyalleri", overlay=true, process_orders_on_close=true)

// 15 dakikalık grafik verileri
fifteen_minute_close = request.security(syminfo.tickerid, "15", close)

// Stop loss ve take profit seviyelerini hesaplamak için kullanılacak oranlar
stop_loss_ratio = input.float(0.01, title="Stop Loss Oranı")
take_profit_ratio = input.float(0.02, title="Take Profit Oranı")

// Bollinger Bantları göstergesi
length = input.int(20, title="BB Dönemi")
mult = input.float(2.0, title="BB Çarpanı")
basis = ta.sma(fifteen_minute_close, length)
dev = mult * ta.stdev(fifteen_minute_close, length)
upper = basis + dev
lower = basis - dev

// Moving Averages (Hareketli Ortalamalar)
fast_ma = ta.sma(fifteen_minute_close, 10)
slow_ma = ta.sma(fifteen_minute_close, 30)

// MACD göstergesi
macd_line = ta.ema(fifteen_minute_close, 12) - ta.ema(fifteen_minute_close, 26)
macd_signal = ta.ema(macd_line, 9)
macd_hist = macd_line - macd_signal

// RSI göstergesi
rsi = ta.rsi(fifteen_minute_close, 14)

// Stochastic Oscillator (Stokastik Osilatör)
kPeriod = input.int(14, title="Stochastic %K Periyodu")
dPeriod = input.int(3, title="Stochastic %D Periyodu")
smoothK = input.int(3, title="Stochastic %K Düzleştirme")
k = ta.stoch(fifteen_minute_close, high, low, kPeriod)
d = ta.sma(k, dPeriod)

// Hacim ağırlıklı hareketli ortalamalar göstergesi (VWAP)
vwap_length = input.int(20, title="VWAP Dönemi")
vwap = ta.sma(volume * (high + low + fifteen_minute_close) / 3, vwap_length) / ta.sma(volume, vwap_length)

// Al-Sat Sinyallerini hesaplayın
long_signal = ta.crossover(fast_ma, slow_ma) and macd_line > macd_signal and rsi > 50 and fifteen_minute_close > vwap and k > d
short_signal = ta.crossunder(fast_ma, slow_ma) and macd_line < macd_signal and rsi < 50 and fifteen_minute_close < vwap and k < d

// Al ve Sat işaretlerini, yanlarında ok işaretleri olan üçgenlerle değiştirin
plotshape(series=long_signal, style=shape.triangleup, location=location.belowbar, color=color.green, size=size.small)
plotshape(series=short_signal, style=shape.triangledown, location=location.abovebar, color=color.red, size=size.small)

// Uzun ve kısa pozisyonlar için girişler
if (long_signal)
    strategy.entry("long", strategy.long)
    strategy.exit("exit_long", "long", stop=fifteen_minute_close * (1 - stop_loss_ratio), limit=fifteen_minute_close * (1 + take_profit_ratio))

if (short_signal)
    strategy.entry("short", strategy.short)
    strategy.exit("exit_short", "short", stop=fifteen_minute_close * (1 + stop_loss_ratio), limit=fifteen_minute_close * (1 - take_profit_ratio))
Detail
https://www.fmz.com/strategy/452693
Last Modified
2024-05-28 11:03:37