
11 KiB
Name
动量驱动型均线-RSI交叉策略-Momentum-Driven-EMA-RSI-Crossover-Strategy
Author
ChaoZhang
Strategy Description
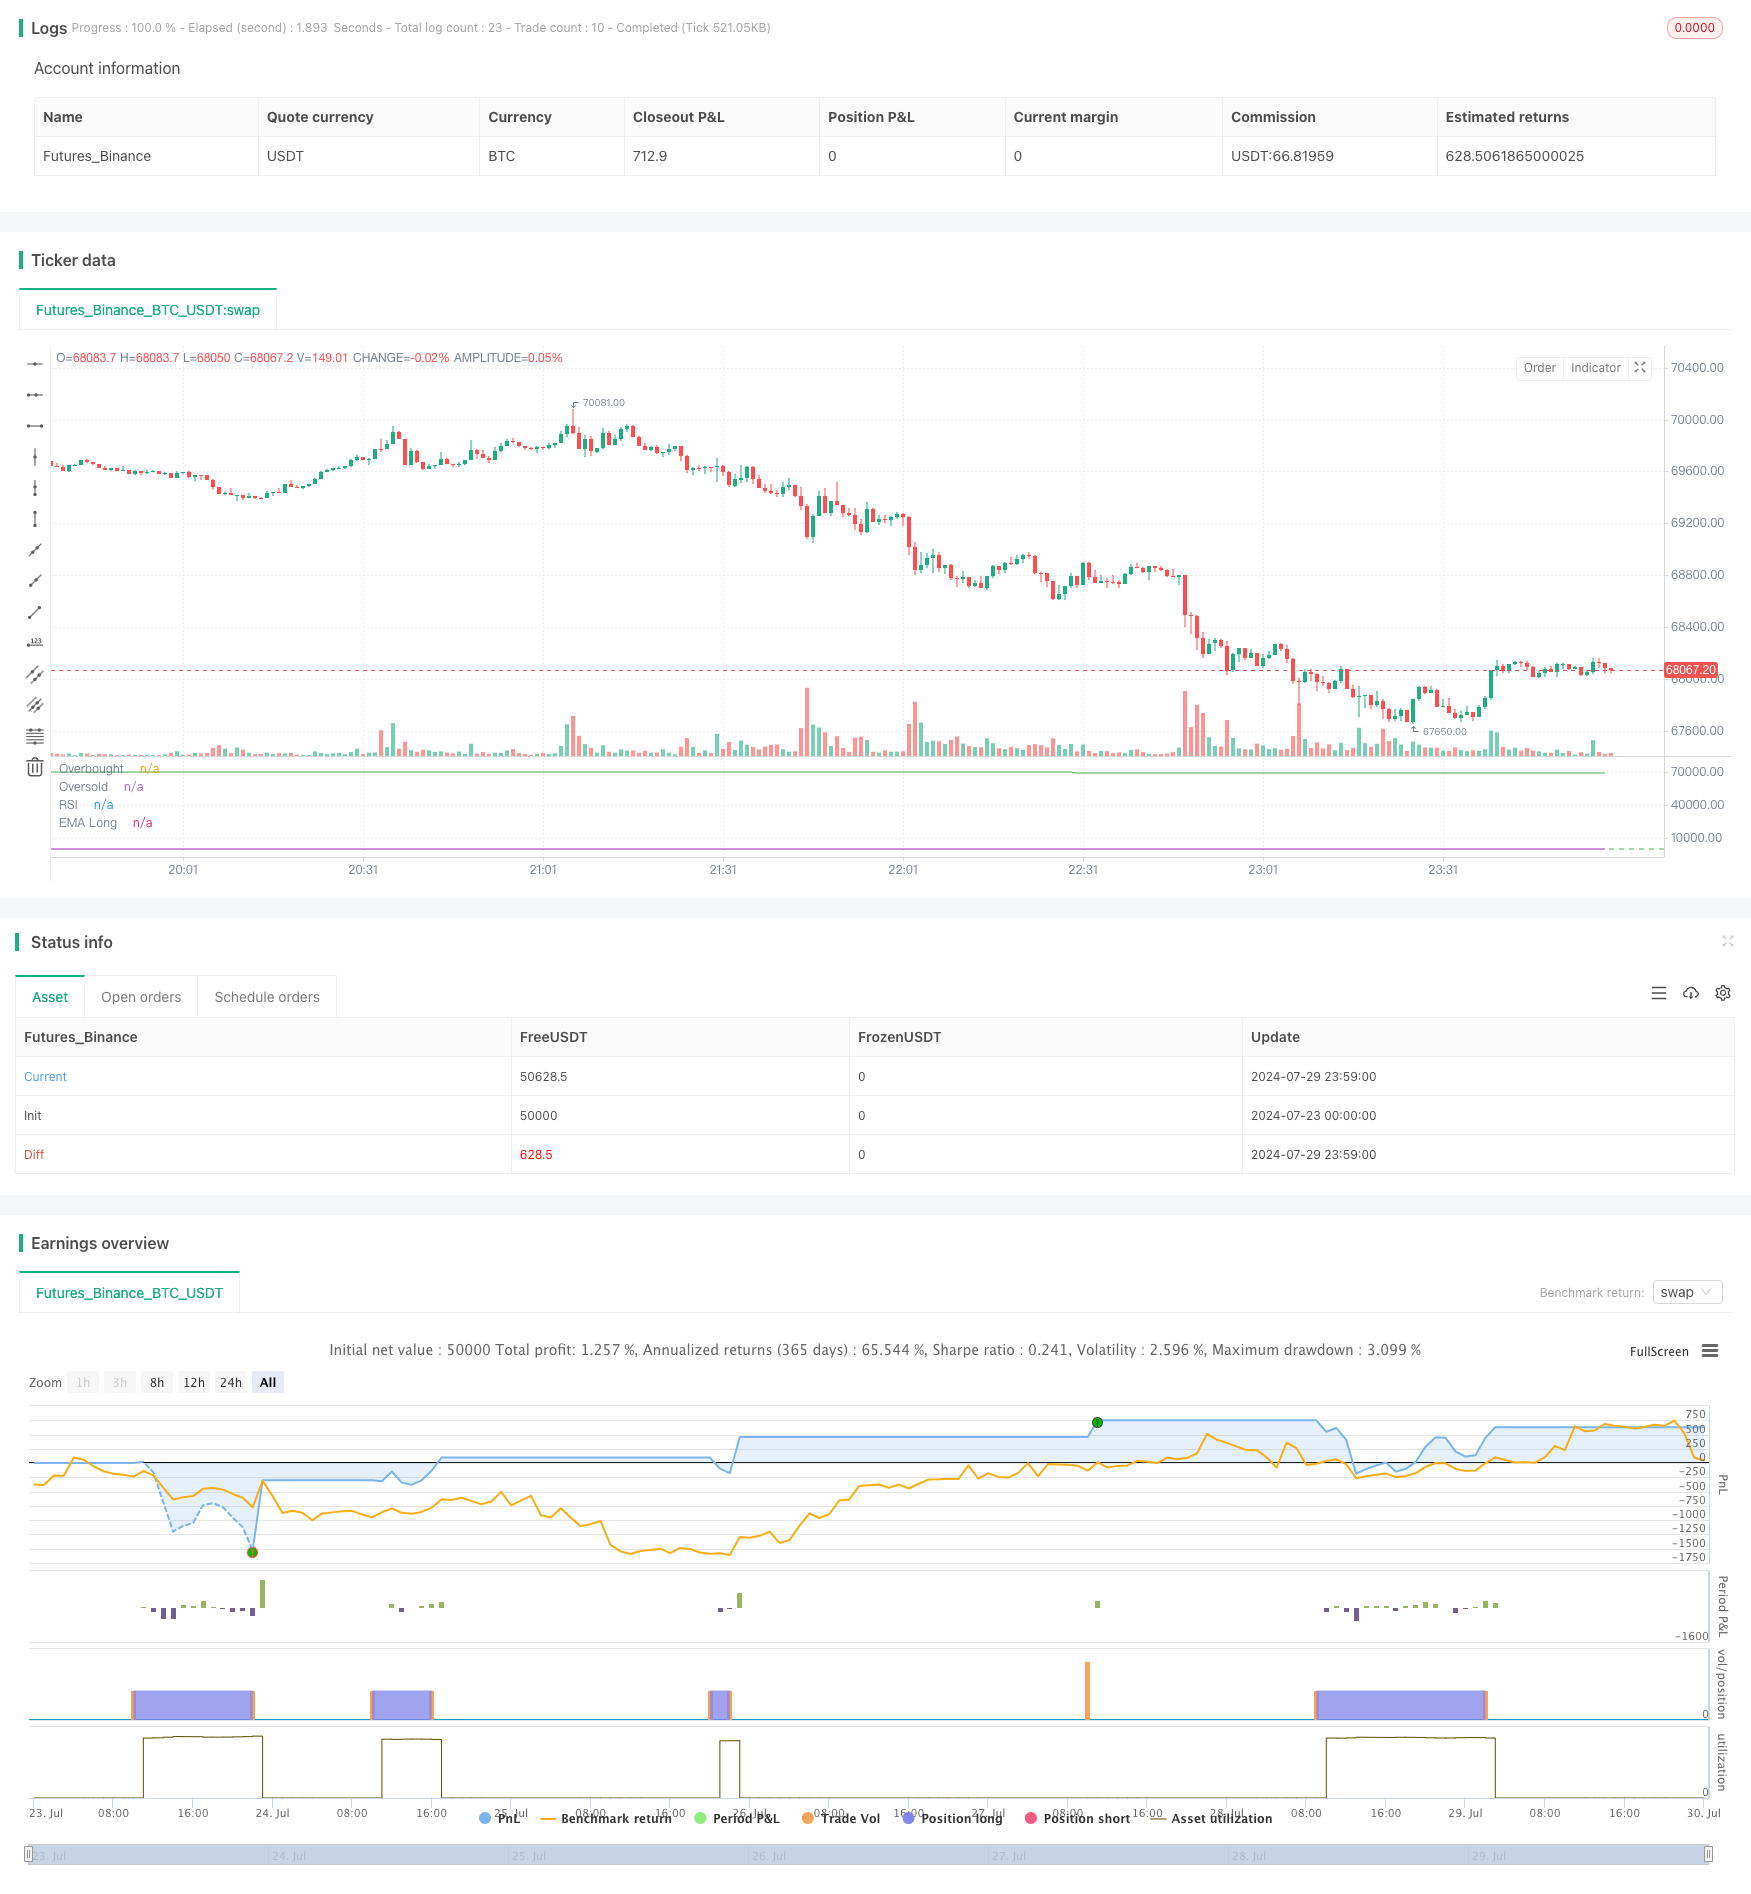 [trans]
概述
本策略是一种基于动量和趋势的交易策略,主要利用指数移动平均线(EMA)和相对强弱指标(RSI)来捕捉市场的短期动量机会。策略的核心思想是在价格突破长期EMA且RSI达到超买区域时入场,在RSI达到超卖区域时出场,从而实现对短期强势行情的把握。这种方法旨在捕捉市场情绪的快速变化,特别适合在波动较大的市场环境中应用。
策略原理
策略的运作原理如下:
- 使用一个周期较长(450)的EMA作为主要趋势指标。
- 采用14周期的RSI作为动量指标。
- 设定RSI的买入阈值为67,卖出阈值为80。
- 当价格向上突破EMA且RSI同时高于67时,触发买入信号。
- 当RSI超过80时,触发卖出信号。
这种设计利用了EMA的趋势跟踪特性和RSI的动量捕捉能力。EMA突破确保了整体趋势的方向,而RSI的高位则表明市场处于强势状态。通过在RSI达到更高水平时退出,策略试图在动量减弱之前获利了结。
策略优势
- 动量捕捉: 策略能够有效捕捉短期强势行情,适合快速波动的市场。
- 趋势确认: 结合EMA和RSI,既考虑了整体趋势,又关注短期动量,降低了虚假信号的风险。
- 快速反应: 5分钟时间框架使策略能够对市场变化做出迅速反应。
- 风险管理: 通过设定明确的入场和出场条件,有助于控制风险。
- 灵活性: 策略参数可调,允许交易者根据不同市场条件进行优化。
- 自动化: 策略可以轻松实现自动化交易,减少人为情绪干扰。
策略风险
- 过度交易: 在高波动市场中可能产生频繁的交易信号,增加交易成本。
- 滞后性: EMA作为滞后指标,可能在快速反转行情中反应不及时。
- RSI局限性: RSI在强势趋势中可能长期处于超买或超卖状态,导致错失机会或过早退出。
- 市场噪音: 5分钟时间框架容易受到短期市场噪音的影响,可能产生虚假信号。
- 单一市场依赖: 策略推荐用于特定交易对,可能不适用于所有市场条件。
- 参数敏感性: 策略表现可能对参数设置高度敏感,需要持续优化。
策略优化方向
- 动态参数调整: 考虑根据市场波动性动态调整EMA和RSI参数,以适应不同市场环境。
- 多时间框架分析: 引入更长时间框架的确认信号,如1小时或4小时图表,以减少虚假信号。
- 止损机制: 加入适当的止损策略,如跟踪止损,以更好地控制风险。
- volume筛选: 结合交易量分析,在高成交量时段确认信号,提高策略可靠性。
- 趋势强度过滤: 使用ADX等指标评估趋势强度,只在强趋势中交易。
- 多指标融合: 考虑引入其他动量指标如MACD或Stochastic,构建更全面的入场和出场条件。
- 回测优化: 在不同市场周期和多个交易对上进行广泛回测,找出最优参数组合。
总结
动量驱动型均线-RSI交叉策略是一种结合了趋势跟踪和动量交易理念的短期交易策略。通过巧妙利用EMA和RSI指标,该策略旨在捕捉市场的短期强势动向,特别适合在波动较大的市场中应用。虽然策略设计简洁明了,但其有效性很大程度上取决于参数设置和市场条件。
为了充分发挥策略潜力,交易者需要注意以下几点:首先,持续监控和优化策略参数,以适应不断变化的市场环境;其次,考虑引入额外的风险管理措施,如设置合理的止损位;再者,可以尝试将该策略与其他分析方法或指标结合,以获得更全面的市场洞察。
最后,尽管该策略在理论上具有捕捉短期动量的优势,但实际交易中仍需谨慎。建议在实盘交易前进行充分的回测和模拟交易,并时刻关注市场变化,及时调整策略以应对不同的市场状况。只有通过不断学习和优化,才能真正发挥这个策略的潜力,在复杂多变的金融市场中获得稳定收益。
||
Overview
This strategy is a momentum and trend-based trading approach that primarily utilizes the Exponential Moving Average (EMA) and Relative Strength Index (RSI) to capture short-term momentum opportunities in the market. The core idea is to enter trades when the price breaks above a long-term EMA and the RSI reaches the overbought zone, and exit when the RSI enters the oversold region. This method aims to capitalize on rapid changes in market sentiment and is particularly suitable for volatile market environments.
Strategy Principle
The operating principle of the strategy is as follows:
- Use a long-period (450) EMA as the primary trend indicator.
- Employ a 14-period RSI as the momentum indicator.
- Set the RSI buy threshold at 67 and the sell threshold at 80.
- Trigger a buy signal when the price breaks above the EMA and the RSI is simultaneously above 67.
- Trigger a sell signal when the RSI exceeds 80.
This design leverages the trend-following characteristics of the EMA and the momentum-capturing ability of the RSI. The EMA breakout ensures the overall trend direction, while the high RSI indicates strong market conditions. By exiting when the RSI reaches a higher level, the strategy attempts to take profits before momentum diminishes.
Strategy Advantages
- Momentum Capture: The strategy effectively captures short-term strong trends, suitable for rapidly fluctuating markets.
- Trend Confirmation: Combining EMA and RSI considers both overall trend and short-term momentum, reducing the risk of false signals.
- Quick Response: The 5-minute timeframe allows the strategy to react swiftly to market changes.
- Risk Management: Clear entry and exit conditions help control risk.
- Flexibility: Strategy parameters are adjustable, allowing traders to optimize for different market conditions.
- Automation: The strategy can be easily automated, reducing emotional interference in trading.
Strategy Risks
- Overtrading: May generate frequent trading signals in highly volatile markets, increasing transaction costs.
- Lag: EMA, being a lagging indicator, may not respond timely in rapid reversal scenarios.
- RSI Limitations: RSI may remain in overbought or oversold conditions for extended periods in strong trends, leading to missed opportunities or premature exits.
- Market Noise: The 5-minute timeframe is susceptible to short-term market noise, potentially producing false signals.
- Single Market Dependency: The strategy is recommended for specific trading pairs and may not be applicable to all market conditions.
- Parameter Sensitivity: Strategy performance may be highly sensitive to parameter settings, requiring ongoing optimization.
Strategy Optimization Directions
- Dynamic Parameter Adjustment: Consider dynamically adjusting EMA and RSI parameters based on market volatility to adapt to different market environments.
- Multi-Timeframe Analysis: Introduce confirmation signals from longer timeframes, such as 1-hour or 4-hour charts, to reduce false signals.
- Stop-Loss Mechanism: Incorporate appropriate stop-loss strategies, such as trailing stops, for better risk control.
- Volume Filtering: Integrate volume analysis to confirm signals during high-volume periods, improving strategy reliability.
- Trend Strength Filtering: Use indicators like ADX to assess trend strength and trade only in strong trends.
- Multi-Indicator Fusion: Consider introducing other momentum indicators like MACD or Stochastic to build more comprehensive entry and exit conditions.
- Backtesting Optimization: Conduct extensive backtesting across different market cycles and multiple trading pairs to find the optimal parameter combinations.
Summary
The Momentum-Driven EMA-RSI Crossover Strategy is a short-term trading approach that combines trend-following and momentum trading concepts. By cleverly utilizing EMA and RSI indicators, this strategy aims to capture short-term strong market movements, particularly suitable for application in volatile markets. While the strategy design is straightforward, its effectiveness largely depends on parameter settings and market conditions.
To fully leverage the strategy's potential, traders should pay attention to the following points: First, continuously monitor and optimize strategy parameters to adapt to changing market environments; Second, consider introducing additional risk management measures, such as setting reasonable stop-loss levels; Third, try combining this strategy with other analytical methods or indicators to gain more comprehensive market insights.
Finally, although the strategy theoretically has advantages in capturing short-term momentum, caution is still needed in actual trading. It is advisable to conduct thorough backtesting and paper trading before live implementation, and always stay attuned to market changes, adjusting the strategy promptly to cope with different market conditions. Only through continuous learning and optimization can one truly harness the potential of this strategy and achieve stable returns in the complex and ever-changing financial markets.
[/trans]
Source (PineScript)
/*backtest
start: 2024-07-23 00:00:00
end: 2024-07-30 00:00:00
period: 1m
basePeriod: 1m
exchanges: [{"eid":"Futures_Binance","currency":"BTC_USDT"}]
*/

//@version=5
strategy("EMA RSI Momentum Strategy TF5min [capayam.com]", overlay=false)

//Desc: Buys when price crosses above long EMA line and above RSI Buy threshold. Exits when RSI above Sell threshold.
//Recomended pair: RNDRUSDT TF5min (Binance)

// Adjustable Inputs
emaLength = input.int(450, title="EMA Length")
rsiLength = input.int(14, title="RSI Length")
rsiOverboughtLevel = input.int(80, title="RSI Sell Threshold")
rsiOversoldLevel = input.int(67, title="RSI Buy Threshold")


// Define the EMAs
ema = ta.ema(close, emaLength)

// Define the RSI
rsi = ta.rsi(close, rsiLength)


// Buy Condition: Price crosses above Long EMA and RSI buy Threshold
buyCondition = ta.crossover(close, ema) and rsi > rsiOversoldLevel

// Exit Condition
exitCondition = rsi > rsiOverboughtLevel

// Plot the EMAs
plot(ema, color=color.green, title="EMA Long")


// Plot the RSI
hline(rsiOverboughtLevel, "Overbought", color=color.red)
hline(rsiOversoldLevel, "Oversold", color=color.green)
plot(rsi, title="RSI", color=color.purple)

// Strategy entry and exit
if (buyCondition)
    strategy.entry("Buy", strategy.long)

if (exitCondition)
    strategy.close("Buy")
Detail
https://www.fmz.com/strategy/458232
Last Modified
2024-07-31 10:31:18