
8.5 KiB
Name
动量追踪止损策略Momentum-Tracking-Stop-Loss-Strategy
Author
ChaoZhang
Strategy Description
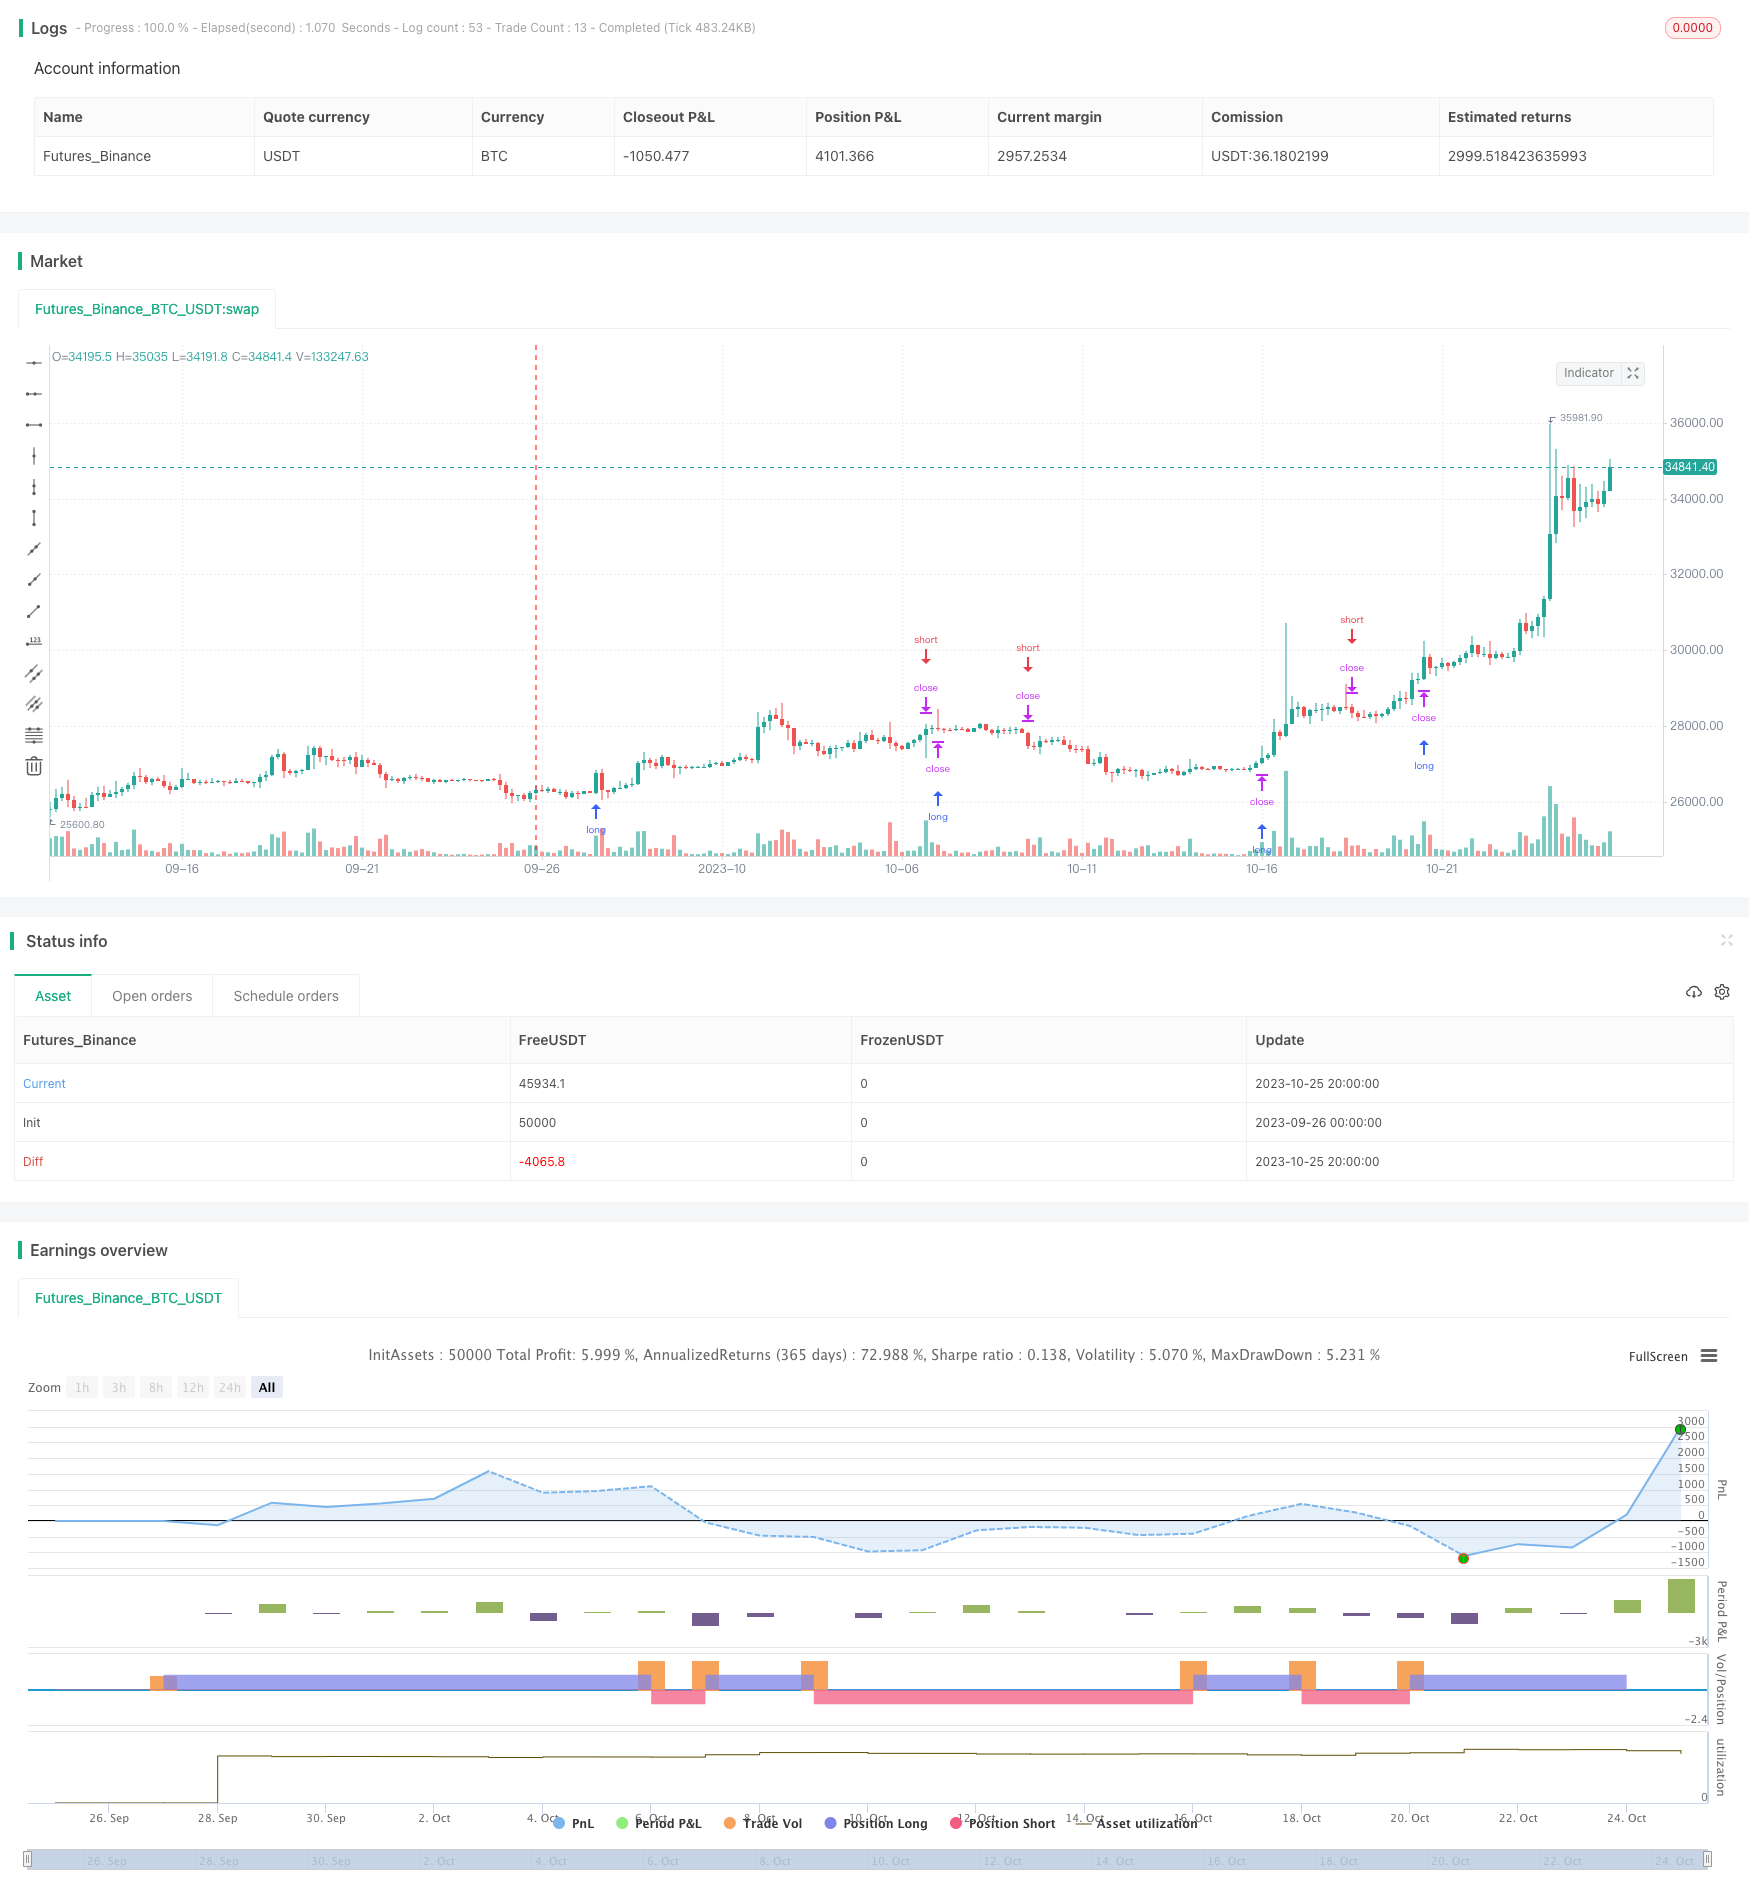
[trans]
概述
该策略基于抛物线转向系统指标,结合时间窗口进行回测,实现动量追踪止损的效果。策略主要适用于趋势性较强的品种,通过动态调整止损点,实现趋势跟踪止损。
策略原理
该策略使用抛物线转向系统(Parabolic SAR)作为主要技术指标。Parabolic SAR可以提供非常准确的反转信号。当股价处于上涨趋势时,Parabolic SAR会不断上移,为追踪上涨提供支撑。当股价开始下跌时,Parabolic SAR会快速下移,为止损提供信号。
策略首先设置Parabolic SAR的三个参数,包括初始值、步进值和最大值。然后计算Parabolic SAR的值。策略以Parabolic SAR作为动态止损点。当股价上涨时,在Parabolic SAR之上做多;当股价跌破Parabolic SAR时,平掉做多单子。同理,当股价下跌时,在Parabolic SAR之下做空;当股价突破Parabolic SAR时,平掉做空单子。
这样,策略可以在股价处于趋势状态时,进行趋势跟踪;当股价开始反转时,快速止损,完成一次交易周期。
优势分析
- 利用Parabolic SAR指标的高效性,可以提供准确的做多做空信号
- Parabolic SAR指标可以快速响应价格变化,进行及时止损
- 自动调整止损点,无需人工干预,避免错失止损机会
- 可以深度定制Parabolic SAR的参数,使止损点更符合自己的风格
- 回测指定时间窗口,可以检查策略在不同市场环境下的表现
风险分析
- 难以把握最佳的Parabolic SAR参数组合,不当的参数可能带来止损过于激进或保守
- 依赖单一指标Parabolic SAR,容易受到异常波动的影响
- 该策略更适合趋势性行情,盘整时容易止损过于频繁
- 需要选择合适的时间窗口进行回测,测试样本不全面可能导致结果偏差
- 回测仅考虑历史数据,无法预测未来行情,实盘表现可能和回测不符
优化方向
- 可以考虑结合其他指标,形成指标组合,提高策略的稳定性
- 增加参数优化模块,实现Parabolic SAR参数的自动优化
- 增加仓位和订单管理模块,控制每笔交易的资金利用率
- 增加止损方式的选择,如移动止损、挂单止损等,使策略更全面
- 优化时间窗口的选择,检验不同市场环境下的策略稳定性
- 增加机器学习模块,利用AI技术实现策略参数的动态优化
总结
该策略充分利用Parabolic SAR指标提供的高效止损功能,实现了动量追踪止损的效果。相比固定止损点,该策略可以动态调整,自动跟踪趋势进行止损,避免仓位过早被止损。同时,策略风险也不能忽视,需要多方面进行优化和丰富,使策略在不同市场中保持稳定的表现。总体来说,该策略为跟踪趋势提供了效果明显的止损方式,值得进一步研究和应用。
||
Overview
This strategy is based on the Parabolic SAR indicator and incorporates a time window for backtesting to achieve a momentum tracking stop loss effect. It is mainly suitable for products with a strong trend, and dynamically adjusts the stop loss point to realize trend tracking stop loss.
Strategy Logic
The strategy uses the Parabolic SAR (Parabolic Stop and Reverse) indicator as the main technical indicator. Parabolic SAR can provide very accurate reversal signals. When the price is in an uptrend, Parabolic SAR will keep moving up to track the uptrend. When the price starts to fall, Parabolic SAR will drop rapidly to provide stop loss signals.
The strategy first sets three parameters of Parabolic SAR, including the starting value, increment value and maximum value. It then calculates the value of Parabolic SAR. The strategy uses Parabolic SAR as the dynamic stop loss point. When the price rises, it goes long above Parabolic SAR; when the price breaks below Parabolic SAR, it closes the long position. Similarly, when the price falls, it goes short below Parabolic SAR; when the price breaks above Parabolic SAR, it closes the short position.
In this way, the strategy can track the trend when the price is trending, and quickly stop loss when the price reverses, completing a trading cycle.
Advantage Analysis
- Utilizes the high efficiency of Parabolic SAR to provide accurate long and short signals
- Parabolic SAR can respond quickly to price changes for timely stop loss
- Automatically adjusts stop loss points without manual intervention, avoiding missing stop loss opportunities
- Allows deep customization of Parabolic SAR parameters to fit your own style
- Backtests on specified time windows to examine strategy performance in different market environments
Risk Analysis
- Difficult to determine the optimal Parabolic SAR parameter combination, improper parameters may lead to overly aggressive or conservative stop loss
- Relies on a single indicator Parabolic SAR, prone to abnormal fluctuations
- More suitable for trending markets, may stop loss too frequently during consolidation
- Needs to select proper time windows for backtest, incomplete samples may lead to biased results
- Backtest only considers historical data, cannot predict future price moves, live performance may differ from backtest results
Optimization Directions
- Consider combining with other indicators to form an indicator portfolio for higher stability
- Add parameter optimization module to automatically optimize Parabolic SAR parameters
- Add position sizing and order management modules to control capital utilization of each trade
- Add stop loss method options like trailing stop loss, limit orders etc. to make the strategy more comprehensive
- Optimize time window selection to examine strategy robustness across different market environments
- Add machine learning module to dynamically optimize strategy parameters via AI
Summary
The strategy fully utilizes the efficient stop loss function of the Parabolic SAR indicator to achieve momentum tracking stop loss effect. Compared to fixed stop loss points, it can adjust dynamically and automatically track trends for stop loss, avoiding prematurely stopped out positions. Meanwhile, the risks of the strategy cannot be neglected, and need multi-dimensional optimizations and enhancements for stable performance across different markets. Overall, it provides a significantly effective way of stop loss for trend tracking, and is worth further research and application.
[/trans]
Strategy Arguments
| Argument | Default | Description |
|---|---|---|
| v_input_1 | 0.02 | start |
| v_input_2 | 0.02 | increment |
| v_input_3 | 0.2 | maximum |
| v_input_4 | true | From Day |
| v_input_5 | true | From Month |
| v_input_6 | 2018 | From Year |
| v_input_7 | true | To Day |
| v_input_8 | 12 | To Month |
| v_input_9 | 9999 | To Year |
Source (PineScript)
/*backtest
start: 2023-09-26 00:00:00
end: 2023-10-26 00:00:00
period: 4h
basePeriod: 15m
exchanges: [{"eid":"Futures_Binance","currency":"BTC_USDT"}]
*/

//@version=3
// === by @Aldovitch ===
// PSAR Strategy
// Based on Parabolic SAR Strategy provided by TradingView
// added a Time Window for Backtests
//
strategy("Parabolic SAR Strategy w/ Time Window", shorttitle="PSAR Strategy w/ TW", overlay=true)

// === INPUT INDEXES PARAMETERS ===
start = input(0.02)
increment = input(0.02)
maximum = input(0.2)

// === INPUT BACKTEST RANGE ===
FromDay   = input(defval = 1, title = "From Day", minval = 1, maxval = 31)
FromMonth = input(defval = 1, title = "From Month", minval = 1, maxval = 12)
FromYear  = input(defval = 2018, title = "From Year", minval = 2016)
ToDay     = input(defval = 1, title = "To Day", minval = 1, maxval = 31)
ToMonth   = input(defval = 12, title = "To Month", minval = 1, maxval = 12)
ToYear    = input(defval = 9999, title = "To Year", minval = 2017)


// === CONTROL & APPEARENCE ===
timeStart     = timestamp(FromYear, FromMonth, FromDay, 00, 00)  // backtest start window
timeFinish    = timestamp(ToYear, ToMonth, ToDay, 23, 59)        // backtest finish window

// === FUNCTIONS ===
window()  => true // create function "within window of time"


// === COMPUTING INDEXES ===
psar = sar(start, increment, maximum)


if (psar > high)
    strategy.entry("ParLE", strategy.long, stop=psar, comment="ParLE", when=window())
else
    strategy.cancel("ParLE")

if (psar < low)
    strategy.entry("ParSE", strategy.short, stop=psar, comment="ParSE", when=window())
else
    strategy.cancel("ParSE")

//plot(strategy.equity, title="equity", color=red, linewidth=2, style=areabr)
Detail
https://www.fmz.com/strategy/430329
Last Modified
2023-10-27 11:23:18