
9.1 KiB
Name
动量过滤移动平均线策略Momentum-Filtering-Moving-Average-Strategy
Author
ChaoZhang
Strategy Description
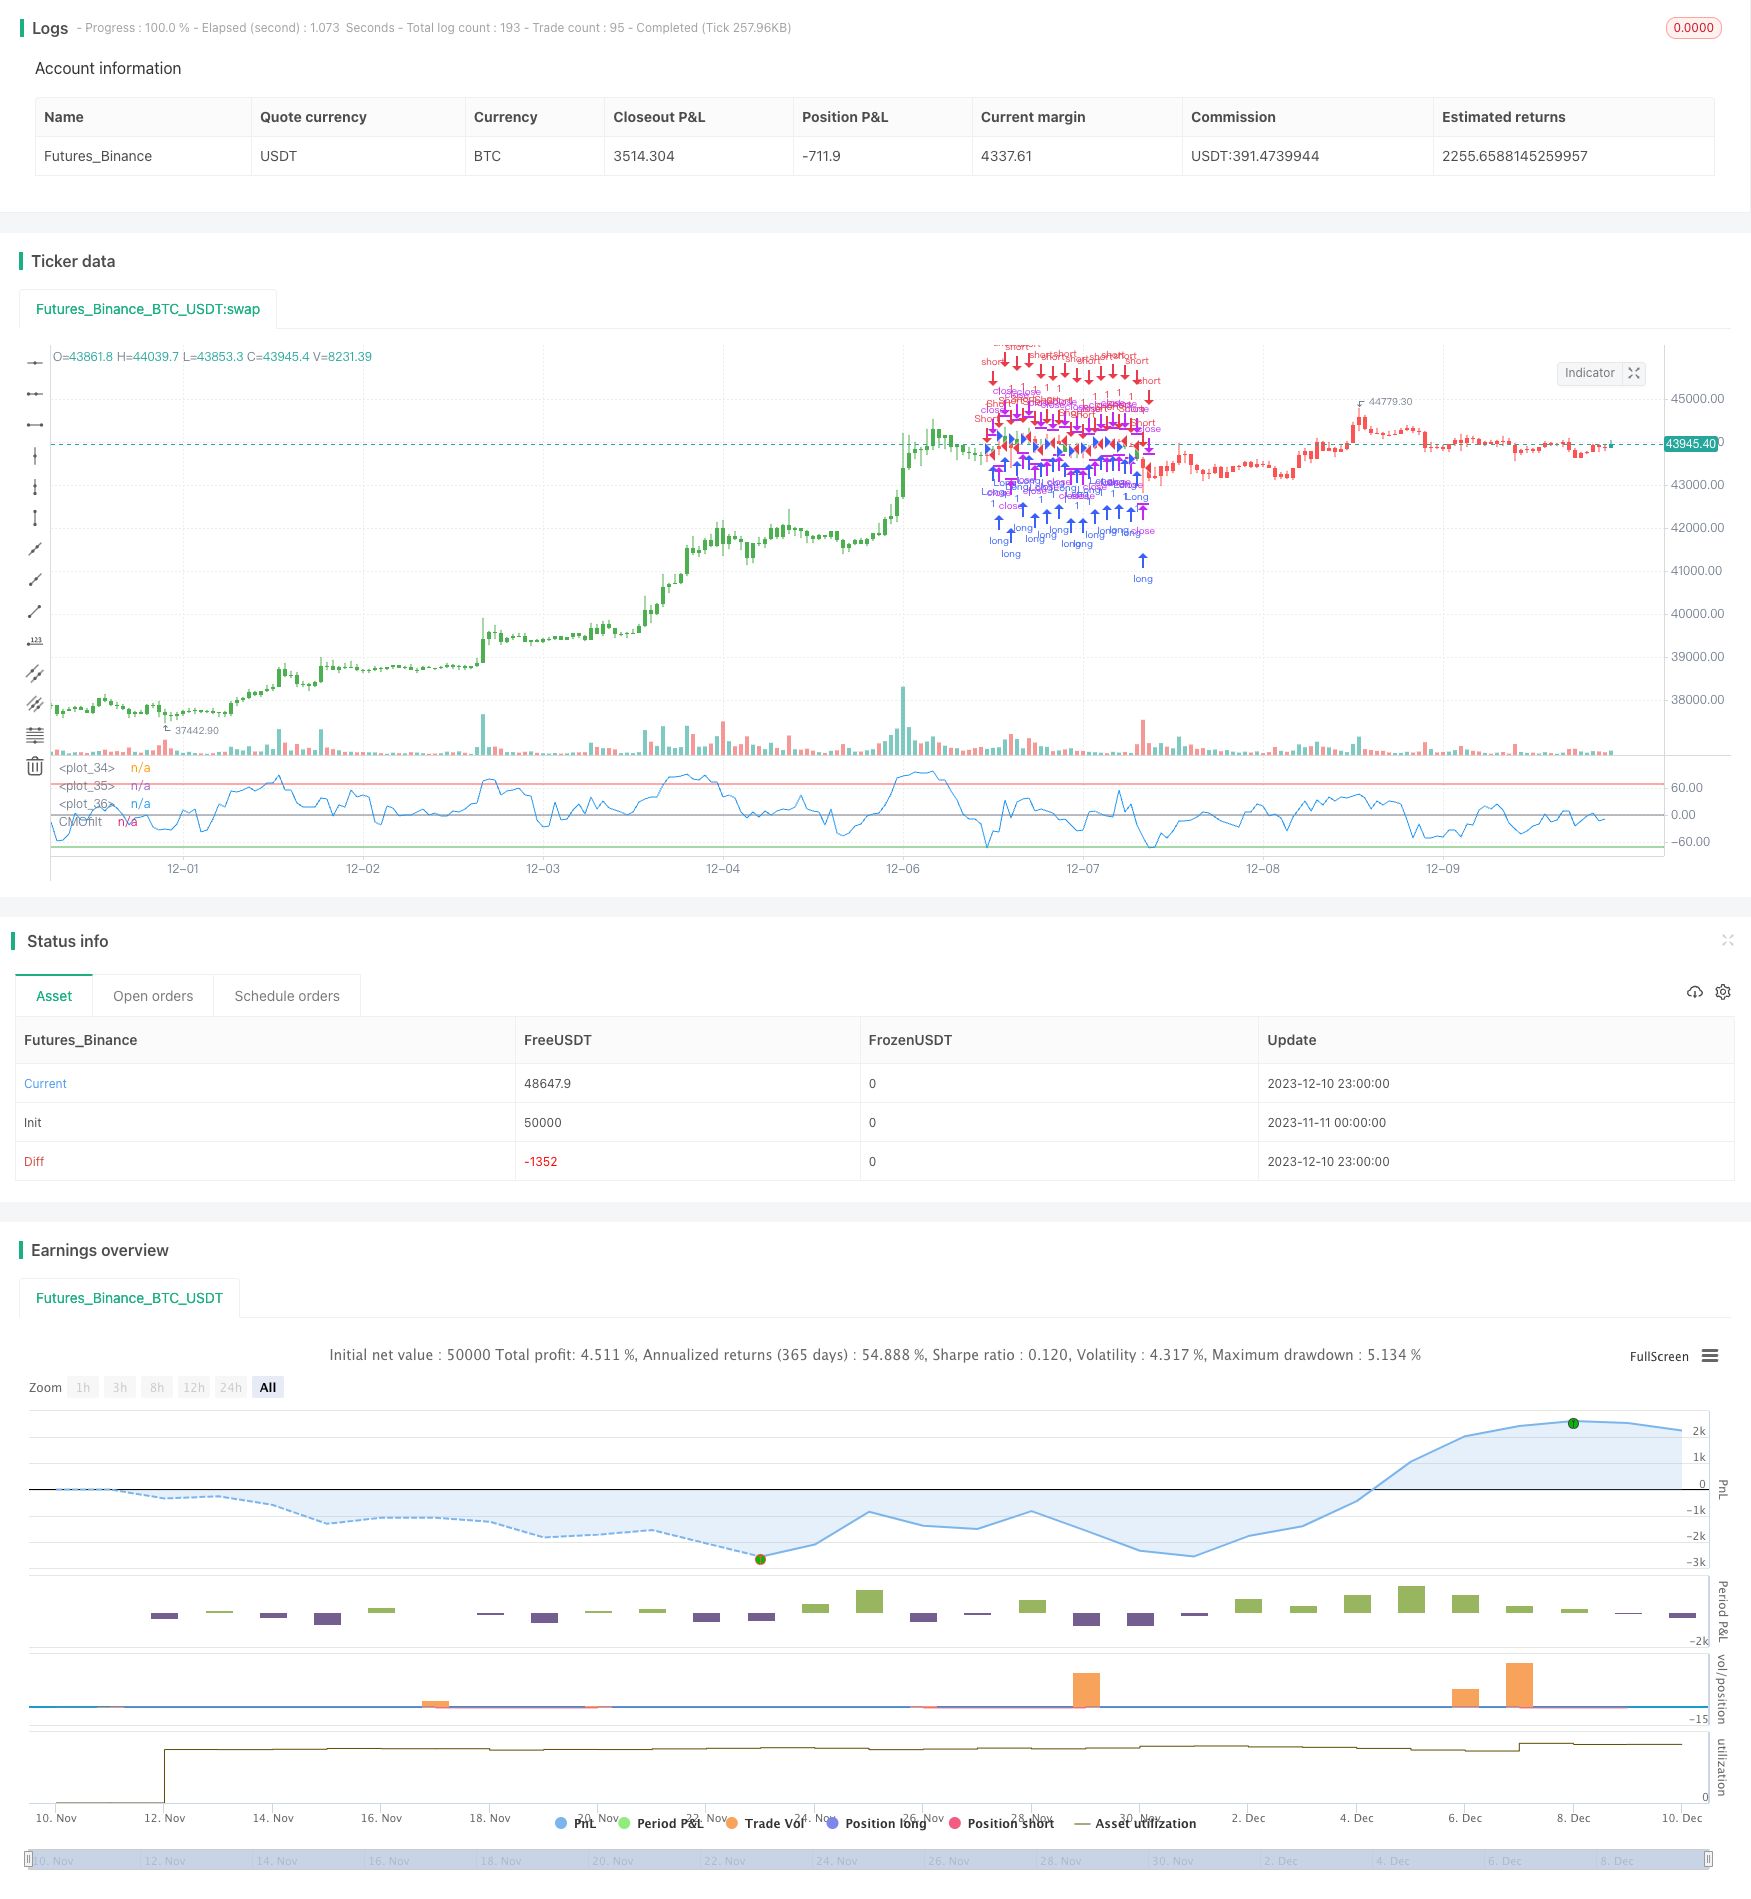 [trans]
概述
这是一个利用动量过滤技术构建的移动平均线交易策略。它通过设置价格变动阈值来过滤小幅价格波动,只选择大幅价格变动参与计算,从而提高策略的稳定性。
策略原理
该策略的核心指标是经过动量过滤的Chande动量摆动指标(CMO)。Chande动量摆动指标属于动量指标的一种,它通过计算多空天数的绝对值之和与价格涨跌差值的和的比值,来判断多空势头。该策略对其进行了改进,设置了一个价格变动最小阈值参数Filter,只有当价格变动超过这个阈值,才会参与CMO的计算。这就过滤了市场中大量的小幅波动,使得指标更加稳定可靠。
在计算指标的基础上,它设定了上线TopBand和下线LowBand,当指标超过这两个线时产生交易信号。最后,反向输入参数reverse可以将原始信号取反,实现逆向操作。
优势分析
这是一个非常稳定可靠的趋势追踪策略,由于采用了动量过滤技术,可以有效过滤市场噪音,防止被套利。策略参数优化空间大,可以通过调整Filter、TopBand、LowBand等参数来优化策略指标。并且具有反向交易功能,可以灵活适应不同市场环境。
风险分析
该策略主要基于趋势追踪,所以在盘整市中容易产生错误信号和亏损。此外,参数优化不当也会导致交易频率过高或信号不稳定。最后,反向交易参数使用不当,可能导致不必要的亏损。
为降低这些风险,应该合理优化参数,使信号更加稳定可靠;在盘整市避免使用该策略,选择更适合的策略工具;谨慎使用反向交易功能,在Parameter优化不佳时应避免开启。
优化方向
该策略可以从以下几个方向进行优化:
-
优化Filter参数值,在保证过滤市场噪声的同时,也要确保交易频率不会过低。
-
优化TopBand和LowBand的参数区间,使其与市场波动幅度相匹配,防止错误信号。
-
利用walk forward analysis等方法动态优化参数,使策略参数适应市场的变化。
-
增加止损止盈逻辑,设置合理的止损点来控制亏损。
-
结合其他指标滤波,如MACD、KD等,避免非趋势市场的错误交易。
总结
这是一个非常实用的趋势追踪策略。它采用动量过滤技术,可以有效抑制市场噪声,使信号更加清晰可靠。通过参数优化和逻辑优化,可以将其调教成一个可靠稳定的量化交易工具。但仍需注意防止在盘整市场使用以及参数优化不当带来的风险。总的来说,这是一个非常有应用前景的策略模板。
||
Overview
This is a moving average trading strategy built with momentum filtering techniques. It sets a threshold for price changes to filter out small price fluctuations, only selecting large price movements for calculation, thereby improving the stability of the strategy.
Strategy Logic
The core indicator of this strategy is the Chande Momentum Oscillator (CMO) filtered by momentum. The Chande Momentum Oscillator is a kind of momentum indicator that judges the momentum of trends by calculating the ratio of the sum of the absolute values of up days and down days to the sum of price rises and falls. This strategy improves it by setting a minimum threshold of price changes called Filter. Only when the price change exceeds this threshold will it participate in the CMO calculation. This filters out a lot of small fluctuations in the market and makes the indicator more stable and reliable.
Based on the indicator calculation, it sets upper line TopBand and lower line LowBand. When the indicator exceeds these two lines, trading signals are generated. Finally, the reverse input parameter can reverse the original signals to realize reverse operation.
Advantage Analysis
This is a very stable and reliable trend-following strategy. By adopting momentum filtering techniques, it can effectively filter out market noise and prevent being trapped. The strategy has large parameter optimization space, parameters like Filter, TopBand, LowBand, etc. can be adjusted to optimize the strategy indicator. It also has reverse trading functionality that can flexibly adapt to different market environments.
Risk Analysis
The strategy mainly relies on trend-following, so it is prone to generating false signals and losses in range-bound markets. In addition, improper parameter optimization can also lead to excessive trading frequency or unstable signals. Finally, improper use of the reverse trading parameter may lead to unnecessary losses.
To reduce these risks, parameters should be reasonably optimized to make the signals more stable and reliable; avoid using this strategy in range-bound markets, choose more suitable strategy tools; use reverse trading functions with caution, avoid enabling it when parameter optimization is not ideal.
Optimization Directions
The strategy can be optimized in the following aspects:
-
Optimize the Filter parameter value, ensure filtering market noise while keeping trading frequency not too low.
-
Optimize the parameter range of TopBand and LowBand to match the market volatility range to prevent false signals.
-
Use walk forward analysis and other methods to dynamically optimize parameters so that strategy parameters adapt to market changes.
-
Add stop loss logic and set reasonable stop loss points to control losses.
-
Filter with other technical indicators like MACD, KD to avoid false trades in non-trending markets.
Summary
This is a very practical trend-following strategy. It adopts momentum filtering techniques to effectively curb market noise and make clearer and more reliable signals. Through parameter optimization and logic optimization, it can be tuned into a reliable and stable quantitative trading tool. Still, risks from using it in range-bound markets and improper parameter optimization need to be noted. In general, this is a strategy template with great application prospects.
[/trans]
Strategy Arguments
| Argument | Default | Description |
|---|---|---|
| v_input_1 | 9 | Length |
| v_input_2 | 3 | Filter |
| v_input_3 | 70 | TopBand |
| v_input_4 | -70 | LowBand |
| v_input_5 | false | Trade reverse |
Source (PineScript)
/*backtest
start: 2023-11-11 00:00:00
end: 2023-12-11 00:00:00
period: 1h
basePeriod: 15m
exchanges: [{"eid":"Futures_Binance","currency":"BTC_USDT"}]
*/

//@version=2
////////////////////////////////////////////////////////////
//  Copyright by HPotter v1.0 02/03/2017
// This indicator plots a CMO which ignores price changes which are less
// than a threshold value. CMO was developed by Tushar Chande. A scientist,
// an inventor, and a respected trading system developer, Mr. Chande developed
// the CMO to capture what he calls "pure momentum". For more definitive
// information on the CMO and other indicators we recommend the book The New
// Technical Trader by Tushar Chande and Stanley Kroll.
// The CMO is closely related to, yet unique from, other momentum oriented
// indicators such as Relative Strength Index, Stochastic, Rate-of-Change, etc.
// It is most closely related to Welles Wilder`s RSI, yet it differs in several ways:
// - It uses data for both up days and down days in the numerator, thereby directly
// measuring momentum;
// - The calculations are applied on unsmoothed data. Therefore, short-term extreme
// movements in price are not hidden. Once calculated, smoothing can be applied to the
// CMO, if desired;
// - The scale is bounded between +100 and -100, thereby allowing you to clearly see
// changes in net momentum using the 0 level. The bounded scale also allows you to
// conveniently compare values across different securities.
//
// You can change long to short in the Input Settings
// Please, use it only for learning or paper trading. Do not for real trading.
////////////////////////////////////////////////////////////
fFilter(xSeriesSum, xSeriesV, Filter) =>
    iff(xSeriesV > Filter, xSeriesSum, 0)

strategy(title="CMOfilt", shorttitle="CMOfilt")
Length = input(9, minval=1)
Filter = input(3, minval=1)
TopBand = input(70, minval=1)
LowBand = input(-70, maxval=-1)
reverse = input(false, title="Trade reverse")
hline(0, color=gray, linestyle=line)
hline(TopBand, color=red, linestyle=line)
hline(LowBand, color=green, linestyle=line)
xMom = close - close[1]
xMomAbs = abs(close - close[1])
xMomFilter = fFilter(xMom, xMomAbs, Filter)
xMomAbsFilter = fFilter(xMomAbs,xMomAbs, Filter)
nSum = sum(xMomFilter, Length)
nAbsSum = sum(xMomAbsFilter, Length)
nRes =   100 * nSum / nAbsSum
pos = iff(nRes > TopBand, 1,
	     iff(nRes < LowBand, -1, nz(pos[1], 0)))
possig = iff(reverse and pos == 1, -1,
          iff(reverse and pos == -1, 1, pos))
if (possig == 1 )
    strategy.entry("Long", strategy.long)
if (possig == -1 )
    strategy.entry("Short", strategy.short)
barcolor(possig == -1 ? red: possig == 1 ? green : blue )
plot(nRes, color=blue, title="CMOfilt")
Detail
https://www.fmz.com/strategy/435105
Last Modified
2023-12-12 12:35:05