
8.8 KiB
Name
动量转向形态反转策略Momentum-Reversal-Trading-Strategy
Author
ChaoZhang
Strategy Description
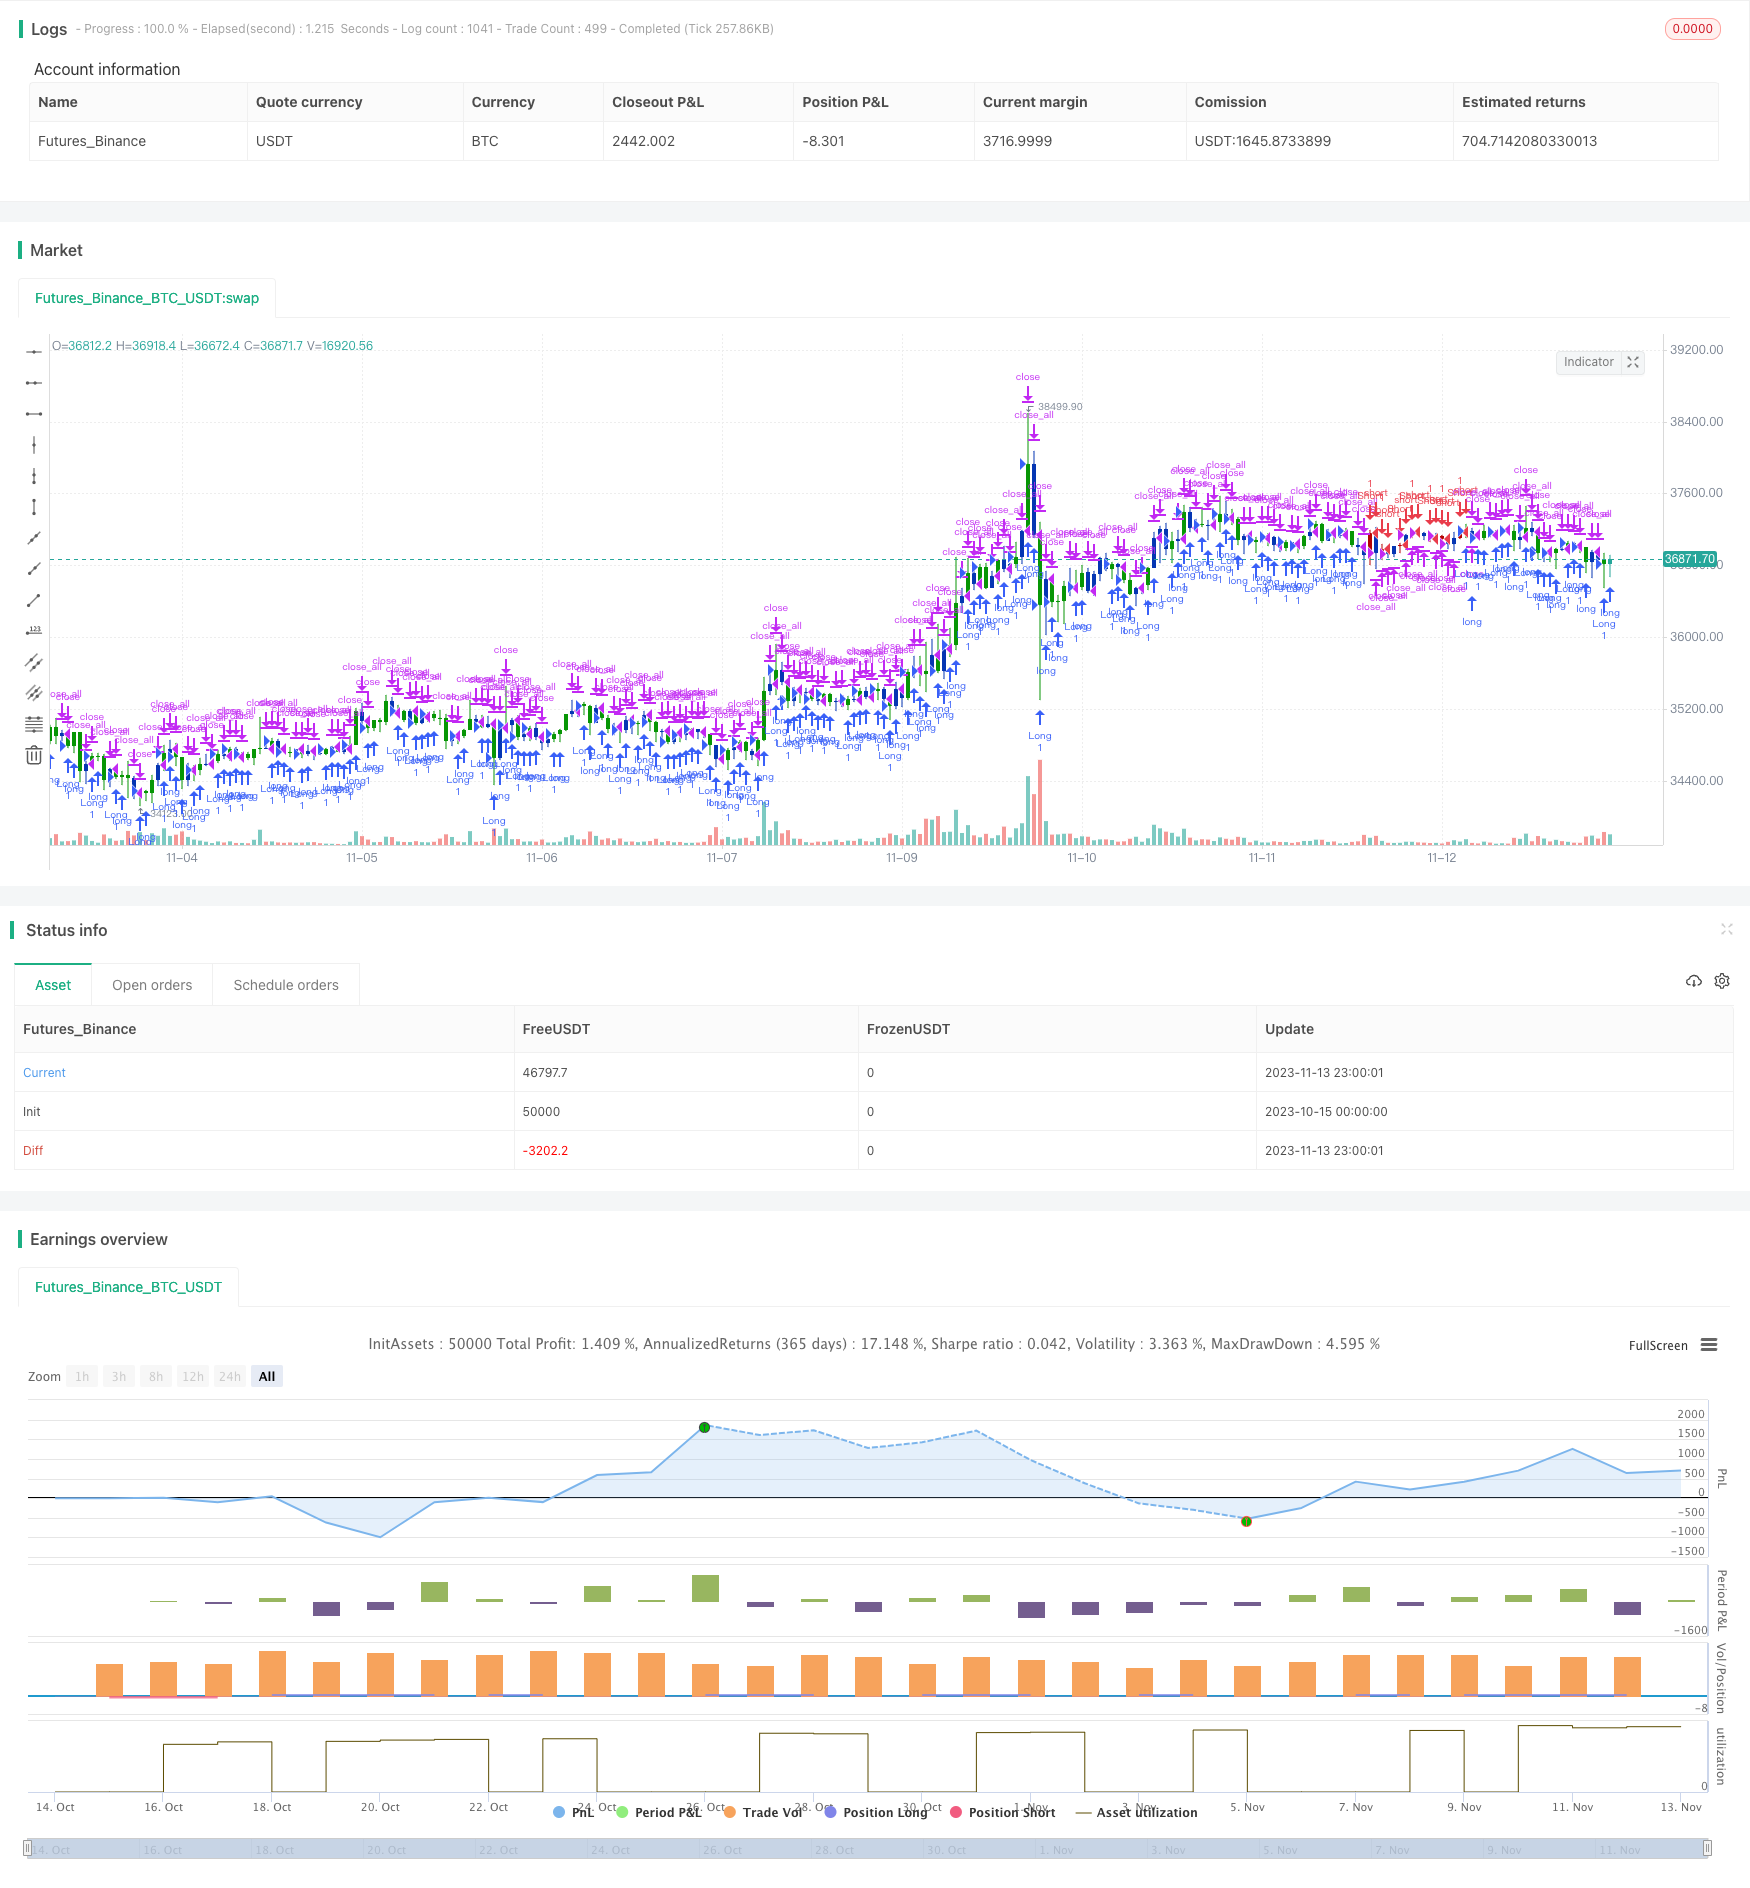 [trans]
概述
该策略结合了123形态反转和易于移动两种策略,目的是通过捕捉价格的转折点来进行交易。123形态反转策略在股票价格连续三日形成特定模型时产生信号。易于移动(EOM)策略则利用价格和交易量变化判断市场动量。这两种策略相结合,既考虑了价格的技术形态,也考虑了市场动量,从而提高交易信号的准确性。
策略原理
该策略由两部分组成:
- 123形态反转策略
- 使用Stoch指标判断超买超卖
- 当收盘价连续两日下跌,且Stoch快线高于慢线时做空
- 当收盘价连续两日上涨,且Stoch快线低于慢线时做多
- 易于移动策略
- 计算前一日的区间中点
- 计算区间中点相对于前一日的移动(变化)
- 计算区间中点移动和成交量的比值
- 比值大于阈值时看涨,小于阈值时看跌
综合两个信号,当Easy of Movement和123形态同时做多信号时,开多仓;当Easy of Movement和123形态同时做空信号时,开空仓。
优势分析
该策略具有以下优势:
-
结合价格技术形态和市场动量,提高信号准确性
-
123形态反转捕捉转折点,易于移动判断趋势动量,二者互补
-
Stoch指标避免在盘整中反复开平仓
-
交易逻辑简单清晰,容易实施
-
可自定义参数,适应不同市场环境
风险分析
该策略也存在一些风险:
-
过于依赖参数设置,参数不当可能导致交易频繁或漏单
-
多种过滤条件联合使用,信号产生频率可能过低
-
易于移动指标对市场波动敏感,可引发假信号
-
实盘略逊回测,需要控制仓位规模
-
仅适用趋势性股票,不适合盘整市
优化方向
可以从以下几方面优化该策略:
-
优化参数,调整过滤条件严格程度,平衡交易频率和信号质量
-
加入止损策略,严格控制单笔损失
-
结合趋势过滤,避免逆势交易
-
增加资金管理模块,根据波动率动态调整仓位
-
采用机器学习方法优化参数,使之动态适应市场
总结
该策略整合价格技术指标和市场动量指标,在捕捉转折点的同时确认趋势质量,具有较高的实战价值。但也需要注意控制交易频率、单笔损失和逆势操作的风险。通过参数优化、止损策略、趋势过滤等手段可以进一步提升策略的稳定性和盈利能力。该策略思路清晰易于实施,值得量化交易者继续研究和改进。
||
Overview
This strategy combines the 123 reversal pattern and Ease of Movement (EOM) to trade at turning points. The 123 reversal pattern generates signals when the price forms specific patterns over 3 consecutive days. The EOM strategy utilizes changes in price and volume to gauge market momentum. The combination of both strategies considers technical patterns as well as momentum, improving the accuracy of trading signals.
Strategy Logic
The strategy consists of two components:
- 123 Reversal Pattern
- Use Stoch to identify overbought and oversold levels
- Go short when price falls for 2 consecutive days and Stoch fast line is above slow line
- Go long when price rises for 2 consecutive days and Stoch fast line is below slow line
- Ease of Movement
- Calculate midpoint of previous day's range
- Calculate change in midpoint relative to previous day
- Calculate ratio of midpoint move and volume
- Ratio above threshold indicates bullish, below threshold bearish
The strategy goes long when EOM and 123 signals align on the long side, and goes short when signals align on the short side.
Advantage Analysis
The advantages of this strategy:
-
Combines price patterns and momentum for better signal accuracy
-
123 pattern catches turning points, EOM gauges trend momentum, two complement each other
-
Stoch avoids whipsaws during consolidation
-
Simple and easy to implement
-
Customizable parameters for different market environments
Risk Analysis
The risks to consider:
-
Overly reliant on parameter settings, improper settings may lead to overtrading or missing trades
-
Many filters may generate too few signals
-
EOM sensitive to volatility, may generate false signals
-
Live performance weaker than backtest, need to control position sizing
-
Only suitable for trending stocks, not ranging markets
Improvement Directions
The strategy can be improved by:
-
Optimizing parameters to balance frequency and quality of signals
-
Adding stop loss to control single trade loss
-
Adding trend filter to avoid counter-trend trades
-
Incorporating position sizing based on volatility
-
Using machine learning to dynamically optimize parameters
Conclusion
This strategy integrates price patterns and momentum for high practical value. But trading frequency, loss control and counter-trend risks need to be managed. Further improvements in parameters, stop loss, trend filtering can enhance stability and profitability. The logic is clear and easy to implement for quant traders.
[/trans]
Strategy Arguments
| Argument | Default | Description |
|---|---|---|
| v_input_1 | 14 | Length |
| v_input_2 | true | KSmoothing |
| v_input_3 | 3 | DLength |
| v_input_4 | 50 | Level |
| v_input_5 | 4000 | BuyZone |
| v_input_6 | -4000 | SellZone |
| v_input_7 | false | Trade reverse |
Source (PineScript)
/*backtest
start: 2023-10-15 00:00:00
end: 2023-11-14 00:00:00
period: 1h
basePeriod: 15m
exchanges: [{"eid":"Futures_Binance","currency":"BTC_USDT"}]
*/

//@version=4
////////////////////////////////////////////////////////////
//  Copyright by HPotter v1.0 14/04/2020
// This is combo strategies for get a cumulative signal.
//
// First strategy
// This System was created from the Book "How I Tripled My Money In The
// Futures Market" by Ulf Jensen, Page 183. This is reverse type of strategies.
// The strategy buys at market, if close price is higher than the previous close
// during 2 days and the meaning of 9-days Stochastic Slow Oscillator is lower than 50.
// The strategy sells at market, if close price is lower than the previous close price
// during 2 days and the meaning of 9-days Stochastic Fast Oscillator is higher than 50.
//
// Second strategy
// This indicator gauges the magnitude of price and volume movement.
// The indicator returns both positive and negative values where a
// positive value means the market has moved up from yesterday's value
// and a negative value means the market has moved down. A large positive
// or large negative value indicates a large move in price and/or lighter
// volume. A small positive or small negative value indicates a small move
// in price and/or heavier volume.
// A positive or negative numeric value. A positive value means the market
// has moved up from yesterday's value, whereas, a negative value means the
// market has moved down.
//
// WARNING:
// - For purpose educate only
// - This script to change bars colors.
////////////////////////////////////////////////////////////
Reversal123(Length, KSmoothing, DLength, Level) =>
    vFast = sma(stoch(close, high, low, Length), KSmoothing)
    vSlow = sma(vFast, DLength)
    pos = 0.0
    pos := iff(close[2] < close[1] and close > close[1] and vFast < vSlow and vFast > Level, 1,
	         iff(close[2] > close[1] and close < close[1] and vFast > vSlow and vFast < Level, -1, nz(pos[1], 0)))
	pos

EOM(BuyZone, SellZone) =>
    pos = 0
    xHigh = high
    xLow = low
    xVolume = volume
    xHalfRange = (xHigh - xLow) * 0.5
    xMidpointMove = mom(xHalfRange, 1)
    xBoxRatio = iff((xHigh - xLow) != 0, xVolume / (xHigh - xLow), 0)
    nRes = iff(xBoxRatio != 0, 1000000 * ((xMidpointMove - xMidpointMove[1]) / xBoxRatio), 0)
    pos := iff(nRes > BuyZone, 1,
             iff(nRes < SellZone, -1, nz(pos[1], 0)))
    pos

strategy(title="Combo Backtest 123 Reversal & Ease of Movement (EOM)", shorttitle="Combo", overlay = true)
Length = input(14, minval=1)
KSmoothing = input(1, minval=1)
DLength = input(3, minval=1)
Level = input(50, minval=1)
//-------------------------
BuyZone = input(4000, minval=1)
SellZone = input(-4000)
reverse = input(false, title="Trade reverse")
posReversal123 = Reversal123(Length, KSmoothing, DLength, Level)
posEOM = EOM(BuyZone, SellZone)
pos = iff(posReversal123 == 1 and posEOM == 1 , 1,
	   iff(posReversal123 == -1 and posEOM == -1, -1, 0))
possig = iff(reverse and pos == 1, -1,
          iff(reverse and pos == -1 , 1, pos))
if (possig == 1)
    strategy.entry("Long", strategy.long)
if (possig == -1)
    strategy.entry("Short", strategy.short)
if (possig == 0)
    strategy.close_all()
barcolor(possig == -1 ? #b50404: possig == 1 ? #079605 : #0536b3 )
Detail
https://www.fmz.com/strategy/432209
Last Modified
2023-11-15 15:36:39