
12 KiB
Name
动量结合趋势判断型多因子量化交易策略Momentum-Combined-with-Trend-Judgment-Multi-factor-Quantitative-Trading-Strategy
Author
ChaoZhang
Strategy Description
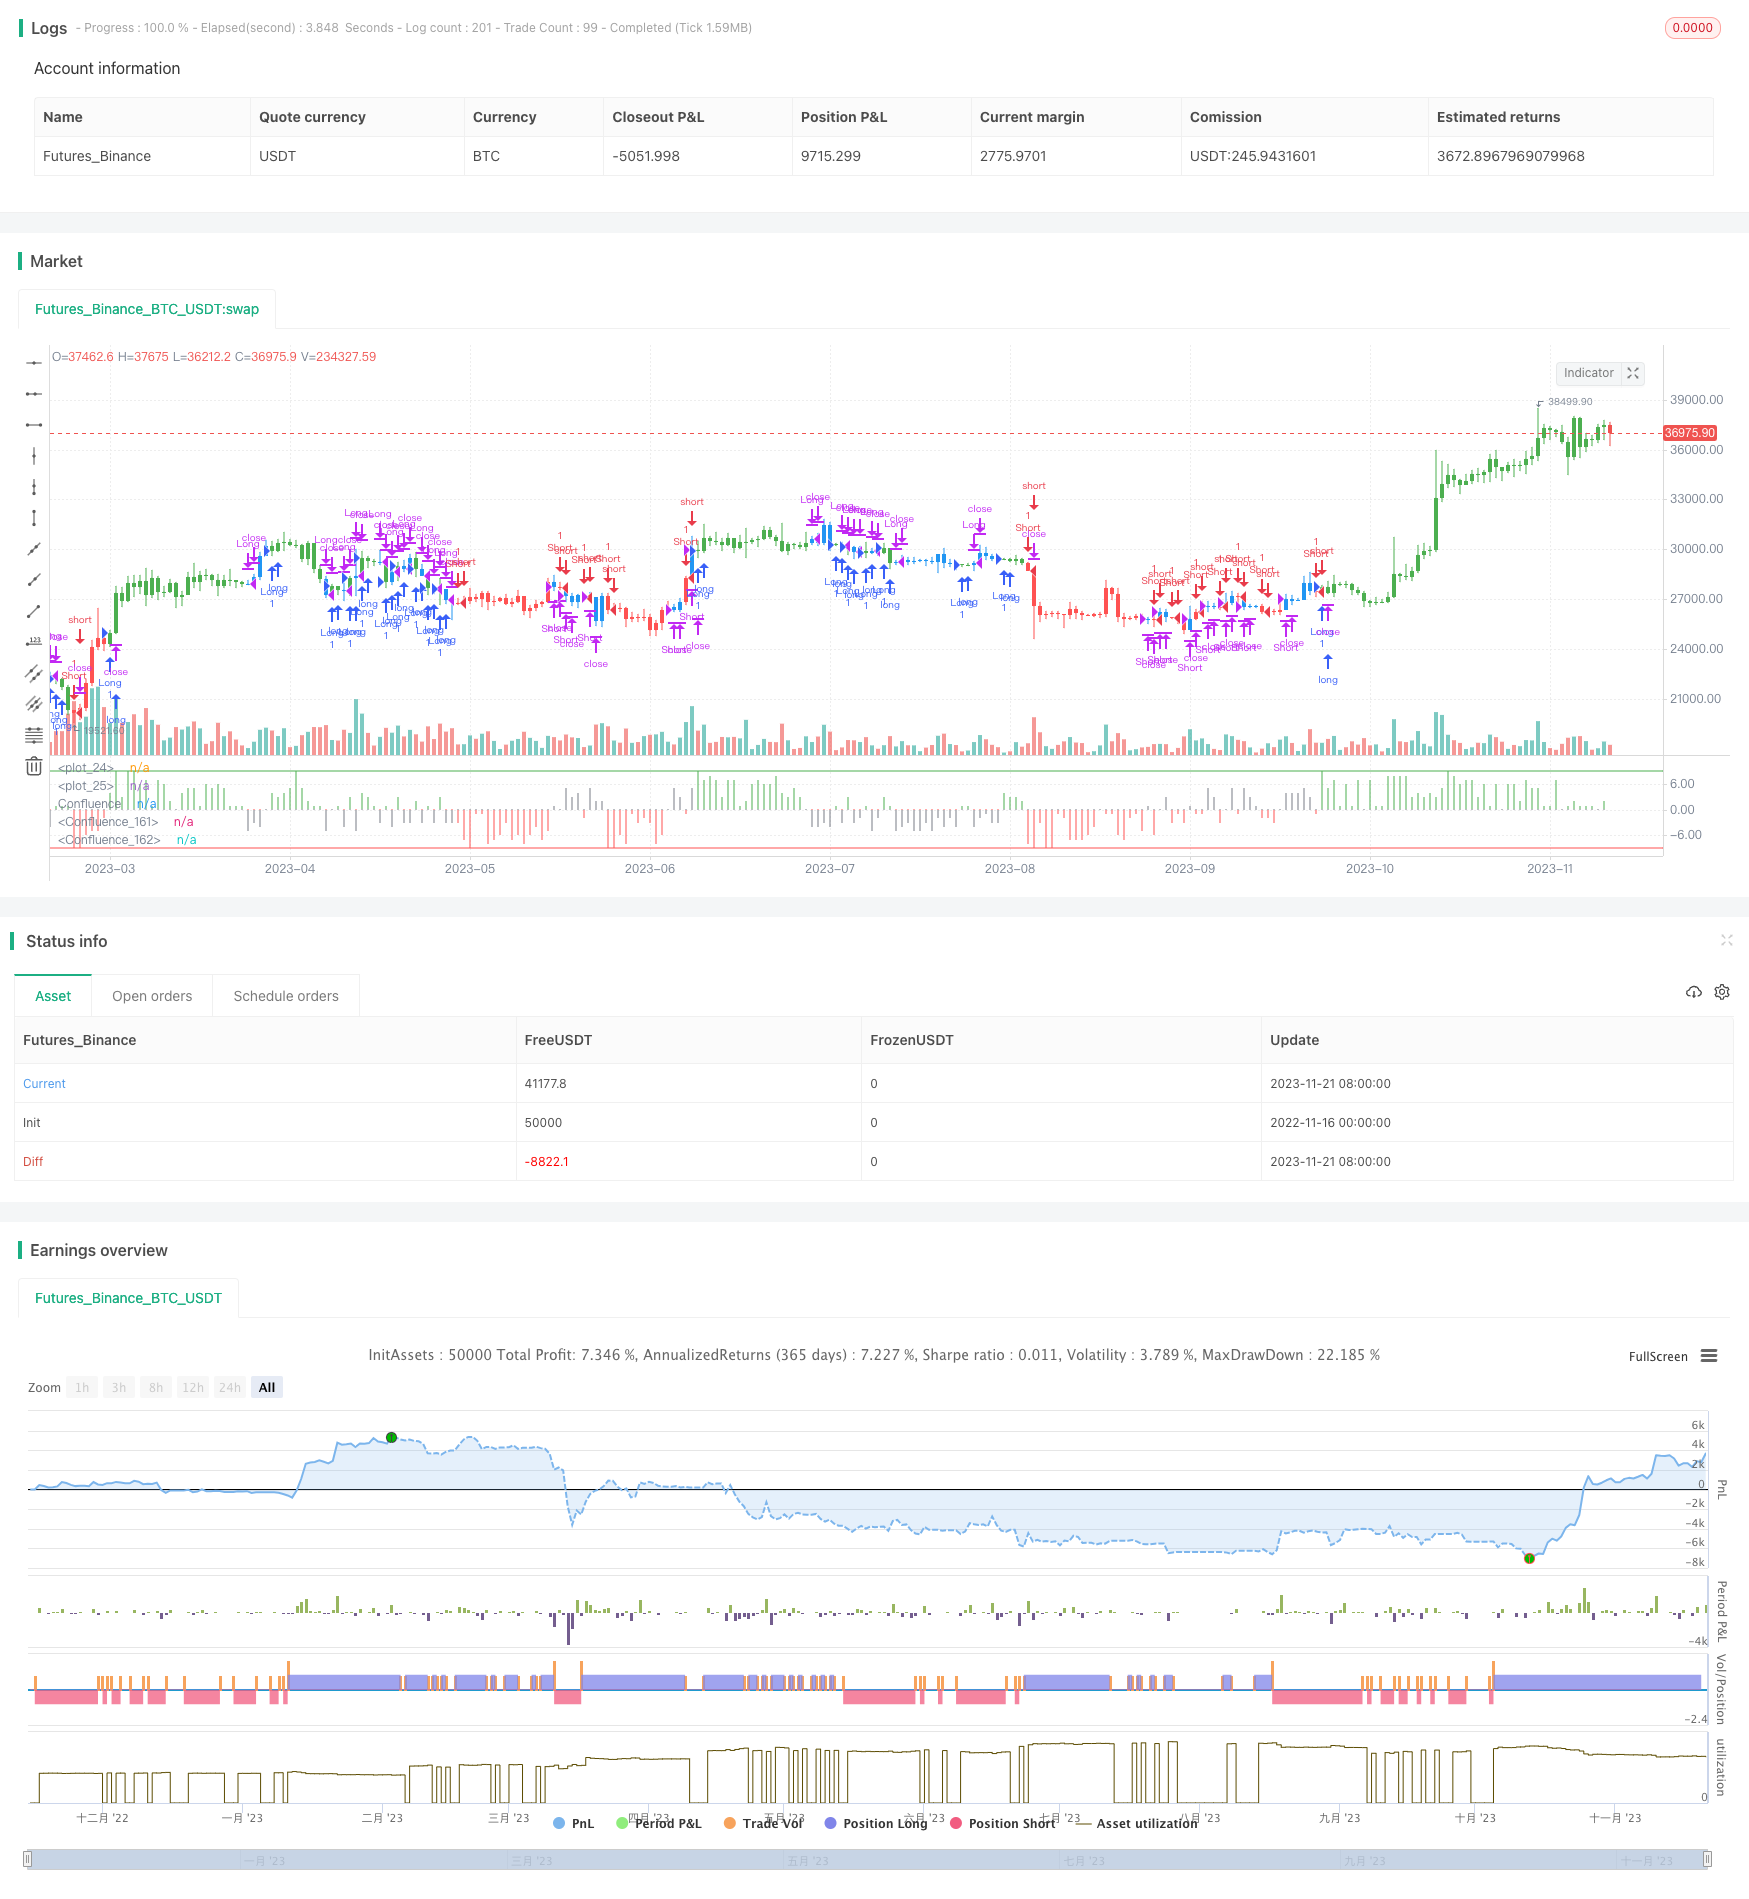 [trans]
概述
本策略是一个结合动量指标和趋势指标的多因子判断型量化交易策略。策略通过计算多种平均线的数学组合,判断市场的总体趋势和动量方向,根据阈值条件发出交易信号。
策略原理
- 计算多组平均线和动量指标
- 计算Harmonics平均线、短期平均线、中期平均线、长期平均线等多组平均线
- 计算各平均线间的差值,反映价格变化趋势
- 计算各平均线的一阶导数,反映价格变化动量
- 计算正弦余弦指标,判断趋势方向
- 综合判断交易信号
- 将动量指标、趋势指标等多因子进行加权运算
- 根据结果值距离阈值远近,判断当前市场状态
- 发出做多做空交易信号
优势分析
- 多因子判断,提高信号准确率
- 综合考虑价格、趋势、动量多个因素
- 不同因子可配置不同权重
- 参数可调,适应不同市场
- 平均线参数、交易区间边界可自定义
- 可适应不同周期和市场环境
- 代码结构清晰,易于理解
- 命名规范,注释完整
- 易于二次开发和优化
风险分析
- 参数优化难度大
- 需要大量历史数据回测寻找最优参数
- 交易频率可能过高
- 多因子组合判断,可能产生过多交易
- 效果与市场相关性大
- 趋势判断策略,容易受到非理性行为影响
优化方向
- 加入止损逻辑
- 可避免非理性行为带来的较大亏损
- 优化参数设置
- 寻找最优参数组合,提高策略稳定性
- 增加机器学习元素
- 使用深度学习判断当前市场状态,辅助策略决策
总结
本策略通过动量指标和趋势指标的多因子组合,对市场状态进行判断,根据设置的阈值发出交易信号。策略优势在于可配置性强,适合不同市场环境,且容易理解;劣势是参数优化难度大,交易频率可能过高,效果与市场相关性强。未来可通过加入止损、参数优化和机器学习等手段进行进一步优化。
||
Overview
This strategy is a multi-factor judged quantitative trading strategy that combines momentum indicators and trend indicators. The strategy judges the overall trend and momentum direction of the market by calculating mathematical combinations of multiple moving averages, and generates trading signals based on threshold conditions.
Strategy Principle
- Calculate multiple moving averages and momentum indicators
- Calculate Harmonics moving average, short-term moving average, medium-term moving average, long-term moving average and other multiple moving averages
- Calculate the difference between each moving average to reflect the trend of price changes
- Calculate the first order derivative of each moving average to reflect the momentum of price changes
- Calculate the sine and cosine indicators to determine the trend direction
- Comprehensively judge trading signals
- Weighted calculation of momentum indicators, trend indicators and other multi-factors
- Judge the current market state according to the distance between the result value and the threshold
- Issue long and short trading signals
Advantage Analysis
- Multi-factor judgment improves signal accuracy
- Comprehensively consider price, trend, momentum and other factors
- Different factors can be configured with different weights
- Adjustable parameters, adaptable to different markets
- Parameters of moving averages, boundary of trading range can be customized
- Can adapt to different cycles and market environments
- Clear code structure, easy to understand
- Naming specifications, complete comments
- Easy to secondary development and optimization
Risk Analysis
- Difficulty in parameter optimization is high
- Requires a lot of historical data backtesting to find the optimal parameters
- Trading frequency may be too high
- Multi-factor combination judgment may result in too many transactions
- High correlation with market
- Trend judgment strategies are prone to irrational behavior
Optimization Directions
- Add stop loss logic
- Avoid major losses caused by irrational behaviors
- Optimize parameter settings
- Find optimal parameter combinations to improve strategy stability
- Increase machine learning elements
- Use deep learning to judge current market state and assist strategy decisions
Summary
This strategy judges the market state through the multi-factor combination of momentum indicators and trend indicators, and issues trading signals based on set thresholds. The advantages of the strategy are strong configurability, adaptability to different market environments, and easy understanding; the disadvantages are the difficulty in parameter optimization, possibly too high trading frequency, and high correlation with the market. Future optimizations can be made by adding stop loss, parameter optimization and machine learning.
[/trans]
Strategy Arguments
| Argument | Default | Description |
|---|---|---|
| v_input_1 | 10 | Harmonic |
| v_input_2 | 9 | BuyBand |
| v_input_3 | -9 | SellBand |
| v_input_4 | false | Trade reverse |
Source (PineScript)
/*backtest
start: 2022-11-16 00:00:00
end: 2023-11-22 00:00:00
period: 1d
basePeriod: 1h
exchanges: [{"eid":"Futures_Binance","currency":"BTC_USDT"}]
*/

//@version=2
////////////////////////////////////////////////////////////
//  Copyright by HPotter v1.0 14/03/2017
// This is modified version of Dale Legan's "Confluence" indicator written by Gary Fritz.
// ================================================================
// Here is Gary`s commentary:
// Since the Confluence indicator returned several "states" (bull, bear, grey, and zero),
// he modified the return value a bit:
// -9 to -1 = Bearish
// -0.9 to 0.9 = "grey" (and zero)
// 1 to 9 = Bullish
// The "grey" range corresponds to the "grey" values plotted by Dale's indicator, but
// they're divided by 10.
//
// You can change long to short in the Input Settings
// Please, use it only for learning or paper trading. Do not for real trading.
////////////////////////////////////////////////////////////

strategy(title="Confluence", shorttitle="Confluence")
Harmonic = input(10, minval=1)
BuyBand = input(9)
SellBand = input(-9)
reverse = input(false, title="Trade reverse")
hline(SellBand, color=red, linestyle=line)
hline(BuyBand, color=green, linestyle=line)

Price = close

STL = round((Harmonic * 2) - 1 - 0.5)
ITL = round((STL * 2) - 1 - 0.5)
LTL = round((ITL * 2) - 1 - 0.5)
HOFF = round(Harmonic / 2 - 0.5)
SOFF = round(STL / 2 - 0.5)
IOFF = round(ITL / 2 - 0.5)

xHavg = sma(Price, Harmonic)
xSavg = sma(Price, STL)
xIavg = sma(Price, ITL)
xLavg = sma(Price, LTL)

xvalue2 = xSavg - xHavg[HOFF]
xvalue3 = xIavg - xSavg[SOFF]
xvalue12 = xLavg - xIavg[IOFF]

xmomsig = xvalue2 + xvalue3 + xvalue12

xLavgOHLC = sma(ohlc4, LTL - 1)

xH2 = sma(Price, Harmonic - 1)
xS2 = sma(Price, STL - 1)
xI2 = sma(Price, ITL - 1)
xL2 = sma(Price, LTL - 1)

DerivH = (xHavg * 2) - xHavg[1]
DerivS = (xSavg * 2) - xSavg[1]
DerivI = (xIavg * 2) - xIavg[1]
DerivL = (xLavg * 2) - xLavg[1]
SumDH = Harmonic * DerivH
SumDS = STL * DerivS
SumDI = ITL * DerivI
SumDL = LTL * DerivL

LengH = Harmonic - 1
LengS = STL - 1
LengI = ITL - 1
LengL = LTL - 1

N1H = xH2 * LengH
N1S = xS2 * LengS
N1I = xI2 * LengI
N1L = xL2 * LengL

DRH = SumDH - N1H
DRS = SumDS - N1S
DRI = SumDI - N1I
DRL = SumDL - N1L

SumH = xH2 * (Harmonic - 1)
SumS = xS2 * (STL - 1)
SumI = xI2 * (ITL - 1)
SumL = xLavgOHLC * (LTL - 1)

xvalue5 = (SumH + DRH) / Harmonic
xvalue6 = (SumS + DRS) / STL
xvalue7 = (SumI + DRI) / ITL
xvalue13 = (SumL + DRL) / LTL

value9 = xvalue6 - xvalue5[HOFF]
value10 = xvalue7 - xvalue6[SOFF]
value14 = xvalue13 - xvalue7[IOFF]
xmom = value9 + value10 + value14

HT = sin(xvalue5 * 2 * 3.14 / 360) + cos(xvalue5 * 2 * 3.14 / 360)
HTA = sin(xHavg * 2 * 3.14 / 360) + cos(xHavg * 2 * 3.14 / 360)
ST = sin(xvalue6 * 2 * 3.14 / 360) + cos(xvalue6 * 2 * 3.14 / 360)
STA = sin(xSavg * 2 * 3.14 / 360) + cos(xSavg * 2 * 3.14 / 360)
IT = sin(xvalue7 * 2 * 3.14 / 360) + cos(xvalue7 * 2 * 3.14 / 360)
ITA = sin(xIavg * 2 * 3.14 / 360) + cos(xIavg * 2 * 3.14 / 360)

xSum = HT + ST + IT
xErr = HTA + STA + ITA

Condition2 = (((xSum > xSum[SOFF]) and (xHavg < xHavg[SOFF])) or ((xSum < xSum[SOFF]) and (xHavg > xHavg[SOFF])))
Phase = iff(Condition2 , -1 , 1)
xErrSum = (xSum - xErr) * Phase
xErrSig = sma(xErrSum, SOFF)

xvalue70 = xvalue5 - xvalue13
xvalue71 = sma(xvalue70, Harmonic)


ErrNum = iff (xErrSum > 0 and xErrSum < xErrSum[1] and xErrSum < xErrSig, 1,
          iff (xErrSum > 0 and xErrSum < xErrSum[1] and xErrSum > xErrSig, 2,
           iff (xErrSum > 0 and xErrSum > xErrSum[1] and xErrSum < xErrSig, 2,
             iff (xErrSum > 0 and xErrSum > xErrSum[1] and xErrSum > xErrSig, 3,
              iff (xErrSum < 0 and xErrSum > xErrSum[1] and xErrSum > xErrSig, -1,
               iff (xErrSum < 0 and xErrSum < xErrSum[1] and xErrSum > xErrSig, -2,
                 iff (xErrSum < 0 and xErrSum > xErrSum[1] and xErrSum < xErrSig, -2,
                  iff (xErrSum < 0 and xErrSum < xErrSum[1] and xErrSum < xErrSig, -3, 0))))))))


momNum = iff (xmom > 0 and xmom < xmom[1] and xmom < xmomsig , 1,
          iff (xmom > 0 and xmom < xmom[1] and xmom > xmomsig, 2,
           iff (xmom > 0 and xmom > xmom[1] and xmom < xmomsig, 2,
             iff (xmom > 0 and xmom > xmom[1] and xmom > xmomsig, 3,
              iff (xmom < 0 and xmom > xmom[1] and xmom > xmomsig, -1,
               iff (xmom < 0 and xmom < xmom[1] and xmom > xmomsig, -2,
                 iff (xmom < 0 and xmom > xmom[1] and xmom < xmomsig, -2,
                  iff (xmom < 0 and xmom < xmom[1] and xmom < xmomsig, -3, 0))))))))

TCNum =  iff (xvalue70 > 0 and xvalue70 < xvalue70[1] and xvalue70 < xvalue71, 1,
          iff (xvalue70 > 0 and xvalue70 < xvalue70[1] and xvalue70 > xvalue71, 2,
           iff (xvalue70 > 0 and xvalue70 > xvalue70[1] and xvalue70 < xvalue71, 2,
             iff (xvalue70 > 0 and xvalue70 > xvalue70[1] and xvalue70 > xvalue71, 3,
              iff (xvalue70 < 0 and xvalue70 > xvalue70[1] and xvalue70 > xvalue71, -1,
               iff (xvalue70 < 0 and xvalue70 < xvalue70[1] and xvalue70 > xvalue71, -2,
                 iff (xvalue70 < 0 and xvalue70 > xvalue70[1] and xvalue70 < xvalue71, -2,
                  iff (xvalue70 < 0 and xvalue70 < xvalue70[1] and xvalue70 < xvalue71, -3,0))))))))

value42 = ErrNum + momNum + TCNum
Confluence = iff (value42 > 0 and xvalue70 > 0, value42,
              iff (value42 < 0 and xvalue70 < 0, value42,
               iff ((value42 > 0 and xvalue70 < 0) or (value42 < 0 and xvalue70 > 0), value42 / 10, 0)))
Res1 = iff (Confluence >= 1, Confluence, 0)
Res2 = iff (Confluence <= -1, Confluence, 0)
Res3 = iff (Confluence == 0, 0, iff (Confluence > -1 and Confluence < 1, 10 * Confluence, 0))
pos = iff(Res2 >= SellBand and Res2 != 0, -1,
	     iff(Res1 <= BuyBand and Res1 != 0, 1,
	       iff(Res3 != 0, 0, nz(pos[1], 0))))
possig = iff(reverse and pos == 1, -1,
          iff(reverse and pos == -1, 1, pos))
if (possig == 1)
    strategy.entry("Long", strategy.long)
if (possig == -1)
    strategy.entry("Short", strategy.short)
if (possig == 0)
    strategy.close("Long", when = possig == 0)
    strategy.close("Short", when = possig == 0)
barcolor(possig == -1 ? red: possig == 1 ? green : blue )
plot(Res1, color=green, title="Confluence", linewidth=3, style = histogram)
plot(Res2, color=red, title="Confluence", linewidth=3, style = histogram)
plot(Res3, color=gray, title="Confluence",  linewidth=3, style = histogram)
Detail
https://www.fmz.com/strategy/433002
Last Modified
2023-11-23 14:58:57