
8.8 KiB
Name
动量策略的RSI指标聚合RSI-Momentum-Aggregation-Strategy
Author
ChaoZhang
Strategy Description
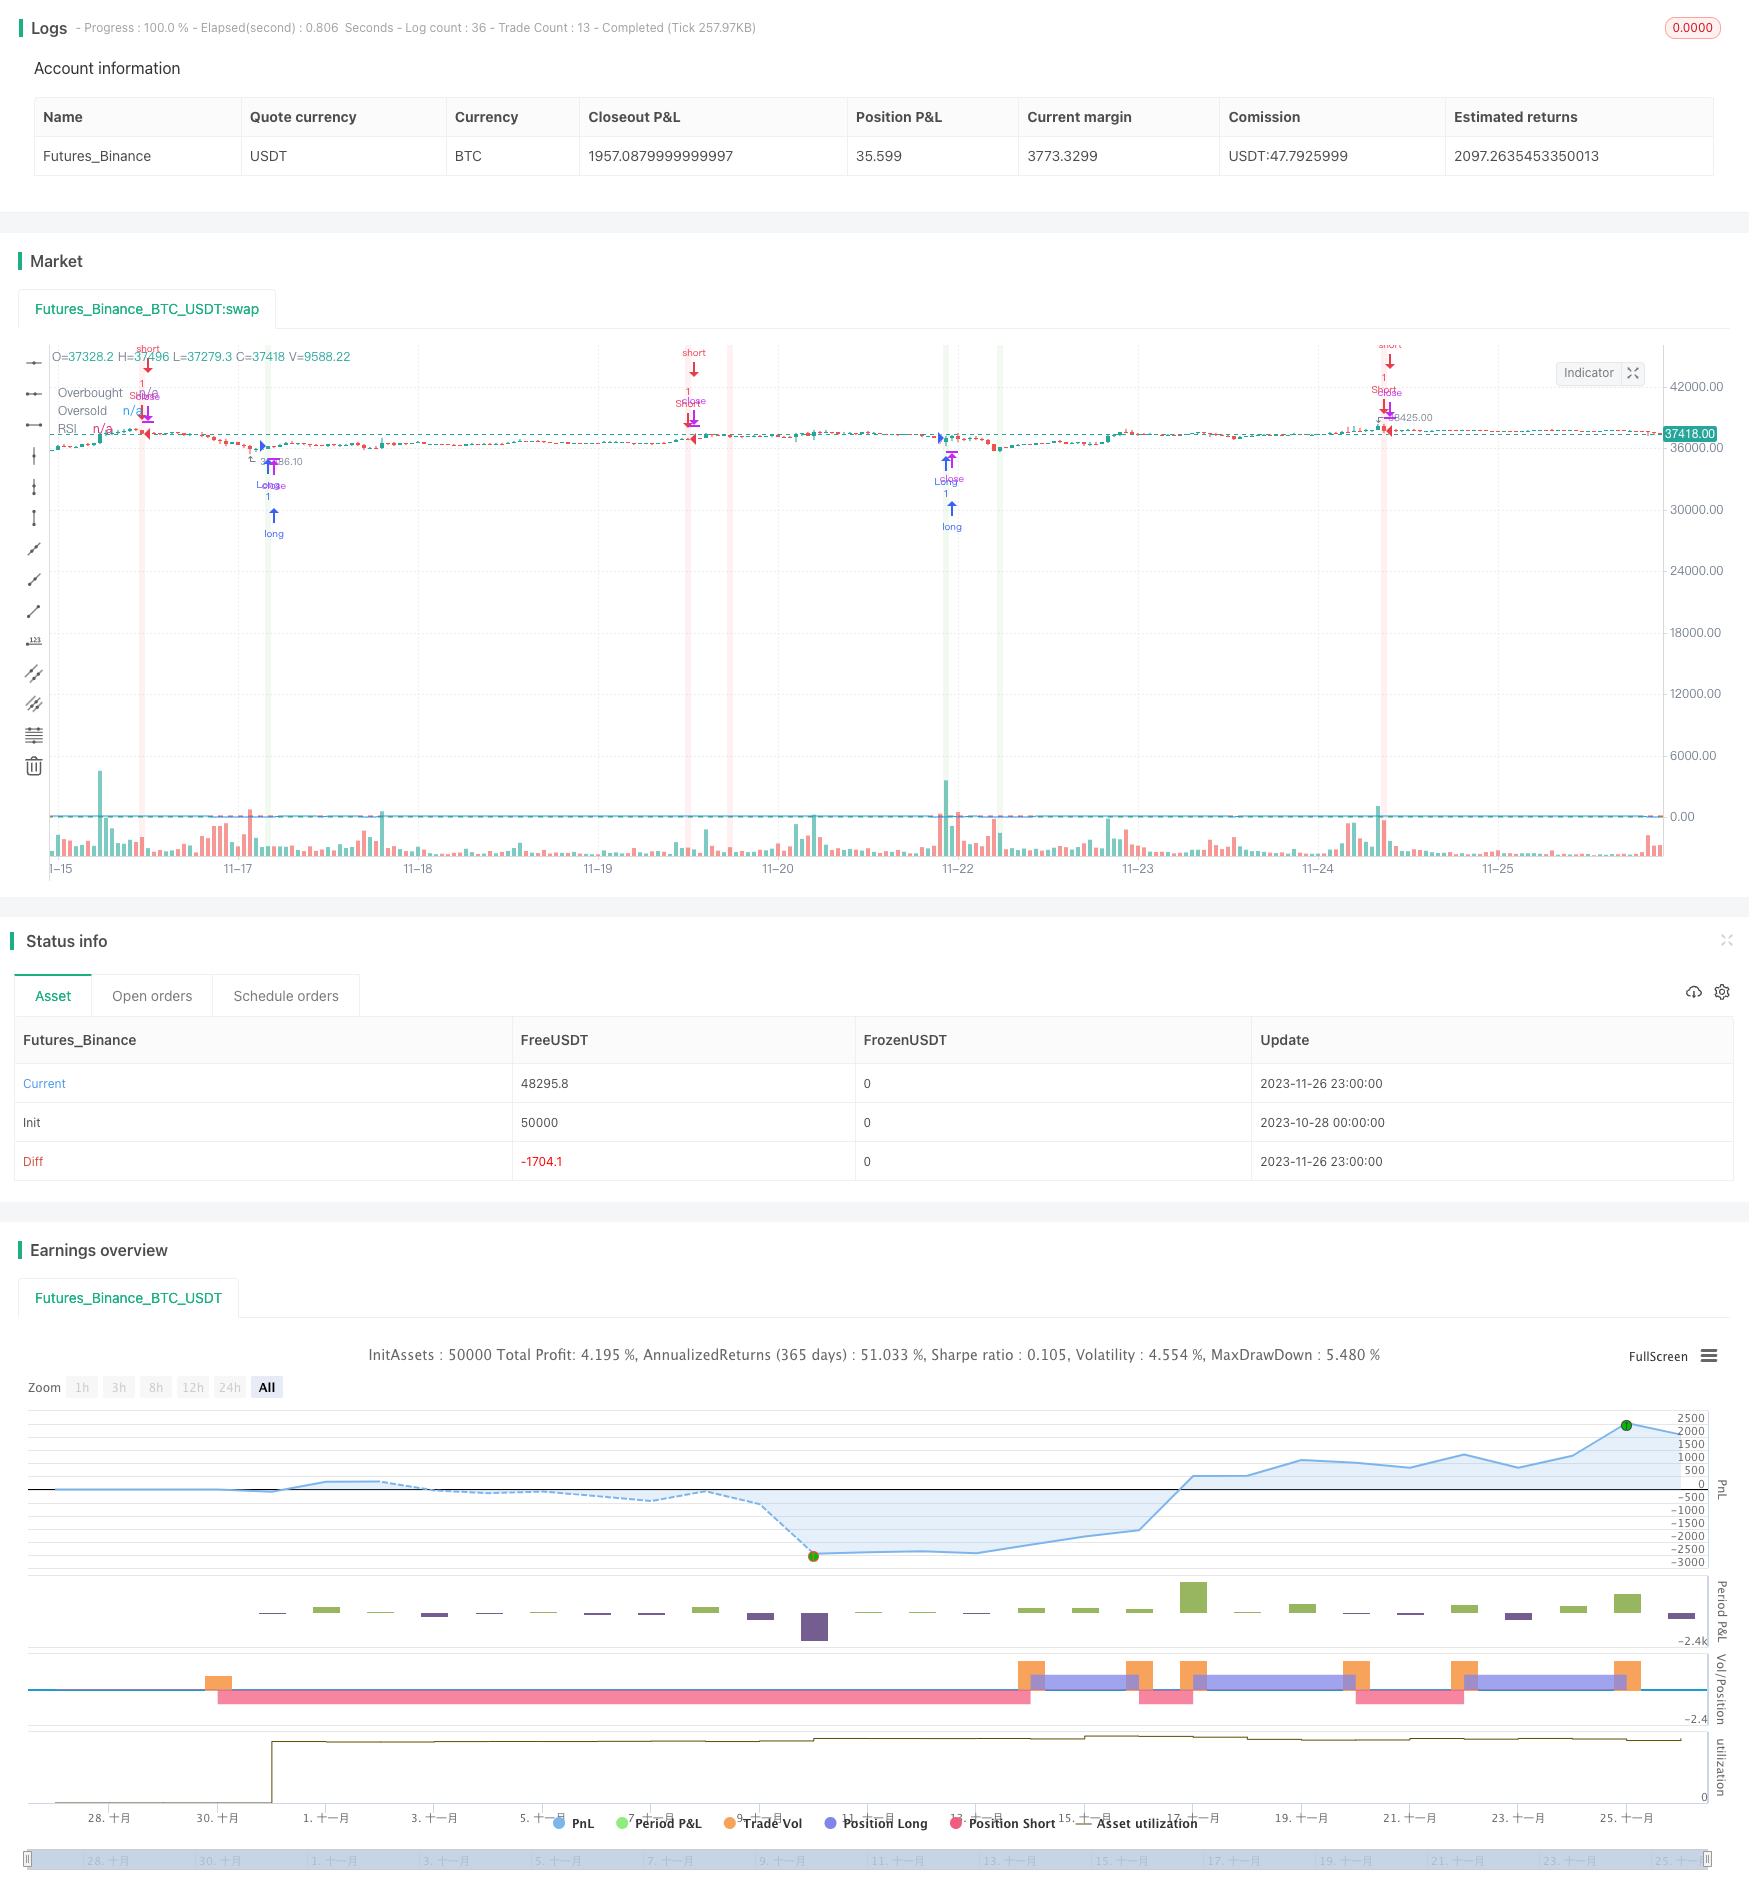
[trans]
概述
本文详细分析了一个基于RSI指标的加密货币交易策略。该策略利用RSI指标判断市场情绪高潮和低潮,实现低买高卖。具体来说,当RSI指标上穿30这个超卖线时,发出买入信号;当RSI指标下穿70这个超买线时,发出卖出信号。
策略原理
该策略的核心指标是RSI,即相对强弱指标。RSI指标基于股票在一定时间内的涨跌幅度,来判断股票是否处于超买或者超卖状态。RSI指标数值范围在0到100之间。当RSI大于70时表示为超买区,小于30时表示为超卖区。
策略的核心逻辑就是当RSI指标从超卖区突破到超卖线30上方时,产生买入信号;当RSI从超买区跌破超买线70下方时,产生卖出信号。这样通过在超买超卖区域反转的时候入场,可以达到低买高卖的目的。
具体在代码中,是通过ta.crossover和ta.crossunder这两个指标函数来判断RSI何时上穿30分界线或者下穿70分界线,从而产生交易信号的。
优势分析
这种基于RSI指标信号的动量策略,主要具有以下优势:
- 操作简单,容易理解和实现
- RSI指标可靠,应用广泛
- 能捕捉市场的情绪转折点,实现低买高卖
- 通过调节RSI参数可以适应不同市场周期
- 可结合其他指标过滤信号,提高系统稳定性
总的来说,这种策略具有操作简单,指标权威,捕捉市场转折,参数可调等多重优势。这使其成为一种值得推荐的基础量化策略。
风险分析
当然,这种策略也存在一些风险需要注意:
- 容易产生多头陷阱和空头陷阱
- 不能有效过滤曲折行情中的假突破
- 容易被高频交易机构套利
- RSI参数设置不当会错过趋势或增加交易频率过高
- 单一指标容易受到market maker的欺骗
针对这些风险,可以通过以下方法加以优化和改进:
- 结合ATR指标过滤止损止盈,控制单笔损失
- 增加MA指标判断趋势方向,避免逆势操作
- 采用时间或TICK突破来过滤假信号
- 适当调整RSI参数或动态优化参数
- 结合多个指标和模型判断,形成指标群
优化方向
这种RSI指标策略还具有很大的优化空间,主要优化思路如下:
- 采用自适应RSI参数,不同市场采用不同参数组合
- 增加移动止损、移动止盈技术,控制单笔亏损和最大回撤
- 结合神经网络模型判断指标信号可靠性,过滤假信号
- 增加模型组合投票机制,提高稳定性
- 采用深度学习特征提取指标信号,实现无参智能策略
- 结合高频特征和文本特征判断市场情绪,优化买卖点
- 采用强化学习方式训练RSI参数和止损止盈幅度
从上面的分析可以看出,这种基于RSI的量化策略还有很大的改进优化空间,未来可望通过机器学习和深度学习技术不断优化,从而产生更好的交易表现和稳定性。
总结
本文详细剖析了一种典型的基于RSI指标的加密货币交易策略。通过对策略优势、风险和优化思路的分析,可以看出这是一种简单实用的策略。该策略可通过参数调节、止损止盈、指标组合等方法进行扩展和优化,未来可利用先进的机器学习和AI技术不断改进。总体而言,这是一种值得推荐的基础量化策略。
||
Overview
This article provides a detailed analysis of a cryptocurrency trading strategy based on the RSI indicator. The strategy uses the RSI indicator to determine market sentiment swings and implements buying low and selling high. Specifically, a buy signal is generated when the RSI indicator crosses above the 30 oversold line, and a sell signal is generated when it crosses below the 70 overbought line.
Strategy Principle
The core indicator of this strategy is RSI, the Relative Strength Index. The RSI indicator is based on the rise and fall of the price of a stock over a period of time to determine if the stock is overbought or oversold. RSI values range from 0 to 100. An RSI reading above 70 is considered overbought while below 30 is oversold.
The core logic of the strategy is to generate a buy signal when the RSI breaks out above 30 from the oversold region and generate a sell signal when the RSI breaks down below 70 from the overbought region. This allows entering the market at reversal points of excessive pessimism and optimism, thus achieving buying low and selling high.
Specifically in the code, the ta.crossover and ta.crossunder indicator functions are used to detect when the RSI crosses over or under the 30/70 boundary lines to trigger trade signals.
Advantage Analysis
This type of momentum strategy based on RSI signals has the following main advantages:
- Simple to understand and implement
- RSI is a reliable and widely used indicator
- Captures turning points in market sentiment for low buy/high sell
- RSI parameters can be tuned for different market cycles
- Can be combined with other filters to improve robustness
In summary, this strategy offers multiple advantages such as simplicity, authoritative indicator, catches market turns, tunable parameters, etc. This makes it a recommended basic quantitative strategy.
Risk Analysis
Of course, there are some risks to be aware of with this strategy:
- Prone to bull and bear traps
- Cannot effectively filter out false breaks in choppy markets
- Vulnerable to arbitrage by high-frequency traders
- Improper RSI parameters may miss trends or over-trade
- Single indicator more susceptible to manipulation
To address these risks, some improvements can be made:
- Add ATR stop loss/take profit to control loss per trade
- Add MA indicator for trend filter to avoid counter-trend trades
- Use time or tick filter for entry and exit
- Fine-tune RSI parameters or dynamic optimization
- Combine multiple indicators for robust signal confirmation
Optimization Directions
There is ample room for optimization with this RSI strategy:
- Employ adaptive RSI parameters for different market conditions
- Incorporate trailing stop loss/profit take techniques
- Use neural networks to judge signal reliability, filtering false signals
- Ensemble model voting for improved stability
- Apply deep learning for feature extraction and model-free strategies
- Incorporate high-frequency data and sentiment analysis to optimize entries
- Utilize reinforcement learning to train RSI parameters and stop loss/take profit
As can be seen from the analysis, there is tremendous potential to enhance this RSI-based strategy leveraging machine learning and deep learning techniques for better performance and stability going forward.
Conclusion
In summary, this article provides an in-depth analysis of a typical RSI indicator-based cryptocurrency trading strategy. From examining the pros, cons and optimization paths, this strategy offers a simple yet practical approach. There is ample room for extensions such as parameter tuning, stop loss/take profit, indicator combos. Going forward, advanced AI techniques can be employed for continual improvements. Overall, this is a recommended foundational quantitative strategy.
[/trans]
Strategy Arguments
| Argument | Default | Description |
|---|---|---|
| v_input_int_1 | 14 | RSI Length |
| v_input_int_2 | 70 | RSI Overbought Threshold |
| v_input_int_3 | 30 | RSI Oversold Threshold |
Source (PineScript)
/*backtest
start: 2023-10-28 00:00:00
end: 2023-11-27 00:00:00
period: 1h
basePeriod: 15m
exchanges: [{"eid":"Futures_Binance","currency":"BTC_USDT"}]
*/

//@version=5
strategy("Crypto Buy & Sell Strategy (Pine Script v5)", overlay=true)

// User-defined input for RSI
rsiLength = input.int(14, title="RSI Length")
rsiOverbought = input.int(70, title="RSI Overbought Threshold")
rsiOversold = input.int(30, title="RSI Oversold Threshold")

// Calculate RSI
rsiValue = ta.rsi(close, rsiLength)

// Define entry and exit conditions
longCondition = ta.crossover(rsiValue, rsiOversold)
shortCondition = ta.crossunder(rsiValue, rsiOverbought)

// Plot RSI and Overbought/Oversold thresholds
plot(rsiValue, title="RSI", color=color.blue)
hline(rsiOverbought, title="Overbought", color=color.red)
hline(rsiOversold, title="Oversold", color=color.green)

// Execute the strategy using conditional blocks
if longCondition
    strategy.entry("Long", strategy.long, comment="Buy")

if shortCondition
    strategy.entry("Short", strategy.short, comment="Sell")

// Highlight buying and selling on the chart
bgcolor(longCondition ? color.new(color.green, 90) : na, title="Buy Background")
bgcolor(shortCondition ? color.new(color.red, 90) : na, title="Sell Background")
Detail
https://www.fmz.com/strategy/433544
Last Modified
2023-12-01 15:01:58