
9.6 KiB
Name
动量突破TTM策略Momentum-Breakthrough-TTM-Strategy
Author
ChaoZhang
Strategy Description
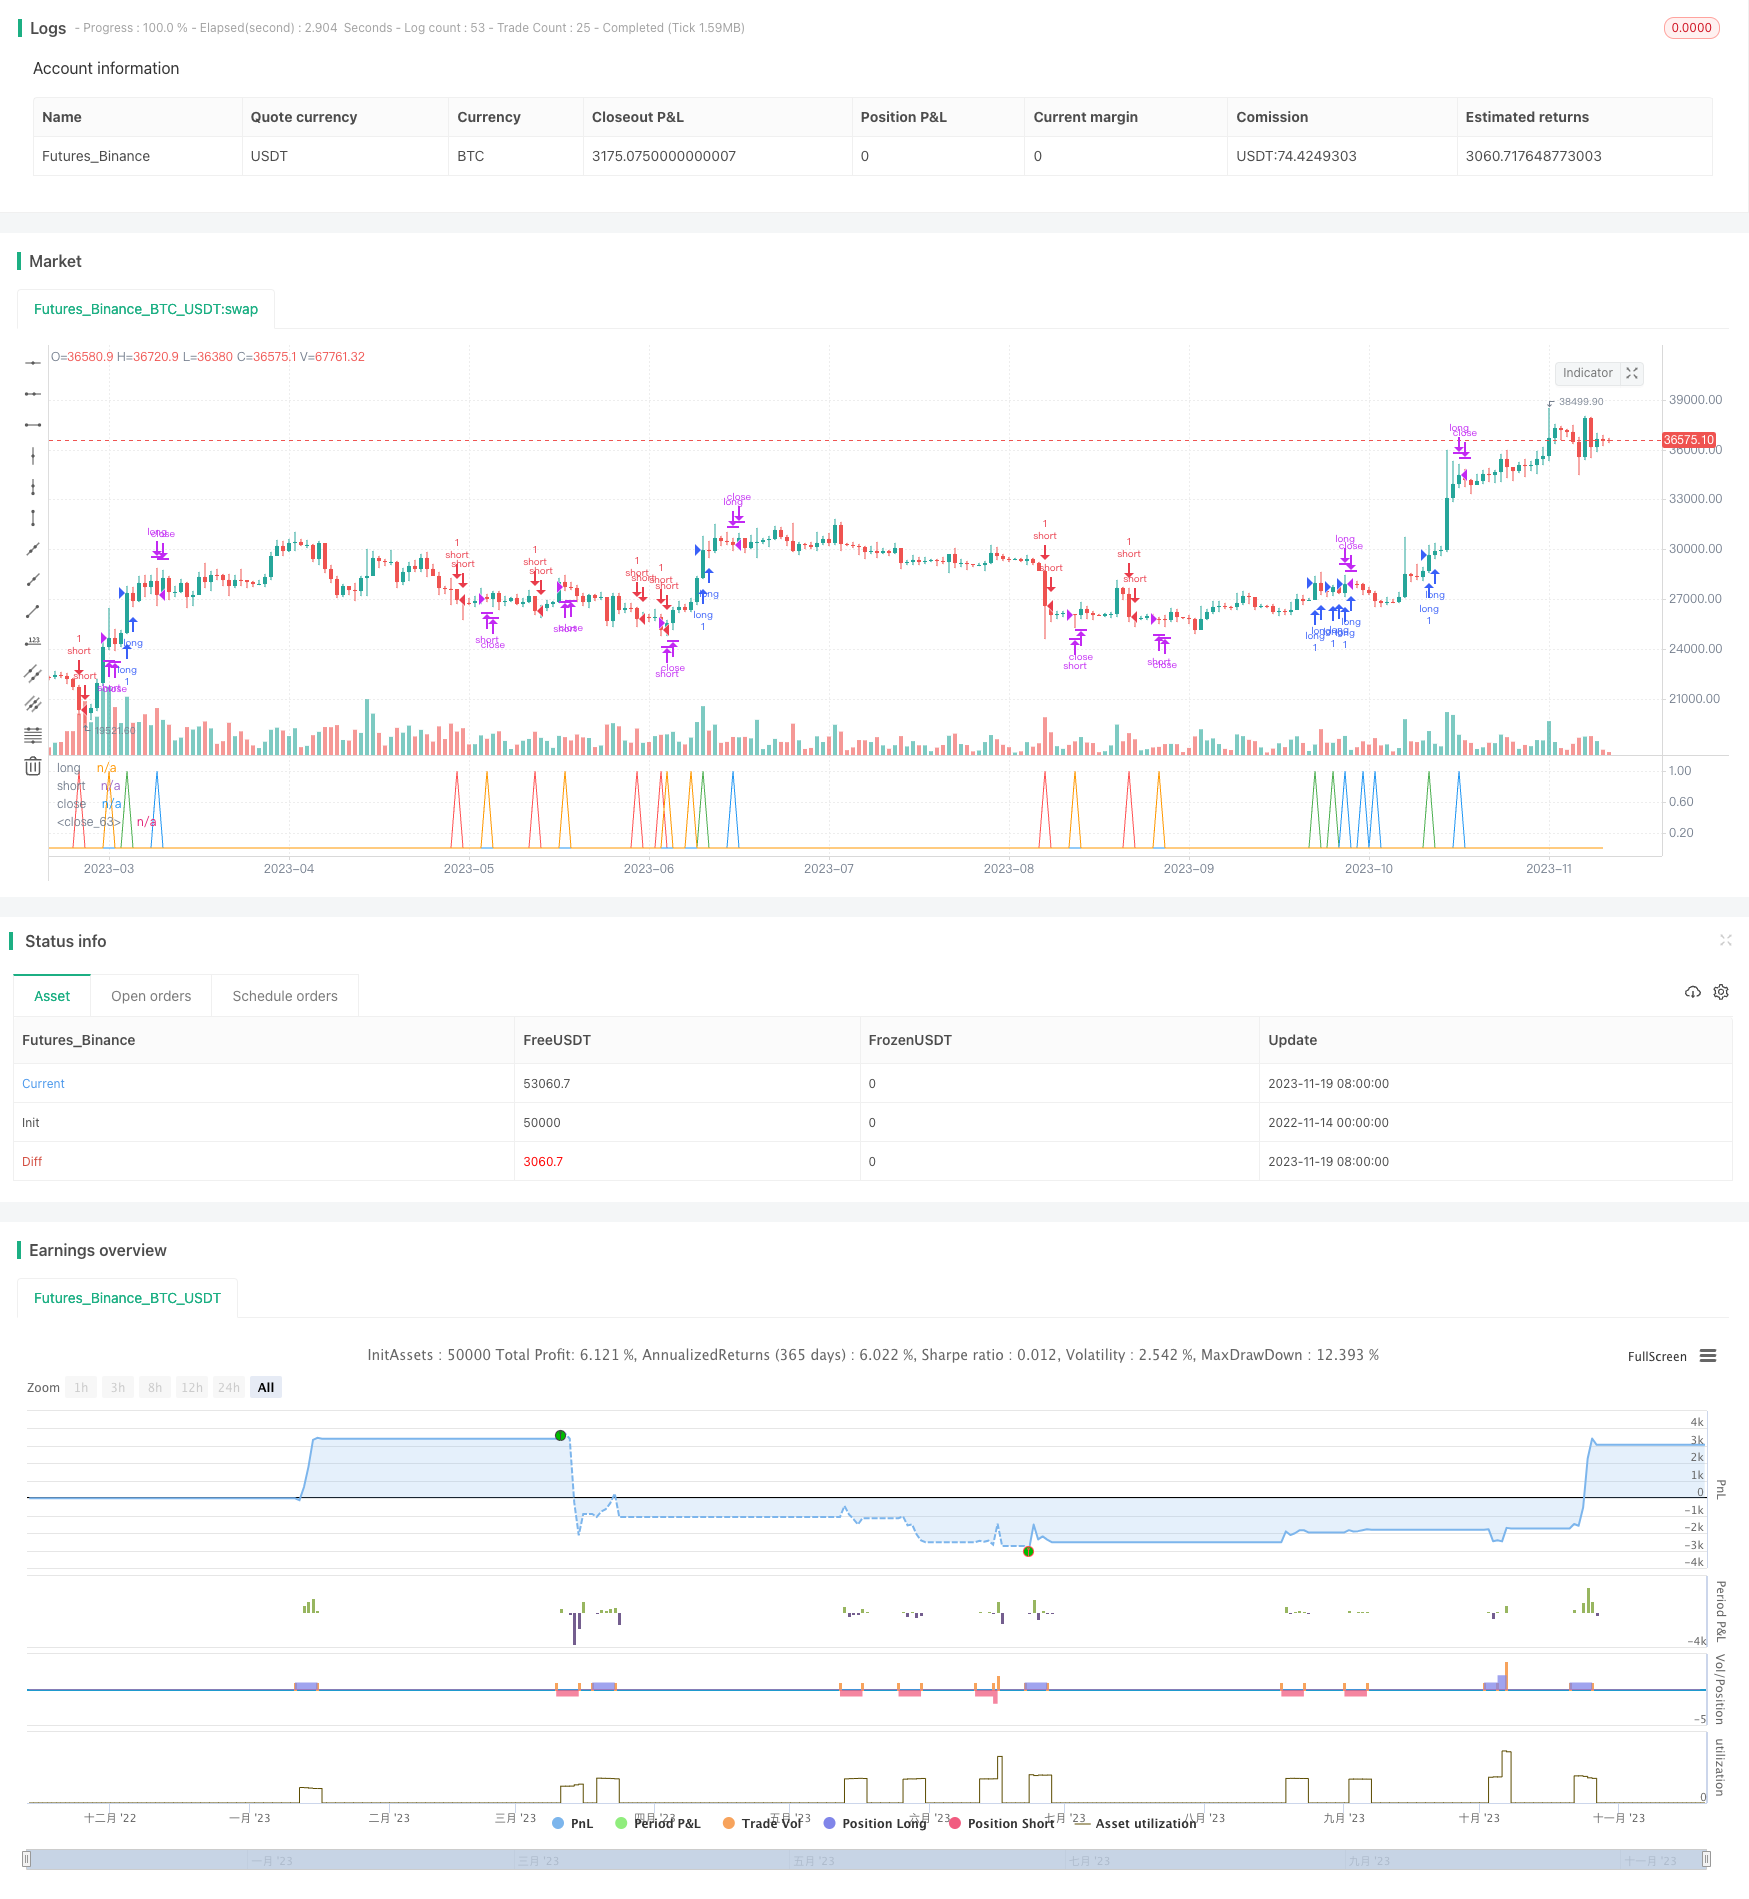
[trans]
概述
该策略是一个利用动量指标RSI结合布林带指标BB的二进制期权突破交易策略。在时间上,利用TTM指标判断市场是否处于盘整状态,从而提高入场的可靠性。
策略原理
策略的基本逻辑是在TTM指标集合形成突破的基础上,结合布林带和RSI指标判定价格的突破方向。具体来说,策略使用20周期的BB和30周期的RSI。当市场突破缩量后,在RSI处于一定波动区间(30-70)且BB有较大突破(0.15倍波动范围)的情况下确定开仓方向。此外,策略还检查开仓前一根K线的开仓方向,以避免不必要的反复开仓。
优势分析
该策略主要有以下几点优势:
-
利用TTM指标判断市场的交易状态,避免在盘整市场无意义的交易。 TTMS指标的集合压缩、膨胀能更好的判断主要趋势方向,为开仓提供参考。
-
RSI与BB的结合使用,可以使得开仓更加可靠。RSI指标判断价格有无超买超卖现象;而BB指标判断价格是否已经发生较大突破。两者结合使用,使得策略可以在较强势的方向性行情中获利。
-
策略逻辑考虑了一定的优化,例如避免反复开仓等。这可以一定程度上减少不必要的盈亏来回切换。
风险分析
该策略主要存在以下风险:
-
突破失败风险。当TTM指标判断趋势准确性不高时,RSI和BB依然可能发生错误突破。此时策略根据指标清单开仓,最终可能被套。为控制该风险,可以考虑降低仓位规模。
-
市场震荡时,容易形成亏损。当市场处于震荡状态,TTM指标的表现并不理想。RSI和BB指标也可能出现多次错误信号。这时就很容极易形成损失。为控制该风险,应避免在明显震荡市场使用该策略。
优化方向
该策略可以从以下几个方面进行优化:
-
优化TTM指标参数,调整指标的长度和因子。这可以提高TTM指标对盘整和突破的判断。
-
优化RSI和BB的参数。适当缩短周期数,可能获取更及时更精确的突破信号。同时BB的通道带宽度也可以测试不同的取值。
-
增加止损逻辑。该策略没有设置止损位,为防止单笔亏损过大,可以考虑加上移动止损或期望止损。
-
可以测试不同的品种参数。当前策略是在1分钟线上运行,对于其他品种参数(如5分钟),指标参数可以重新测试优化,获取更好的参数组合。
总结
该策略是一个利用TTM判断趋势准确性,结合RSI和BB判定突破方向的二进制期权策略。相比简单的突破策略,其入场时机和指标参数优化都更有优势,可以提高盈利概率。但该策略也存在一定的失败风险和震荡市的适应性问题。这需要我们在使用中,调整仓位规模并避免在震荡市使用。通过进一步的参数和止损优化,该策略可以成为一个可靠的期权交易策略。
||
Overview
This is a binary option breakthrough trading strategy that utilizes the momentum indicator RSI combined with the Bollinger Bands indicator BB. In terms of timeliness, the TTM indicator is used to determine whether the market is in a consolidation state, thereby improving the reliability of entry.
Principle
The basic logic of the strategy is to determine the breakthrough direction based on Bollinger Bands and the RSI indicator under the condition that the TTM indicator set forms a breakthrough. Specifically, the strategy uses 20 periods of BB and 30 periods of RSI. When the market breaks through the squeeze, it determines the opening direction when the RSI is within a certain fluctuation range (30-70) and the BB has a large breakthrough (0.15 times the fluctuation range). In addition, the strategy also checks the opening direction of the previous K-line before opening a position to avoid unnecessary repeated opening.
Advantages
The main advantages of this strategy are:
-
Using the TTM indicator to judge the trading state of the market and avoid meaningless trading in the consolidating market. The compression and expansion of the TTMS indicator can better determine the main trend direction and provide a reference for opening positions.
-
The combination of RSI and BB can make opening positions more reliable. The RSI indicator judges whether prices are overbought or oversold; while the BB indicator judges whether prices have occurred a major breakthrough. The combination of the two makes the strategy profit from strong directional trends.
-
The strategy logic considers certain optimizations such as avoiding repeated opening. This can reduce unnecessary profit and loss switching to some extent.
Risk Analysis
The main risks of this strategy are:
-
Breakdown failure risk. When the TTM indicator does not accurately judge the trend, RSI and BB may still have false breakouts. At this time, the strategy opens positions based on the indicators, and may eventually be trapped. To control this risk, consider reducing the size of the position.
-
It is easy to lose when the market oscillates. When the market is in an oscillating state, the performance of the TTM indicator is not ideal. RSI and BB indicators may also give multiple false signals. At this time it is very easy to form losses. To control this risk, avoid using this strategy in obvious oscillating markets.
Optimization
The strategy can be optimized in the following aspects:
-
Optimize the parameters of the TTM indicator to adjust the length and factors of the indicator. This can improve TTM's judgment on consolidation and breakthrough.
-
Optimize RSI and BB parameters. Appropriately shortening cycle numbers may obtain more timely and precise breakthrough signals. At the same time, the bandwidth of the BB channel can also test different values.
-
Increase stop loss logic. Since the strategy does not set a stop loss, to prevent a single loss from being too large, consider adding a moving stop loss or expected stop loss.
-
Different varieties of parameters can be tested. The current strategy runs on 1 minute charts. For other varieties of parameters (such as 5 minutes), indicator parameters can be retested and optimized to obtain better parameter combinations.
Conclusion
This strategy utilizes TTM to determine trend accuracy and uses RSI and BB to determine breakthrough directions. Compared with simple breakthrough strategies, its entry timing and indicator parameter optimization are more advantageous, which can increase profitability. But this strategy also poses certain risks of failure and adaptability issues in oscillating markets. This requires us to adjust position sizing during use and avoid using it in oscillating markets. With further parameter and stop loss optimization, this strategy can become a reliable option trading strategy.
[/trans]
Strategy Arguments
| Argument | Default | Description |
|---|---|---|
| v_input_1 | 20 | Length |
| v_input_2 | 50 | length |
| v_input_3 | 0.2 | Mult Factor |
| v_input_4 | 0.1 | alertLevel |
| v_input_5 | 0.75 | impulseLevel |
| v_input_6 | false | showRange |
Source (PineScript)
/*backtest
start: 2022-11-14 00:00:00
end: 2023-11-20 00:00:00
period: 1d
basePeriod: 1h
exchanges: [{"eid":"Futures_Binance","currency":"BTC_USDT"}]
*/

//@version=4
strategy (title="EA_Binary Option Spfrat Strategy", shorttitle="Spyfrate_Binary Option 5min", overlay=false, pyramiding=1999, initial_capital=60000, currency=currency.USD)

// TTM Squeeze code
lengthttm = input(title="Length",  defval=20, minval=0)
bband(lengthttm, mult) =>
	sma(close, lengthttm) + mult * stdev(close, lengthttm)
keltner(length, mult) =>
	ema(close, lengthttm) + mult * ema(tr, lengthttm)

e1 = (highest(high, lengthttm) + lowest(low, lengthttm)) / 2 + sma(close, lengthttm)
osc = linreg(close - e1 / 2, lengthttm, 0)
diff = bband(lengthttm, 2) - keltner(lengthttm, 1)
osc_color = osc[1] < osc[0] ? osc[0] >= 0 ? #00ffff : #cc00cc : osc[0] >= 0 ? #009b9b : #ff9bff
mid_color = diff >= 0 ? green : red
conso = diff >= 0?1:0

//plot(osc, color=osc_color, style=histogram, linewidth=2)
//plot(0, color=mid_color, style=circles, linewidth=3)

// BB Init
source = close
length = input(50, minval=1)
mult = input(0.2, title="Mult Factor", minval=0.001, maxval=50)
alertLevel=input(0.1)
impulseLevel=input(0.75)
showRange = input(false, type=bool)

//RSI CODE
src = close,
up = rma(max(change(src), 0), 30)
down = rma(-min(change(src), 0), 30)
rsi = down == 0 ? 100 : up == 0 ? 0 : 100 - (100 / (1 + up / down))

//BB CODE
basis = sma(source, length)
dev = mult * stdev(source, length)
upper = basis + dev
lower = basis - dev
bbr = source>upper?(((source-upper)/(upper-lower))/10): source<lower?(((source-lower)/(upper-lower))/10) : 0.05
bbi = bbr - nz(bbr[1])
//Rule
long1 = rsi>50.5 and rsi<70 and  bbi>0.15  and osc>0.00100 and conso>0
short1 = rsi<49.5 and rsi>30 and  bbi<-0.15 and osc<-0.00100 and conso>0
//
long = long1[1] == 0 and long1 == 1
short = short1[1] == 0 and short1 == 1
longclose = long[5] == 1
shortclose = short[5] == 1

//Alert

strategy.entry("short", strategy.short, when=short)
strategy.entry("long", strategy.long, when=long)
plot(long,"long",color=green,linewidth=1)
plot(short,"short",color=red,linewidth=1)
strategy.close("long",when=longclose)
strategy.close("short",when=shortclose)

//strategy.exit(id="long",qty = 100000,when=longclose)
//strategy.exit(id="short",qty = 100000,when=shortclose)
plot(longclose,"close",color=blue,linewidth=1)
plot(shortclose,"close",color=orange,linewidth=1)
//strategy.exit(id="Stop", profit = 20, loss = 100)
Detail
https://www.fmz.com/strategy/432788
Last Modified
2023-11-21 15:07:38