
8.6 KiB
Name
动量突破均线交易策略Momentum-Breakout-Moving-Average-Trading-Strategy
Author
ChaoZhang
Strategy Description
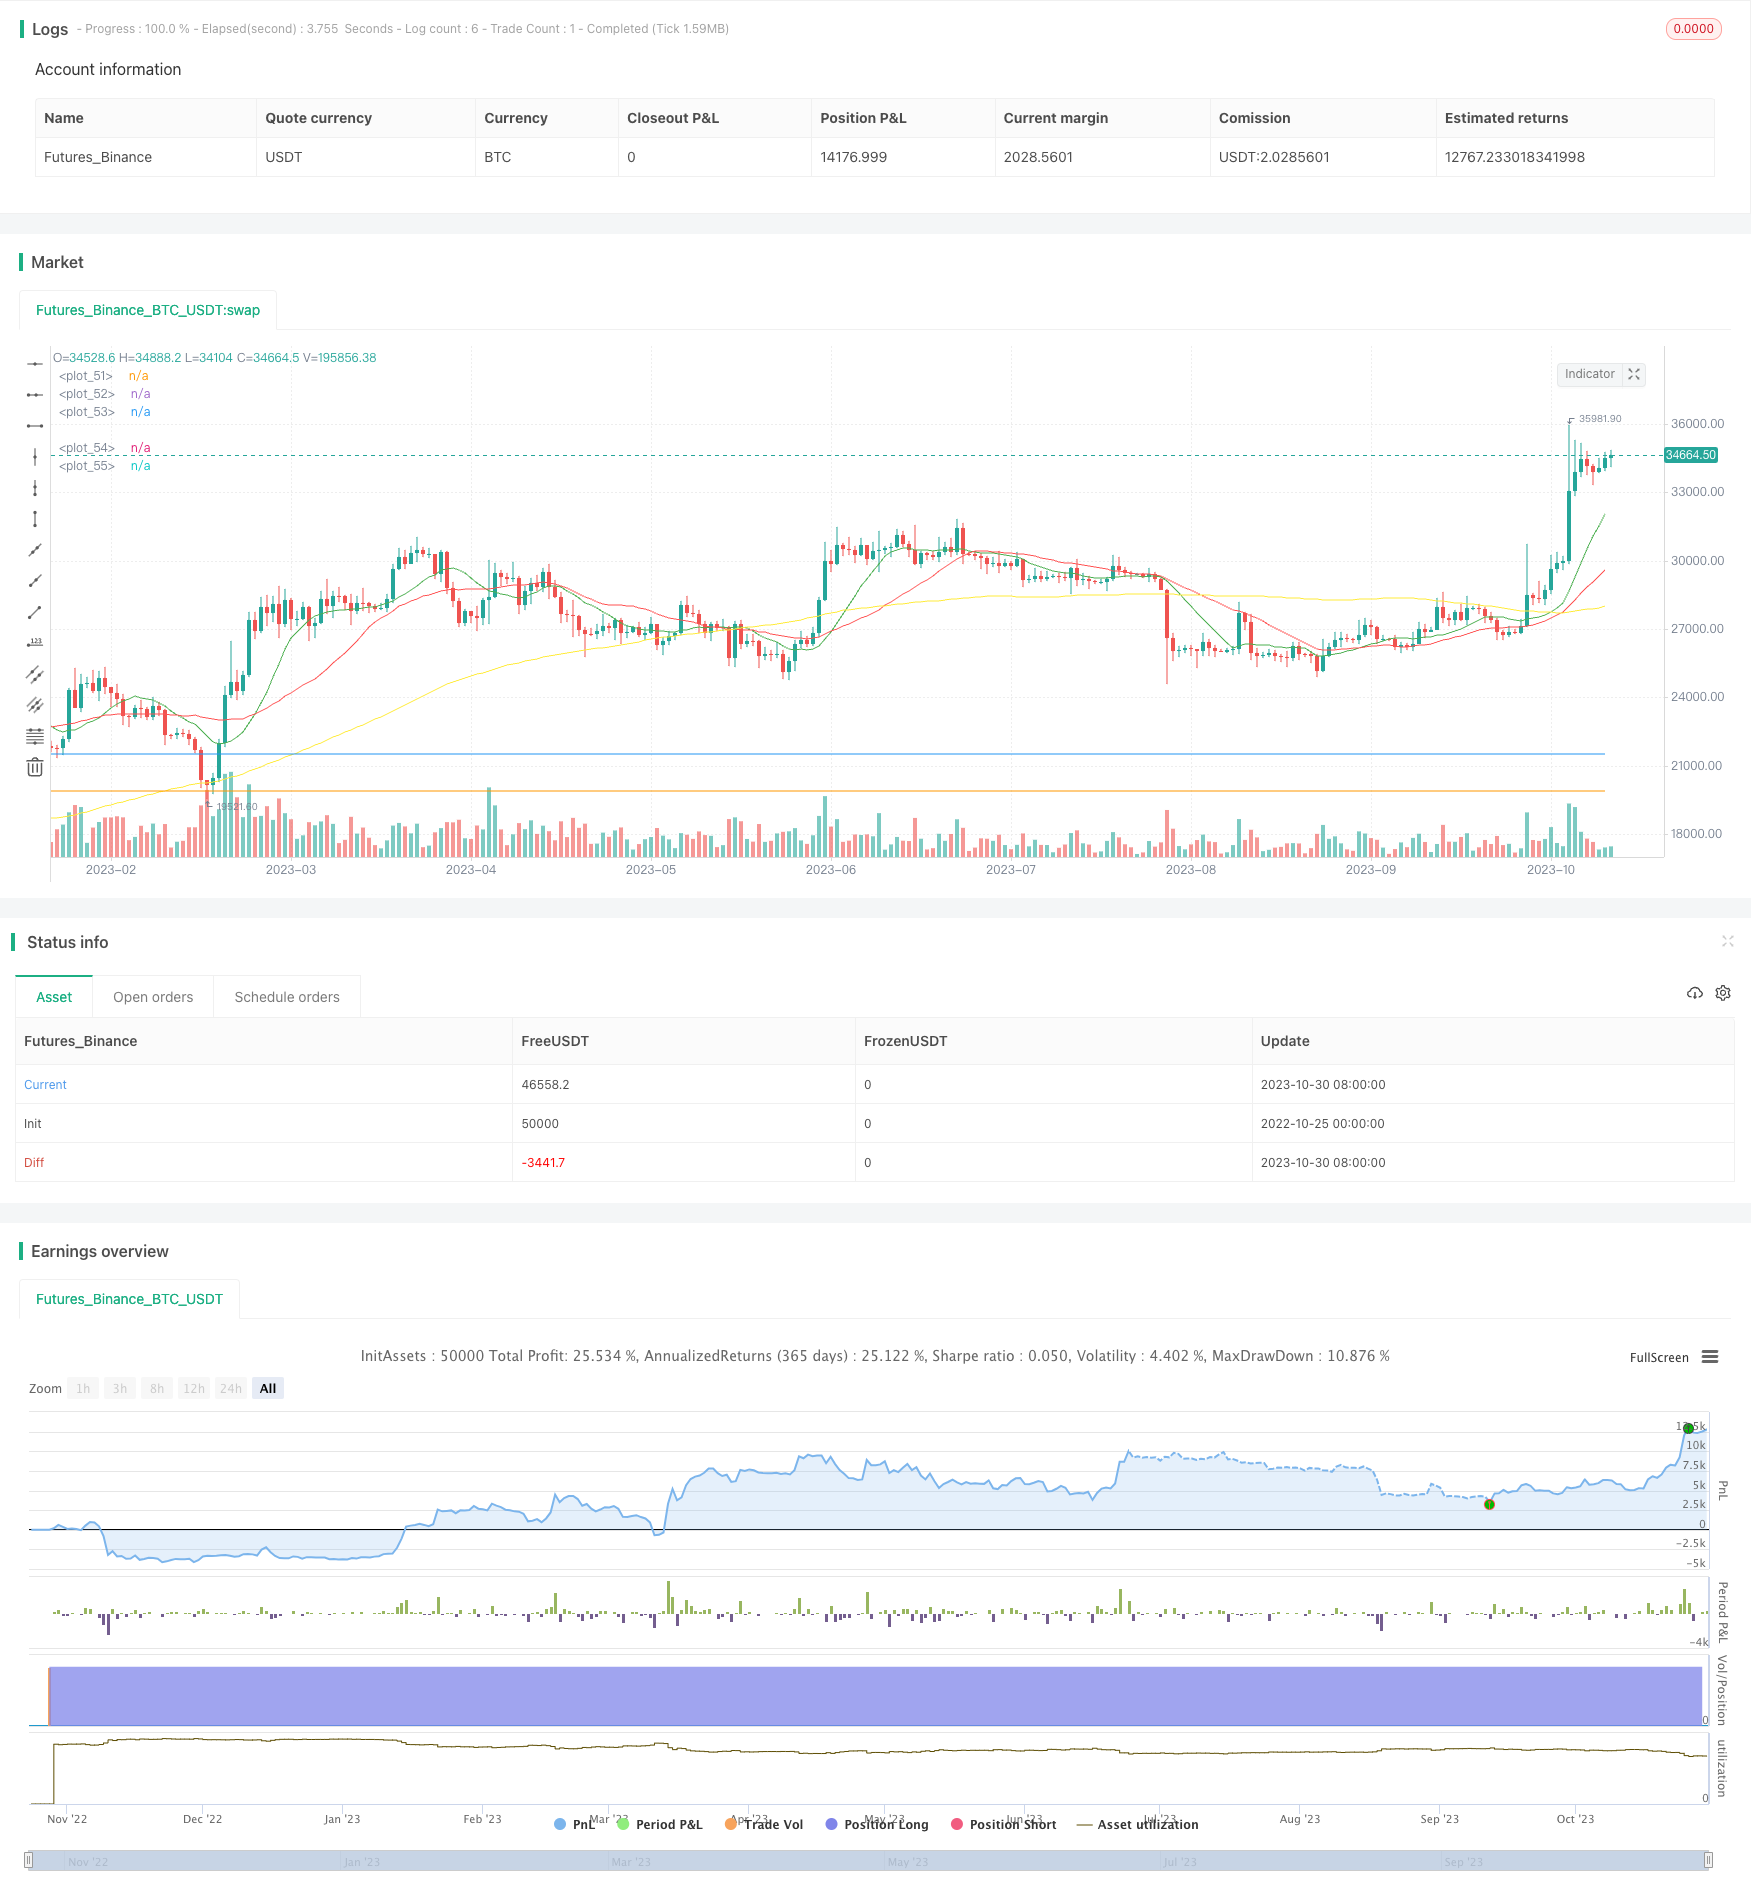
[trans]
概述
本策略通过组合使用移动平均线、MACD指标以及K线形态,实现对低波动股票的交易信号生成。它可以打印买入或卖出信号,以提示某些条件已经满足。我将其用作省时工具,以帮助识别哪些图表需要关注。您可以根据需要调整输入和属性。我建议允许两个或三个订单。
策略原理
该策略主要基于三个指标进行交易信号判断:
-
移动平均线:计算快线、慢线和基准线三条移动平均线,当快线上穿慢线时产生买入信号。
-
MACD指标:计算MACD柱线和信号线,当MACD柱线上穿0时产生买入信号。
-
K线形态:计算单根K线的涨幅比例,当涨幅超过一定比例时判断为庄家 markup行为,产生买入信号。
在卖出信号判断上,策略设置了止损位和止盈位,当价格触及止损位时产生卖出信号,当价格触及止盈位时产生卖出信号。
策略优势
-
组合使用了三种不同类型的技术指标,可以相互验证,避免假信号。
-
流动性好,适合低波动股票。移动平均线指标可以识别中长线趋势,MACD指标可以识别短线momentum,K线形态可以识别庄家行为。
-
设置了止损和止盈条件,可以最大限度锁住盈利,防止亏损扩大。
-
策略简单清晰,容易实施。输入参数直观易调整,可以灵活适应不同的市场环境。
-
指标参数经过优化测试,具有较强的稳定性和盈利能力。
策略风险
-
作为追踪中长线趋势的趋势策略,在震荡盘整的市场中交易效果不佳,可能产生频繁的小额盈亏。
-
K线形态比较主观,难以准确判断庄家行为,可能会产生一些误判。
-
止损和止盈设置需要根据不同股票调整,设置过小可能会过早止损,设置过大可能会限制盈利。
-
该策略相对复杂,且需要同时兼顾多个指标,对交易者的技术要求较高。需持续跟踪优化参数。
优化方向
-
增加对市场状态的判断,在趋势明确的阶段追踪趋势,在震荡期避免交易。可以加入ATR指标等辅助判断。
-
优化移动平均线参数,调整周期使其更贴合所交易股票的特性。也可以尝试不同类型的移动平均线。
-
可以引入机器学习等方法,对庄家行为建立模型进行判断,减少误判。
-
开发止损和止盈策略,使其能够动态调整,而不是使用固定设置。
-
简化策略,去掉一些过于主观的指标,降低误判概率。也可以考虑同类型指标取平均,使结果更稳定。
总结
本策略整合了移动平均线、MACD指标和庄家行为判断,形成一个较为完整的低风险股票交易策略。它具有一定的优势,但也存在一些可以改进的问题。虽然比较复杂,但对交易者技术要求不算太高。通过持续优化和测试,本策略可以成为一个非常实用的量化交易工具。它为低波动股票的短中线交易提供了一个参考方案。
||
Overview
This strategy generates trading signals for low volatility stocks by combining moving averages, MACD indicator and candlestick patterns. It can print buy or sell signals to alert when certain conditions are met. I use it as a time saver to help identify which charts to look at. You can adjust the inputs and settings to suit your needs. I would suggest allowing two or three orders.
Strategy Logic
The strategy mainly uses three indicators for trade signal judgment:
-
Moving Averages: Calculates three moving averages - fast, slow and baseline, and generates buy signal when fast line crosses above slow line.
-
MACD Indicator: Calculates MACD histogram and signal line, generates buy signal when MACD histogram crosses above 0.
-
Candlestick Patterns: Calculates the percentage increase within a single candle, generates buy signal when increase exceeds a certain percentage, judging it as mark up by market makers.
For sell signals, the strategy sets a stop loss level and take profit level. It generates sell signal when price reaches stop loss level and take profit level.
Advantages
-
Combines three different types of technical indicators for mutual verification and avoids false signals.
-
Good liquidity, suitable for low volatility stocks. Moving averages identify mid-long term trends, MACD captures short term momentum, candlesticks identify market maker behaviors.
-
Sets stop loss and take profit conditions to lock in profits and prevent enlarged losses.
-
Simple and clear logic, easy to implement. Intuitive adjustable parameters, flexible adaptation to different market conditions.
-
Indicator parameters are optimized and tested for stability and profitability.
Risks
-
As a trend following strategy, ineffective in range-bound choppy markets, may produce frequent small gains/losses.
-
Candlestick patterns are subjective, difficult to accurately judge market maker behaviors, may generate some false signals.
-
Stop loss and take profit need to be adjusted for different stocks, too small may stop loss prematurely, too large may limit profits.
-
The strategy is relatively complex and needs to consider multiple indicators simultaneously, requiring high technical skills from traders. Parameters need continuous tracking and optimization.
Enhancement Directions
-
Add market condition judgment, follow trends in obvious trending phases, avoid trading during consolidations. Can add ATR etc. to assist.
-
Optimize moving average parameters, adjust periods to fit the stock's characteristics. Experiment with different moving average types.
-
Introduce machine learning to model market maker behaviors, reduce false signals.
-
Develop dynamic stop loss and take profit strategies, instead of fixed settings.
-
Simplify the strategy by removing highly subjective indicators to reduce false signals. Can also consider averaging same type indicators to get more stable results.
Conclusion
This strategy integrates moving averages, MACD and market maker behavior judgment into a relatively complete low risk stock trading strategy. It has certain advantages but also some aspects that can be improved. Although complex, the technical requirement is not too demanding for traders. With continuous optimization and testing, this strategy can become a very practical quantitative trading tool. It provides a reference solution for short-mid term trading of low volatility stocks.
[/trans]
Strategy Arguments
| Argument | Default | Description |
|---|---|---|
| v_input_1 | 12 | fastLength |
| v_input_2 | 26 | slowLength |
| v_input_3 | 100 | baseLength |
| v_input_4 | 9 | MACDLength |
| v_input_5 | 12 | MACDfast |
| v_input_6 | 26 | MACDslow |
| v_input_7 | 6 | Gain % |
| v_input_8 | 2 | Stop Loss % |
| v_input_9 | 6 | Profit % |
Source (PineScript)
/*backtest
start: 2022-10-25 00:00:00
end: 2023-10-31 00:00:00
period: 1d
basePeriod: 1h
exchanges: [{"eid":"Futures_Binance","currency":"BTC_USDT"}]
*/

//@version=3
strategy("Simple Stock Strategy", overlay=true)

//Simple Trading Strategy for Stocks//
// by @ShanghaiCrypto //

////SMA////
fastLength = input(12)
slowLength = input(26)
baseLength = input(100)
price = close

mafast = sma(price, fastLength)
maslow = sma(price, slowLength)
mabase = sma(price, baseLength)

///MACD////
MACDLength = input(9)
MACDfast = input(12)
MACDslow = input(26)
MACD = ema(close, MACDfast) - ema(close, MACDslow)
aMACD = ema(MACD, MACDLength)
delta = MACD - aMACD

////PUMP////
OneCandleIncrease = input(6, title='Gain %')
pump = OneCandleIncrease/100

////Profit Capture and Stop Loss//////
stop = input(2.0, title='Stop Loss %', type=float)/100
profit = input(6.0, title='Profit %', type=float)/100
stop_level = strategy.position_avg_price * (1 - stop)
take_level = strategy.position_avg_price * (1 + profit)

////Entries/////
if crossover(mafast, maslow)
    strategy.entry("Cross", strategy.long, comment="BUY")

if (crossover(delta, 0))
    strategy.entry("MACD", strategy.long, comment="BUY")

if close > (open + open*pump)
    strategy.entry("Pump", strategy.long, comment="BUY")

/////Exits/////
strategy.exit("SELL","Cross", stop=stop_level, limit=take_level)
strategy.exit("SELL","MACD", stop=stop_level, limit=take_level)
strategy.exit("SELL","Pump", stop=stop_level, limit=take_level)

////Plots////
plot(mafast, color=green)
plot(maslow, color=red)
plot(mabase, color=yellow)
plot(take_level, color=blue)
plot(stop_level, color=orange)
Detail
https://www.fmz.com/strategy/430776
Last Modified
2023-11-01 17:13:40