
11 KiB
Name
动量指标移动平均线交叉趋势跟踪策略Momentum-Moving-Average-Crossover-Trend-Following-Strategy
Author
ChaoZhang
Strategy Description
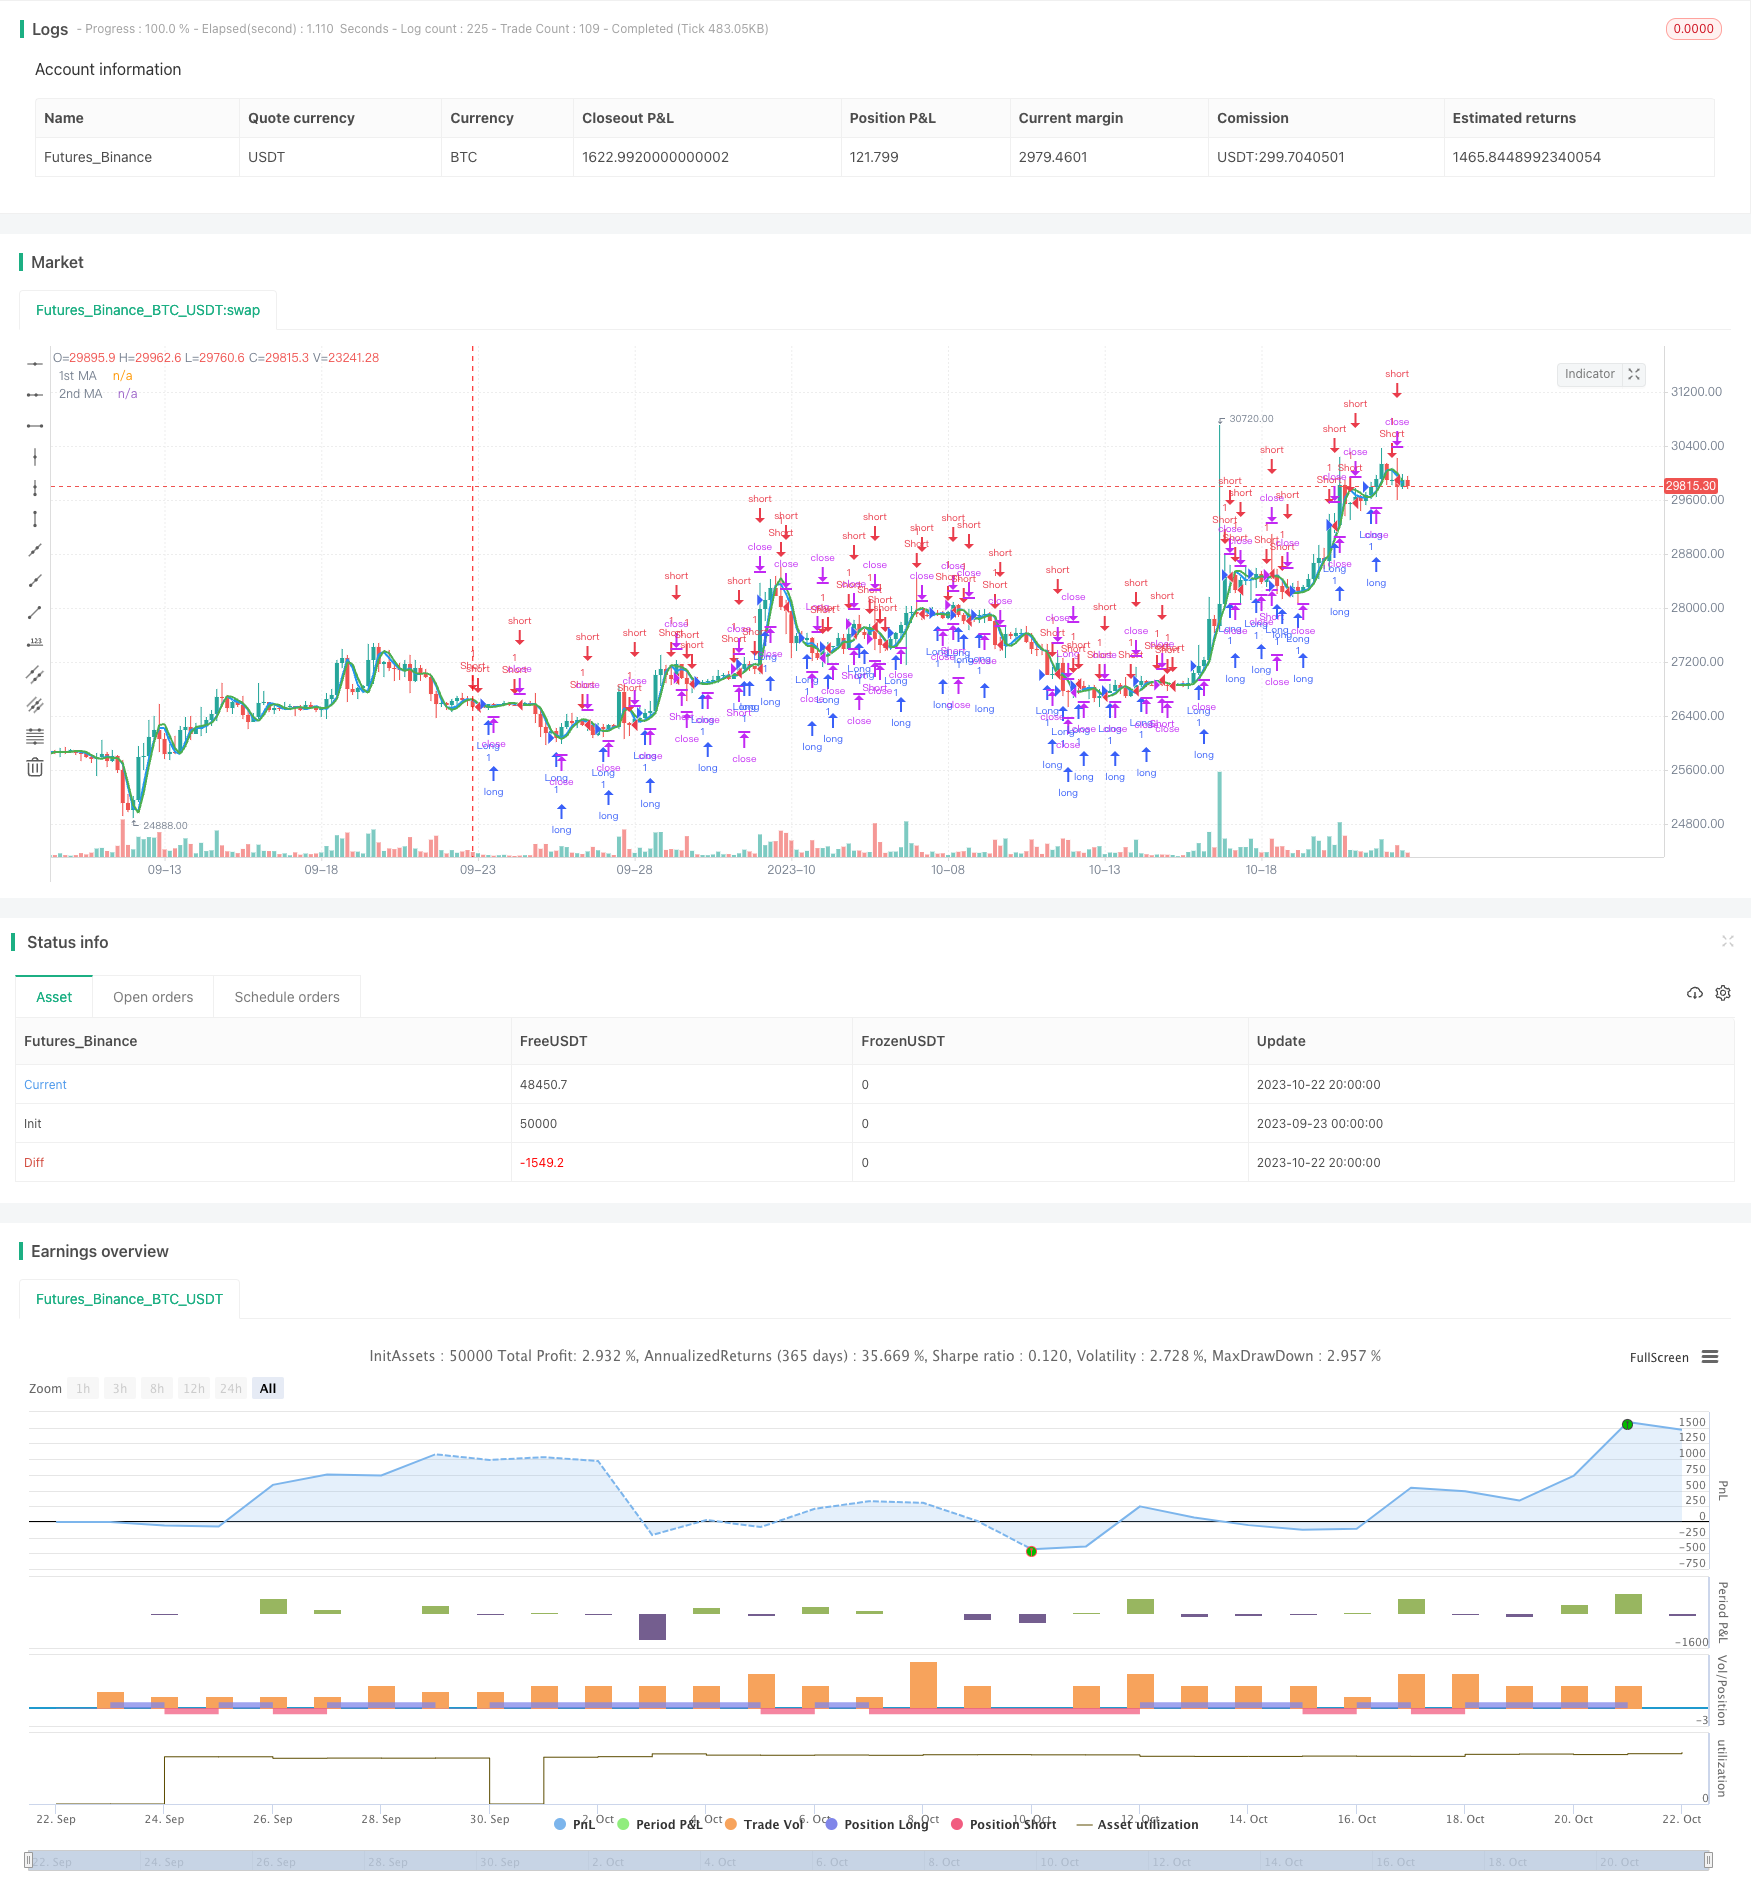
[trans]
概述
该策略融合了移动平均线交叉和动量指标,实现了对趋势的有效跟踪与及时反转。策略首先使用快速移动平均线和慢速移动平均线形成金叉做多和死叉做空信号。然后结合一定参数的动量指标,在金叉做多时,如果快速移动平均线上的动量指标再次上扬,则视为趋势继续,保持做多;当动量指标下降时,则视为趋势反转,平仓。在死叉做空时,也采用相同的原理跟踪趋势反转。同时,策略还引入ADX指标,用于过滤非趋势状态下的错误信号。
策略原理
该策略的核心逻辑基于移动平均线交叉形成的趋势信号,以及动量指标判定趋势反转。关键部分的代码逻辑如下:
-
计算快速移动平均线price1和慢速移动平均线price2。其中price1为5周期HMA,price2为7周期HMA。
-
当price1上穿price2时生成做多信号,当price1下穿price2时生成做空信号。这是基于移动平均线的常规用法。
-
在做多信号触发后,如果快速移动平均线price1的动量指标roc1再次上扬,则视为趋势继续,保持做多状态。
-
当动量指标roc1下降时,则认为趋势反转,执行平仓。做空信号的处理逻辑相同。
-
引入ADX阈值,用于过滤非趋势状态下的错误信号,只有ADX高于阈值时才会产生实际的做多做空信号。
优势分析
相比简单的移动平均线策略,该策略最大的优势在于引入了动量指标判定趋势反转,可以更及时、精准地跟踪趋势与反转。具体优势如下:
-
移动平均线本身对价格变化响应滞后,而动量指标可以更快捕捉到反转信号,有利于及时止损或反向开仓。
-
基于动量指标判定的反转信号更加可靠,可以减少趋势交易中不必要的反复开平仓。
-
ADX指标的应用避免了非趋势市场中的错误信号,让策略更专注于趋势阶段,从而提高获利概率。
-
策略逻辑清晰简单,容易理解和跟踪,适合算法交易初学者学习。
-
指标参数优化空间大,可以通过调整移动平均线周期、动量参数等实现针对不同市场的优化。
风险分析
该策略主要风险来源于以下几个方面:
-
移动平均线本身对价格变化响应滞后,可能导致信号产生滞后,错过最佳入场时机。
-
假突破造成不必要的开仓或平仓,需要进一步优化指标参数或引入附加过滤条件。
-
趋势反转判断依赖动量指标,当市场剧烈变化时,动量指标的效果可能会打折扣。
-
ADX指数无法完美判断趋势和盘整,阈值设置过高或过低都会导致问题。
-
策略未考虑交易成本,实际运用时需注意设置止损点以控制风险。
优化方向
该策略可以从以下几个方面进行进一步优化:
-
尝试其它类型的移动平均线,或调整移动平均线参数,优化指标的平滑效果。
-
优化动量指标的长度参数,使其可以更敏感地捕捉到价格反转。
-
尝试在动量指标反转时设置价格过滤,避免被短期小波动误导。
-
进一步增强ADX的使用,比如不同ADX水平使用不同参数等。
-
引入交易量指标等辅助条件,提高信号质量,过滤假突破。
-
添加止损机制来控制单笔损失。评估真实市场的手续费水平,设定合理的止盈止损。
总结
该策略整合移动平均线指标和动量指标的优势,实现了对趋势的跟踪与反转的捕捉。相比纯趋势跟踪,该策略可以更灵活地应对市场不同阶段,在保持趋势交易的同时,避免冲高回落带来的损失。通过参数优化和辅助条件引入,策略效果还有进一步提升的空间。总体来说,该策略逻辑清晰、简单可靠,非常适合算法交易初学者学习和运用。
||
Overview
This strategy combines moving average crossovers and momentum indicators to effectively track and reverse trends. It first uses fast and slow moving averages to generate golden cross long signals and death cross short signals. Then with momentum indicators of certain parameters, if the momentum on the fast MA turns up again after golden cross, the trend is considered continuing and long position will be kept. When momentum turns down, it's considered as trend reversal and existing position will be closed. The same logic applies to death cross short signals when tracking trend reversals. ADX filter is also used to avoid wrong signals when not in trending state.
Strategy Logic
The core logic of this strategy is based on trend signals from MA crossovers and trend reversal signals from momentum indicators. The key parts are:
-
Calculate fast MA price1 (5-period HMA) and slow MA price2 (7-period HMA).
-
Golden cross with price1 crossing above price2 generates long signal. Death cross with price1 crossing below price2 generates short signal. This is the common usage of MAs.
-
After long signal, if price1's momentum roc1 turns up again, the trend is considered continuing and long position will be kept.
-
When momentum roc1 turns down, it's considered as trend reversal and existing position will be closed. Same logic applies to short signals.
-
Introduce ADX threshold to avoid wrong signals when not in trending state. Signals are generated only when ADX is above threshold.
Advantage Analysis
Compared to simple MA strategies, the biggest advantage of this strategy is the introduction of momentum indicators to determine trend reversals more promptly and accurately. Specific advantages:
-
MAs themselves lag price changes, while momentum indicators can quickly capture reversal signals for timely stop loss or reverse trading.
-
Reversal signals based on momentum are more reliable, avoiding unnecessary open/close orders during trend trading.
-
ADX avoids wrong signals in non-trending markets, keeping the strategy more focused on trends with higher winning odds.
-
The logic is simple and easy to understand, suitable for algo trading beginners.
-
Large optimization space by adjusting MA periods, momentum parameters etc. for different markets.
Risk Analysis
The main risks of this strategy come from:
-
The lagging nature of MAs, which may cause delayed signals, missing best entry points.
-
False breakouts causing unnecessary entries or exits. Needs further optimization of parameters or additional filters.
-
Trend reversal detection relies on momentum, which may falter during huge market swings.
-
ADX is imperfect in detecting trends and consolidations. Improper threshold settings can cause issues.
-
No consideration of trading costs. Proper stop loss should be set when applied in real trading.
Optimization Directions
The strategy can be further optimized in the following aspects:
-
Try other types of MAs or adjust MA parameters for better smoothing effects.
-
Optimize momentum indicator length for higher sensitivity to catch price reversals.
-
Set price filters when momentum reverses to avoid being misled by short-term fluctuations.
-
Enhance ADX usage by using different parameters at different ADX levels.
-
Introduce volume indicators etc. to improve signal quality and filter false breakouts.
-
Add stop loss mechanisms to control single trade loss. Evaluate realistic trading costs to set proper profit targets and stop loss.
Summary
This strategy combines the advantages of MA and momentum indicators to track trends and capture reversals. Compared to pure trend following strategies, it can be more flexible in dealing with different market stages, avoiding losses from trend climax while keeping trend trading. Further improvements can be made through parameter optimization and introducing auxiliary conditions. Overall speaking, the strategy has clear and simple logic, very suitable for algo trading beginners to learn and apply.
[/trans]
Strategy Arguments
| Argument | Default | Description |
|---|---|---|
| v_input_1_open | 0 | Source: open |
| v_input_2 | 5 | 1st MA Length |
| v_input_3 | 0 | 1st MA Type: HMA |
| v_input_4 | 7 | 2nd MA Length |
| v_input_5 | 0 | 2nd MA Type: HMA |
| v_input_6 | 14 | ADX Smoothing |
| v_input_7 | 14 | DI Length |
| v_input_8 | 20 | ADX threshold |
| v_input_9 | true | Lookback 1 |
| v_input_10 | 2 | Minimum slope magnitude * 100 |
Source (PineScript)
/*backtest
start: 2023-09-23 00:00:00
end: 2023-10-23 00:00:00
period: 4h
basePeriod: 15m
exchanges: [{"eid":"Futures_Binance","currency":"BTC_USDT"}]
*/

//@version=3
//study(title="MA Crossover Strategy", overlay = true)
strategy("MA Crossover Strategy with MA Turning Point Exits", overlay=true)
src = input(open, title="Source")

price = request.security(syminfo.tickerid, timeframe.period, src)
ma1 = input(5, title="1st MA Length")
type1 = input("HMA", "1st MA Type", options=["SMA", "EMA", "HMA"])

ma2 = input(7, title="2nd MA Length")
type2 = input("HMA", "2nd MA Type", options=["SMA", "EMA", "HMA"])

adxlen = input(14, title="ADX Smoothing")
dilen = input(14, title="DI Length")
adxthreshold = input(20, title="ADX threshold")

dirmov(len) =>
	up = change(high)
	down = -change(low)
	plusDM = na(up) ? na : (up > down and up > 0 ? up : 0)
	minusDM = na(down) ? na : (down > up and down > 0 ? down : 0)
	truerange = rma(tr, len)
	plus = fixnan(100 * rma(plusDM, len) / truerange)
	minus = fixnan(100 * rma(minusDM, len) / truerange)
	[plus, minus]
adx(dilen, adxlen) =>
	[plus, minus] = dirmov(dilen)
	sum = plus + minus
	adx = 100 * rma(abs(plus - minus) / (sum == 0 ? 1 : sum), adxlen)

sig = adx(dilen, adxlen)

//study("Average Directional Index", shorttitle="ADX", format=format.price, precision=2, resolution="")

//plot(sig, color=color.red, title="ADX")

f_hma(_src, _length)=>
    _return = wma((2*wma(_src, _length/2))-wma(_src, _length), round(sqrt(_length)))
price1 = if (type1 == "SMA")
    sma(price, ma1)
else
    if (type1 == "EMA")
        ema(price, ma1)
    else
        f_hma(price, ma1)

price2 = if (type2 == "SMA")
    sma(price, ma2)
else
    if (type2 == "EMA")
        ema(price, ma2)
    else
        f_hma(price, ma2)

//plot(series=price, style=line,  title="Price", color=black, linewidth=1, transp=0)
plot(series=price1, style=line,  title="1st MA", color=blue, linewidth=2, transp=0)
plot(series=price2, style=line, title="2nd MA", color=green, linewidth=2, transp=0)


//longCondition = price1> price2
longCondition = price1> price2 and sig > adxthreshold
if (longCondition)
    strategy.entry("Long", strategy.long)

shortCondition = price1 < price2 and sig > adxthreshold
if (shortCondition)
    strategy.entry("Short", strategy.short)

lookback1 = input(1, "Lookback 1")
roc1 = roc(price1, lookback1)

ma1up = false
ma1down = false
ma2up = false
ma2down = false

ma1up := nz(ma1up[1])
ma1down := nz(ma1down[1])
ma2up := nz(ma2up[1])
ma2down := nz(ma2down[1])

trendStrength1 = input(2, title="Minimum slope magnitude * 100", type=float) * 0.01

if crossover(roc1, trendStrength1)
    ma1up := true
    ma1down := false

if crossunder(roc1, -trendStrength1)
    ma1up := false
    ma1down := true

shortexitCondition = ma1up and ma1down[1] and sig > adxthreshold
if (shortexitCondition)
    strategy.close("Short")

longexitCondition = ma1down and ma1up[1] and sig > adxthreshold
if (longexitCondition)
    strategy.close("Long")
Detail
https://www.fmz.com/strategy/430023
Last Modified
2023-10-24 12:31:44