
7.7 KiB
Name
动量型指数趋势跟随策略Momentum-Index-ETF-Trend-Following-Strategy
Author
ChaoZhang
Strategy Description
 [trans]
概述
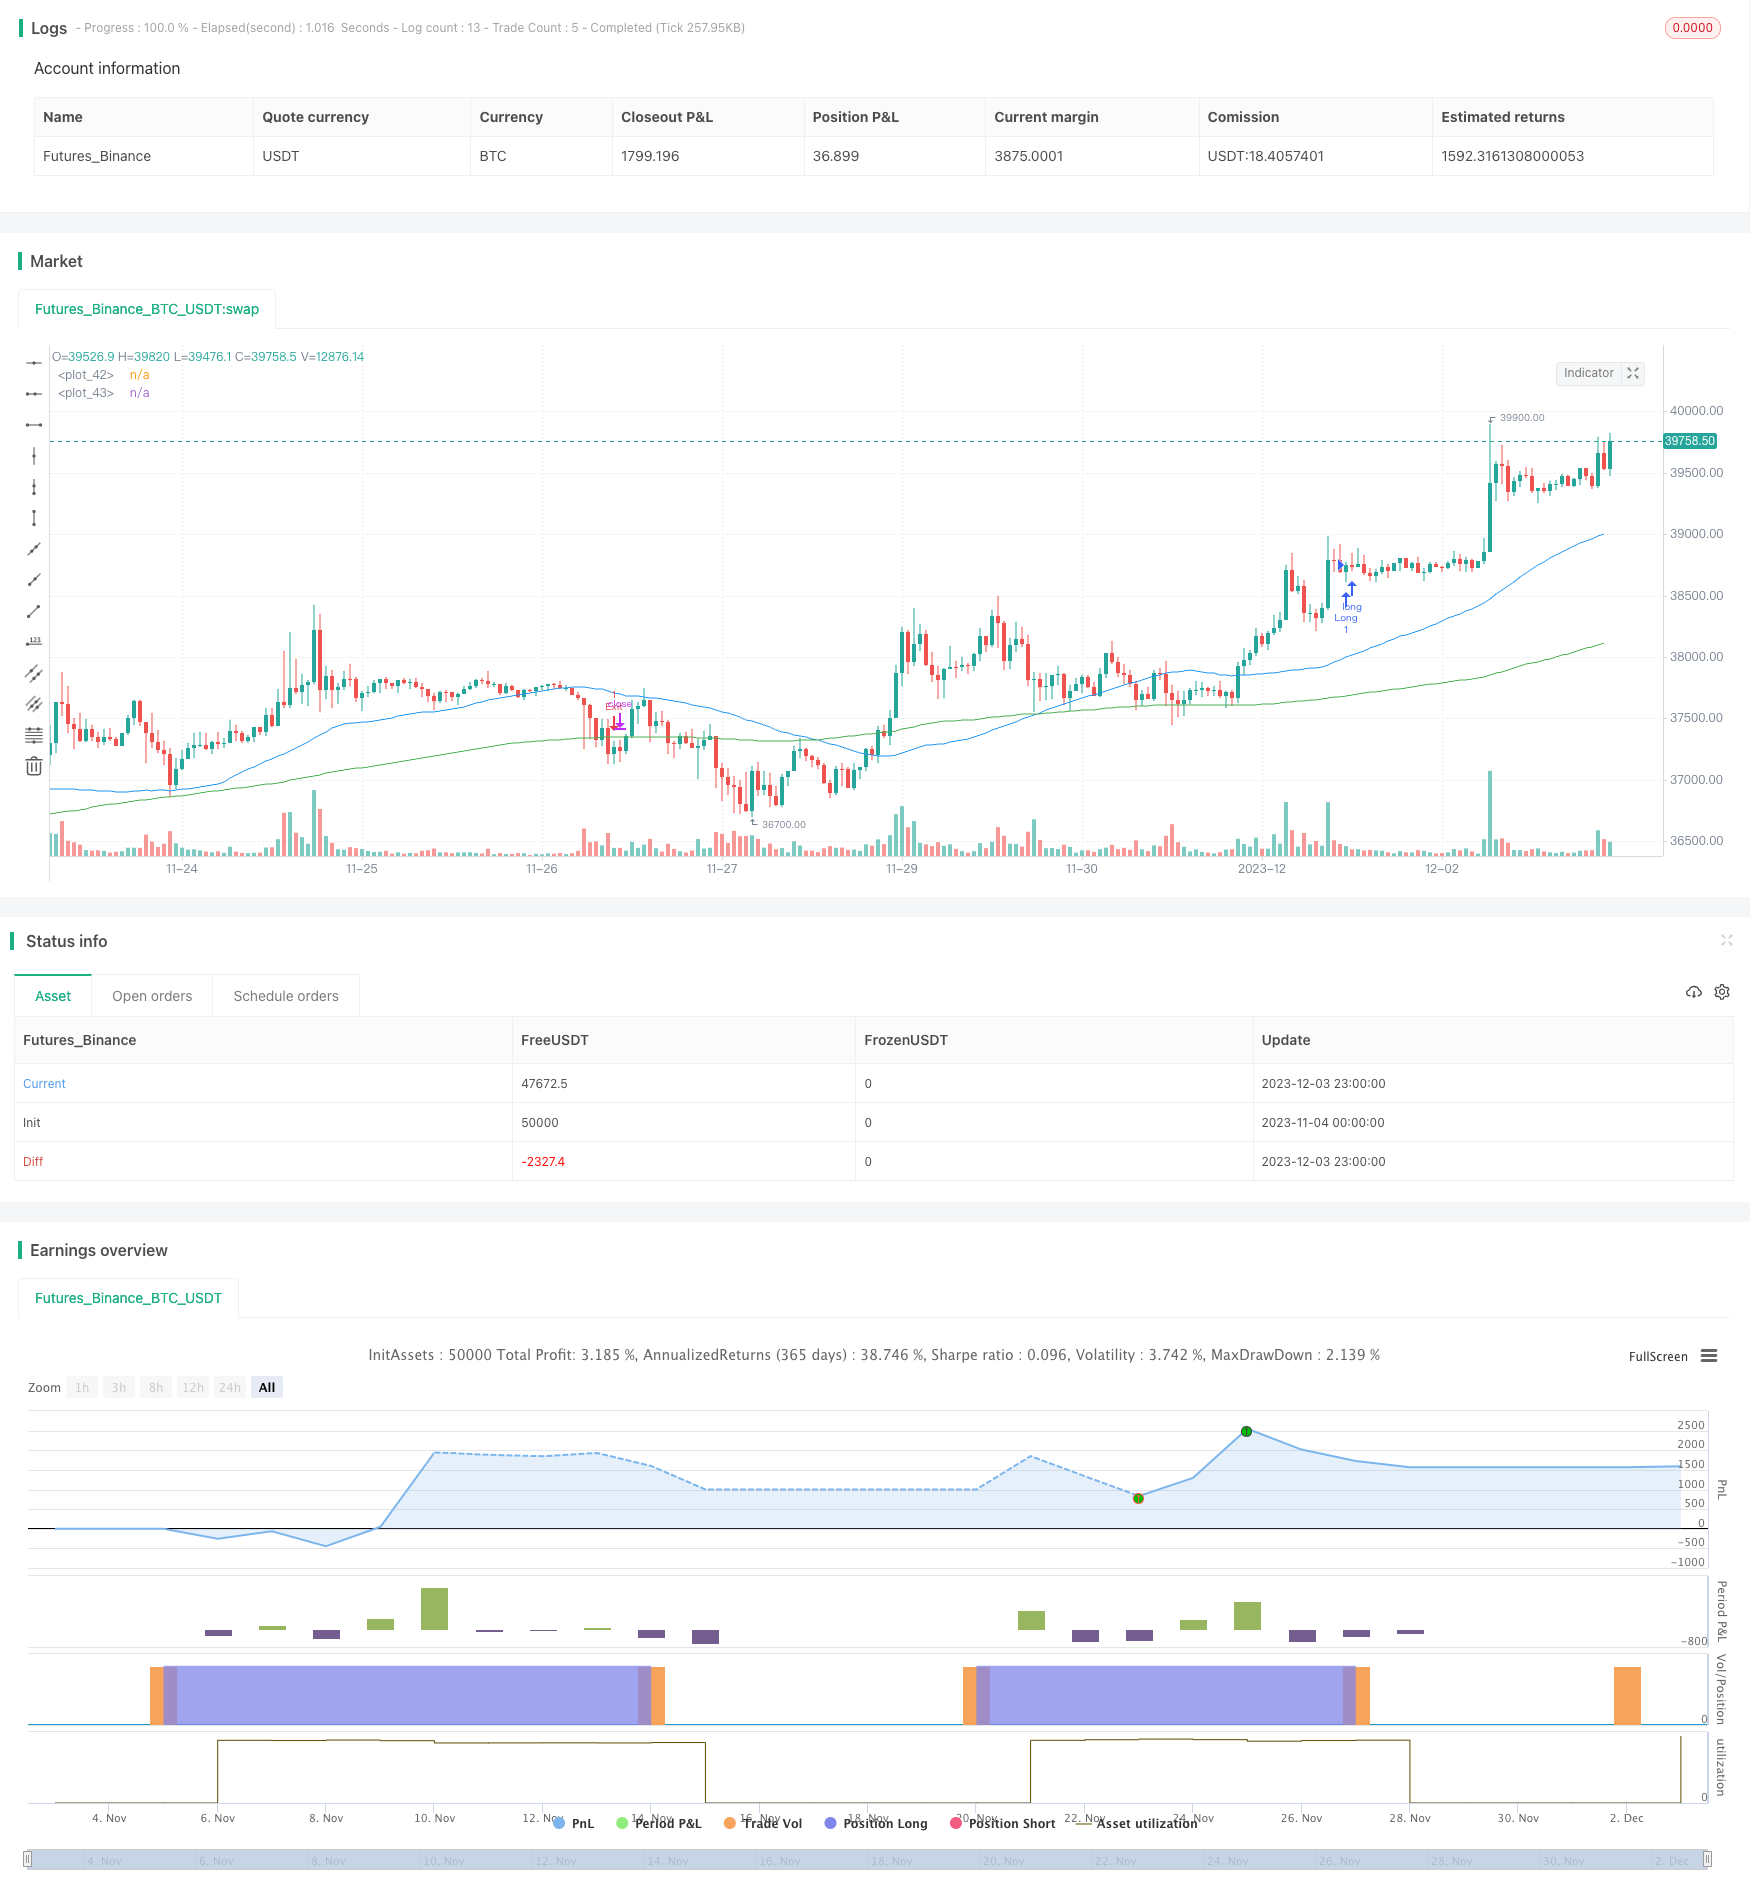
这是一个基于移动平均线的指数ETF动量型趋势跟随策略。它利用快速移动平均线和慢速移动平均线的方向和斜率交叉来判断趋势方向,实现低风险指数ETF资产的动量型趋势跟随。
策略原理
该策略使用50周期和150周期的移动平均线。当快速移动平均线上穿慢速移动平均线,并且快速移动平均线的斜率大于阈值时,认为趋势转向,做多;当快速移动平均线下穿慢速移动平均线,或者快速移动平均线斜率小于阈值时,认为趋势反转,平仓。
该策略简单直接地利用移动平均线的方向和斜率判断市场趋势,避免曲线拟合,有效控制风险。同时,移动平均线天然具有去噪特性,可以有效过滤市场噪音。
优势分析
这是一个低风险的指数ETF动量型趋势跟随策略,具有如下优势:
- 风险控制能力强。通过移动平均线过滤市场噪音,有效控制风险。
- 实现成本低。仅使用简单的移动平均线,实现成本低,易于实施。
- 收益稳定。指数ETF本身波动小,配合趋势跟随,可以获得稳定的超额收益。
- 适应性强。可调整的参数较多,可以针对不同指数ETF进行优化。
风险分析
该策略也存在一些风险:
- 可能错过快速反转。使用移动平均线判断趋势,可能错过快速反转。
- 参数敏感。参数设置不当可能导致交易次数过多或错过机会。
- 效果随市场环境变化。在震荡行情中可能表现不佳。
对应解决方法:
- 结合其他指标判断快速反转。
- 对参数进行测试优化。
- 根据市场环境动态调整参数。
优化方向
该策略还可以从以下几个方面进行优化:
- 利用MACD、KD等其他指标辅助判断,提高策略效果。
- 增加止损逻辑,进一步控制风险。
- 优化移动平均线周期参数,适应更多指数ETF。
- 动态调整参数,适应市场环境变化。
总结
本策略是一个低风险、简单易实施的指数ETF动量型趋势跟随策略。它利用移动平均线的交叉判定趋势方向,具有风险控制能力强、实现成本低、收益稳定等优势。该策略也存在一定的缺陷,但可以通过多种方式进一步优化,使其成为指数ETF资产配置的有效工具。 ||
Overview
This is a momentum index ETF trend following strategy based on moving averages. It uses the crossover and slope of fast and slow moving averages to determine the trend direction for low-risk momentum trend following of index ETF assets.
Strategy Logic
The strategy uses 50-period and 150-period moving averages. When the fast moving average crosses over the slow moving average, and the slope of the fast moving average is greater than the threshold, it signals an upside trend reversal for long entry. When the fast moving average crosses below the slow moving average, or the slope of the fast moving average is less than the threshold, it signals a downside trend reversal for exiting positions.
The strategy simply utilizes the direction and slope of moving averages to determine market trend, avoiding overfitting and effectively controlling risks. Meanwhile, moving averages inherently have the ability to filter out market noise for robust signals.
Advantage Analysis
This is a low-risk momentum index ETF trend following strategy with the following advantages:
- Strong risk control ability. Moving averages filter market noise for effective risk control.
- Low implementation cost. Only simple moving averages are used, resulting in low cost and easy implementation.
- Stable profits. Index ETFs themselves have low volatility, combined with trend following, stable excess returns can be achieved.
- High adaptability. Many adjustable parameters allow optimizations for different index ETFs.
Risk Analysis
There are also some risks:
- Potentially missing quick reversals. Using moving averages to determine trends may miss out quick reversals.
- Parameter sensitive. Improper parameter settings may result in overtrading or missing opportunities.
- Performance dependence on market conditions. May underperform in choppy/sideway markets.
Solutions:
- Incorporate other indicators to determine quick reversals.
- Test and optimize parameters.
- Dynamically adjust parameters based on changing market conditions.
Optimization Directions
There are a few areas this strategy can be further optimized:
- Utilize other indicators like MACD, KD to complement the strategy.
- Incorporate stop loss logic to further control risks.
- Optimize moving average periods to adapt more index ETFs.
- Dynamically adjust parameters to suit different market environments.
Conclusion
In conclusion, this is a low-risk, easy-to-implement momentum index ETF trend following strategy. It determines trend directions using moving average crossovers and has advantages like strong risk control, low implementation cost and stable profits. Although some flaws exist, the strategy can be further improved in many aspects to become an effective tool for index ETF asset allocation.
[/trans]
Strategy Arguments
| Argument | Default | Description |
|---|---|---|
| v_input_1 | 50 | Fast Moving Average (Int) |
| v_input_2 | 150 | Slow Moving Average (Int) |
| v_input_3 | 5 | Bullish Slope Angle (Deg) |
| v_input_4 | -5 | Bearish Slope Angle (Deg) |
| v_input_5 | 14 | Average True Range (Int) |
| v_input_6 | 100 | Risk (%) |
Source (PineScript)
/*backtest
start: 2023-11-04 00:00:00
end: 2023-12-04 00:00:00
period: 1h
basePeriod: 15m
exchanges: [{"eid":"Futures_Binance","currency":"BTC_USDT"}]
*/

//@version=4
//please use on daily SPY, or other indexes only
strategy("50-150 INDEX TREND FOLLOWING", overlay=true)

//user input
fastSMA = input(title="Fast Moving Average (Int)",type=input.integer,minval=1,maxval=1000,step=1,defval=50,confirm=false)
slowSMA = input(title="Slow Moving Average (Int)",type=input.integer,minval=1,maxval=1000,step=1,defval=150,confirm=false)
longSlopeThreshold = input(title="Bullish Slope Angle (Deg)",type=input.integer,minval=-90,maxval=90,step=1,defval=5,confirm=false)
shortSlopeThreshold = input(title="Bearish Slope Angle (Deg)",type=input.integer,minval=-90,maxval=90,step=1,defval=-5,confirm=false)
atrValue = input(title="Average True Range (Int)",type=input.integer,minval=1,maxval=100,step=1,defval=14,confirm=false)
risk = input(title="Risk (%)",type=input.integer,minval=1,maxval=100,step=1,defval=100,confirm=false)

//create indicator
shortSMA = sma(close, fastSMA)
longSMA = sma(close, slowSMA)

//calculate ma slope
angle(_source) =>
    rad2degree=180/3.14159265359
    ang=rad2degree*atan((_source[0] - _source[1])/atr(atrValue))

shortSlope=angle(shortSMA)
longSlope=angle(longSMA)

//specify crossover conditions
longCondition = (crossover(shortSMA, longSMA) and (shortSlope > longSlopeThreshold)) or ((close > shortSMA) and (shortSMA > longSMA) and (shortSlope > longSlopeThreshold))
exitCondition = crossunder(shortSMA, longSMA) or (shortSlope < shortSlopeThreshold)
strategy.initial_capital = 50000
//units to buy
amount = (risk / 100) * (strategy.initial_capital + strategy.netprofit)
units = floor(amount / close)

//long trade
if (longCondition and strategy.position_size == 0)
    strategy.order("Long", strategy.long, units)

//close long trade
if (exitCondition and strategy.position_size > 0)
    strategy.order("Exit", strategy.short, strategy.position_size)

// Plot Moving Average's to chart
plot(shortSMA, color=color.blue)
plot(longSMA, color=color.green)
Detail
https://www.fmz.com/strategy/434332
Last Modified
2023-12-05 15:13:25