
13 KiB
Name
动量交易之双均线交叉策略-Momentum-Trading-with-Dual-Moving-Average-Crossover-Strategy
Author
ChaoZhang
Strategy Description
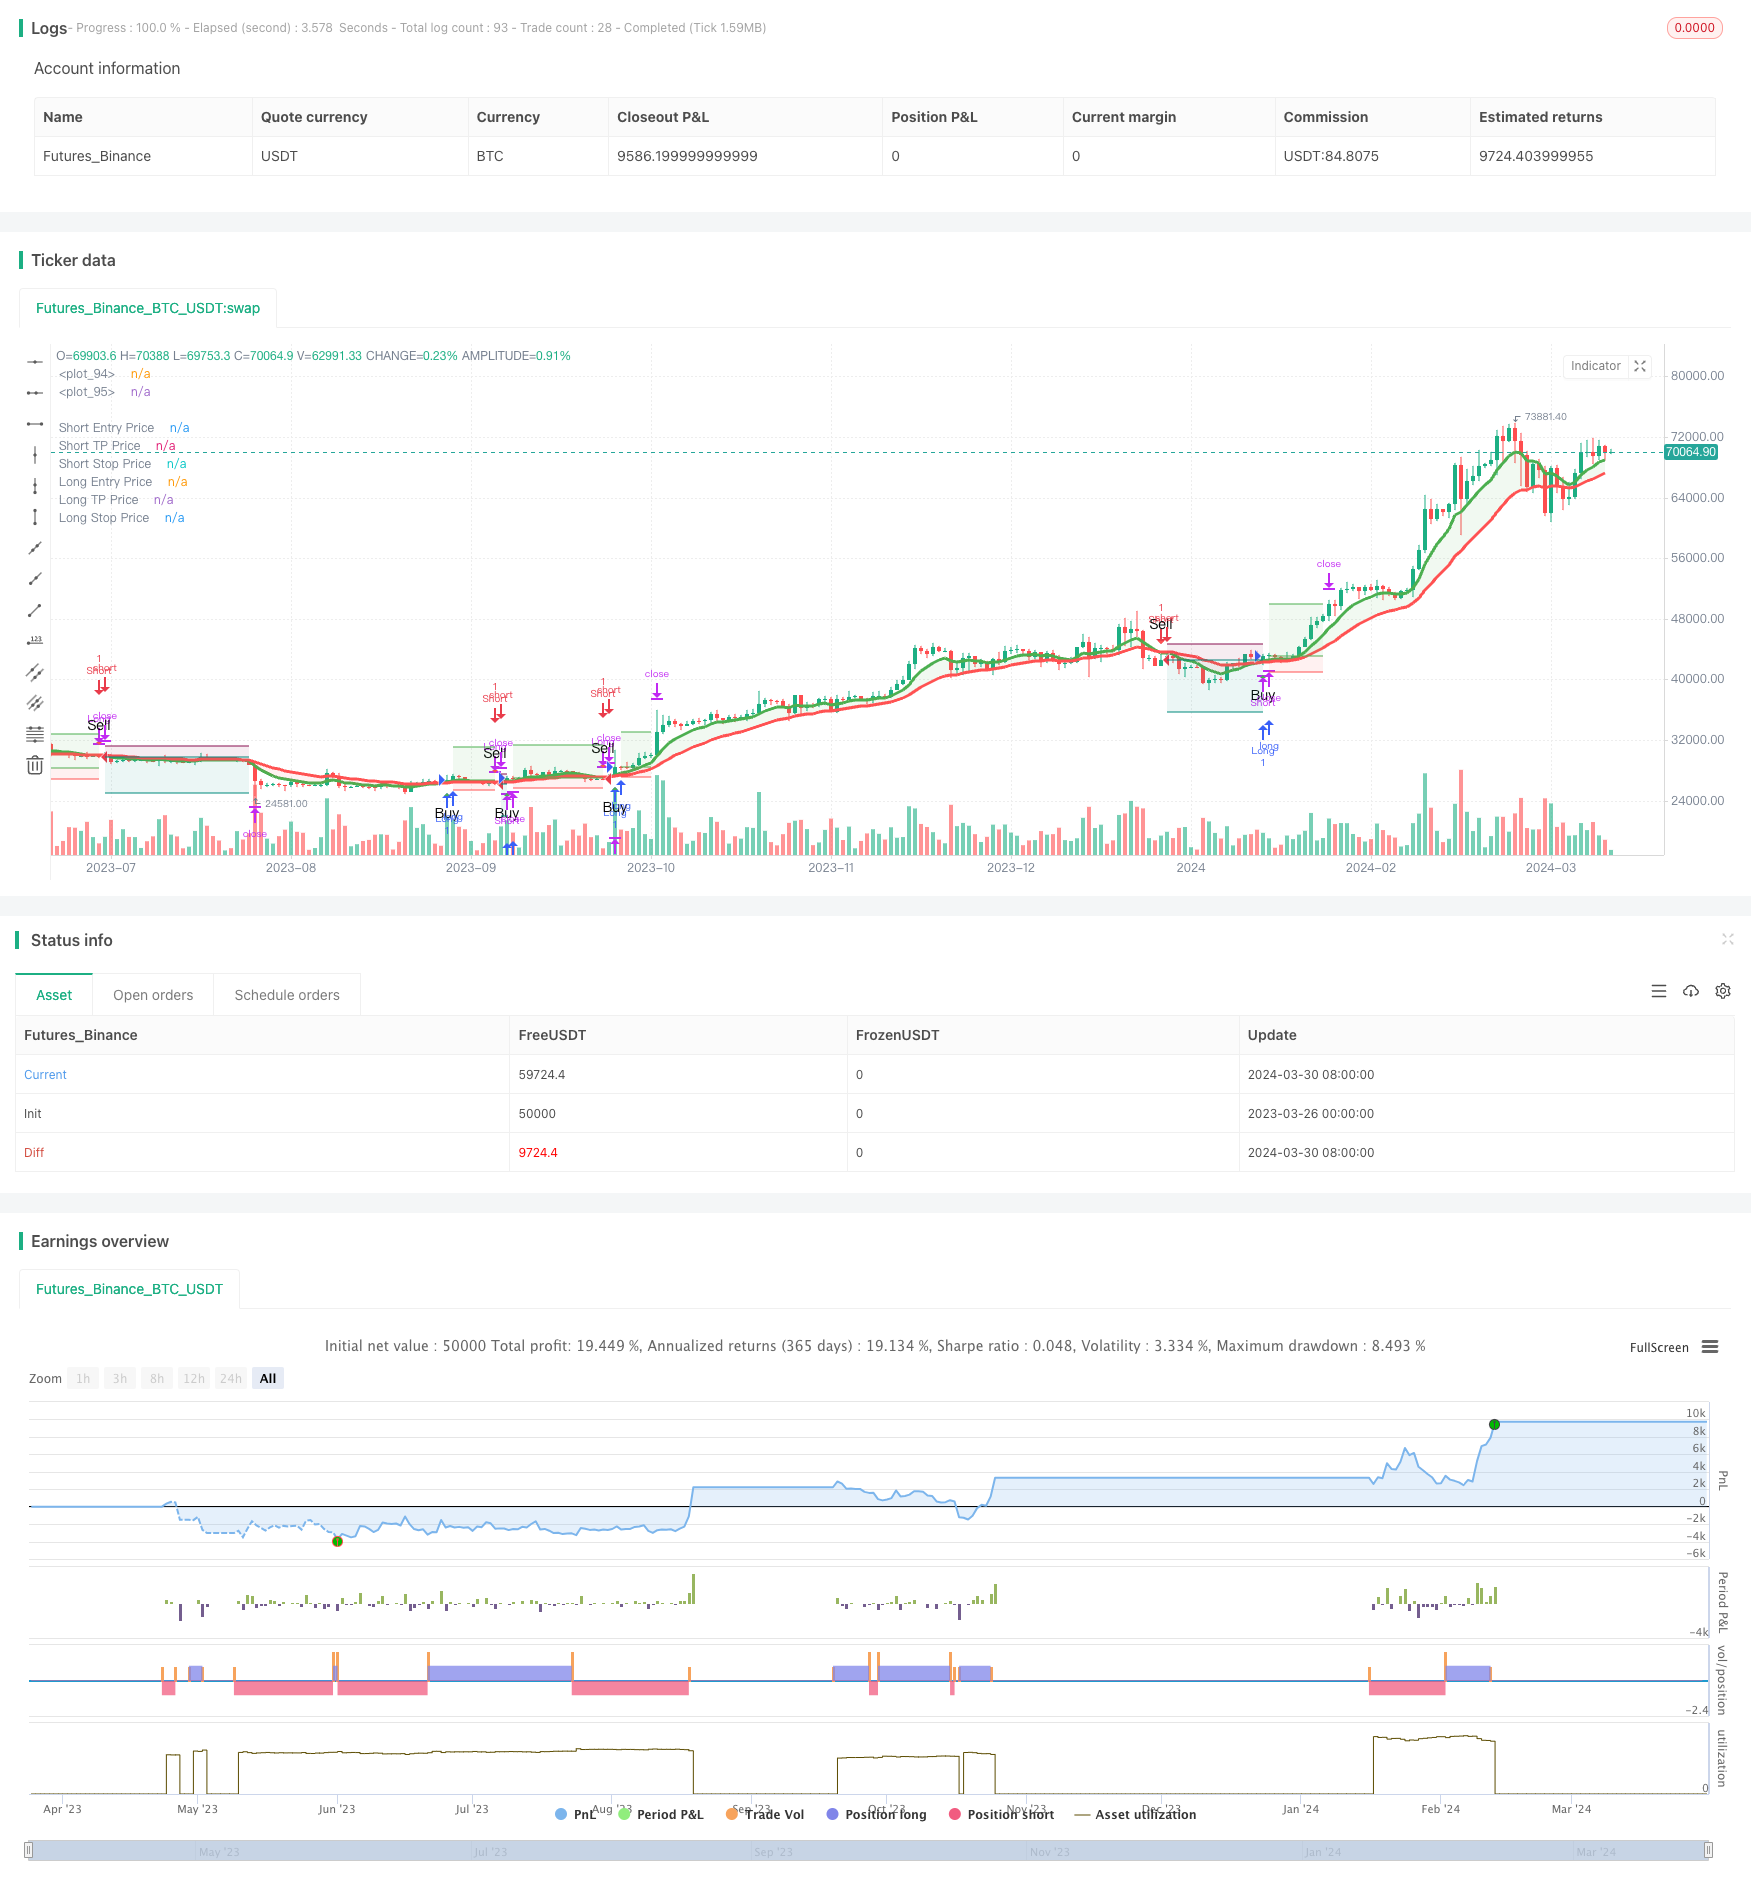
[trans]
概述
该策略使用8周期和21周期的指数移动平均线(EMA)来识别市场趋势的变化。当较短周期的EMA从下方穿越较长周期的EMA时,产生买入信号;反之,当较短周期的EMA从上方穿越较长周期的EMA时,产生卖出信号。该策略还结合了三个连续更高的低点(HLL)和三个连续更低的高点(LLH)作为进一步确认趋势反转的信号。此外,该策略还设置了止损和止盈水平,以控制风险和锁定利润。
策略原理
- 计算8周期和21周期的EMA,用于识别主要趋势方向。
- 识别三个连续更高的低点(HLL)和三个连续更低的高点(LLH),作为趋势反转的早期信号。
- 当8周期EMA从下方穿越21周期EMA,且出现HLL突破时,产生买入信号;当8周期EMA从上方穿越21周期EMA,且出现LLH突破时,产生卖出信号。
- 设置止损水平为入场价格的5%,止盈水平为入场价格的16%,以控制风险和锁定利润。
- 当出现反向信号时,平仓并反向开仓。
策略优势
- 结合EMA和价格行为模式(HLL和LLH)来确认趋势,提高信号可靠性。
- 设置明确的止损和止盈水平,有助于控制风险和锁定利润。
- 适用于多个时间框架和不同市场,具有一定的普适性。
- 逻辑清晰,易于理解和实现。
策略风险
- 在震荡市场中,频繁的交叉可能导致多次虚假信号,导致亏损。
- 固定的止损和止盈水平可能无法适应不同的市场环境,导致潜在的机会成本或更大的损失。
- 策略依赖于历史数据,对于突发事件或基本面变化的适应性可能较差。
策略优化方向
- 引入自适应止损和止盈机制,如基于波动率(如ATR)来调整止损和止盈水平,以更好地适应不同市场状况。
- 结合其他指标或因子,如成交量、相对强弱指数(RSI)等,以进一步过滤信号并提高可靠性。
- 对参数(如EMA周期、止损止盈比例等)进行优化,找到在特定市场或标的上表现最佳的参数组合。
- 考虑引入风险管理措施,如仓位sizing,以控制单次交易的风险敞口。
总结
该策略利用8周期和21周期EMA的交叉,结合HLL和LLH价格模式,以识别趋势反转并产生交易信号。明确的止损止盈规则有助于控制风险和锁定利润。然而,该策略在震荡市场中可能产生虚假信号,固定的止损止盈水平也可能无法适应不同市场环境。为进一步改进,可考虑引入自适应止损止盈、结合其他指标、优化参数以及引入风险管理措施等。总的来说,该策略提供了一个基于动量和趋势跟踪的交易框架,但仍需要根据具体市场和个人偏好进行调整和优化。
||
Overview
This strategy employs the 8-period and 21-period Exponential Moving Averages (EMAs) to identify changes in market trends. A buy signal is generated when the shorter-term EMA crosses above the longer-term EMA from below, while a sell signal is generated when the shorter-term EMA crosses below the longer-term EMA from above. The strategy also incorporates three consecutive Higher Lows (HLs) and three consecutive Lower Highs (LHs) as further confirmation of trend reversals. Additionally, stop-loss and take-profit levels are set to manage risk and lock in profits.
Strategy Principles
- Calculate the 8-period and 21-period EMAs to identify the primary trend direction.
- Identify three consecutive Higher Lows (HLs) and three consecutive Lower Highs (LHs) as early signals of potential trend reversals.
- Generate a buy signal when the 8-period EMA crosses above the 21-period EMA and an HL breakout occurs; generate a sell signal when the 8-period EMA crosses below the 21-period EMA and an LH breakout occurs.
- Set the stop-loss level at 5% of the entry price and the take-profit level at 16% of the entry price to manage risk and lock in profits.
- Close the position and open a reverse position when an opposite signal appears.
Strategy Advantages
- Combines EMAs and price action patterns (HLs and LHs) to confirm trends, enhancing signal reliability.
- Sets clear stop-loss and take-profit levels, helping to manage risk and lock in profits.
- Applicable to multiple timeframes and different markets, offering some level of versatility.
- Clear logic, easy to understand and implement.
Strategy Risks
- In choppy markets, frequent crossovers may lead to multiple false signals, resulting in losses.
- Fixed stop-loss and take-profit levels may not adapt well to different market conditions, leading to potential opportunity costs or larger losses.
- The strategy relies on historical data and may not adapt well to sudden events or fundamental changes.
Strategy Optimization Directions
- Introduce adaptive stop-loss and take-profit mechanisms, such as adjusting the levels based on volatility (e.g., ATR), to better adapt to different market conditions.
- Incorporate other indicators or factors, such as volume, Relative Strength Index (RSI), etc., to further filter signals and improve reliability.
- Optimize parameters (e.g., EMA periods, stop-loss and take-profit percentages) to find the best-performing combination for specific markets or instruments.
- Consider introducing risk management measures, such as position sizing, to control the risk exposure of individual trades.
Summary
This strategy utilizes the crossover of 8-period and 21-period EMAs, combined with HL and LH price patterns, to identify trend reversals and generate trading signals. Clear stop-loss and take-profit rules help manage risk and lock in profits. However, the strategy may generate false signals in choppy markets, and fixed stop-loss and take-profit levels may not adapt well to different market conditions. To further improve, consider introducing adaptive stop-loss and take-profit, incorporating other indicators, optimizing parameters, and introducing risk management measures. Overall, the strategy provides a framework for momentum and trend-following trading but requires adjustments and optimizations based on specific markets and individual preferences. [/trans]
Strategy Arguments
| Argument | Default | Description |
|---|---|---|
| v_input_1 | true | 105ema / 30min |
| v_input_2 | true | Assistant |
| v_input_3 | true | Text |
| v_input_bool_1 | true | (?TP/SL)Show Risk/Reward Area |
| v_input_float_1 | 5 | Stop-Loss %: |
| v_input_float_2 | 16 | Take-Profit %: |
| v_input_4 | false | (?Backtest Date Range)Backtest Entries to Date Range |
| v_input_5 | timestamp(01 Jan 2022 00:00) | Start |
| v_input_6 | timestamp(01 Jan 2029 00:00) | End |
| v_input_string_1 | (?Alert Message)Alert Msg: LONG Entry | |
| v_input_string_2 | Alert Msg: SHORT Entry | |
| v_input_string_3 | Alert Msg: LONG SL/TP | |
| v_input_string_4 | Alert Msg: SHORT SL/TP |
Source (PineScript)
/*backtest
start: 2023-03-26 00:00:00
end: 2024-03-31 00:00:00
period: 1d
basePeriod: 1h
exchanges: [{"eid":"Futures_Binance","currency":"BTC_USDT"}]
*/

//@version=5
strategy('Trend Following 8&21EMA with strategy tester [ukiuro7]', overlay=true, process_orders_on_close=true, calc_on_every_tick=true, initial_capital = 10000)

//INPUTS
lh3On = true
hl3On = true
emaOn = input(title='105ema / 30min', defval=true)
assistantOn = input(title='Assistant', defval=true)
textOn = input(title='Text', defval=true)

showRiskReward = input.bool(true, title='Show Risk/Reward Area', group="TP/SL")
stopPerc = input.float(5.0, step=0.1, minval=0.1, title='Stop-Loss %:',group="TP/SL") / 100
tpPerc = input.float(16.0, step=0.1, minval=0.1, title='Take-Profit %:',group="TP/SL") / 100

backtestFilter = input(false, title='Backtest Entries to Date Range',group="Backtest Date Range")
i_startTime = input(defval=timestamp('01 Jan 2022 00:00'), inline="b_1", title='Start',group="Backtest Date Range")
i_endTime = input(defval=timestamp('01 Jan 2029 00:00'), inline="b_1", title='End',group="Backtest Date Range")
inDateRange = true

message_long_entry = input.string(title='Alert Msg: LONG Entry', defval ='', group='Alert Message')
message_short_entry = input.string(title='Alert Msg: SHORT Entry', defval='', group='Alert Message')
message_long_exit = input.string(title='Alert Msg: LONG SL/TP', defval='', group='Alert Message')
message_short_exit = input.string(title='Alert Msg: SHORT SL/TP', defval='', group='Alert Message')

//CALCS
threeHigherLows() =>
    low[0] >= low[1] and low[1] >= low[2]

threeLowerHighs() =>
    high[2] >= high[1] and high[1] >= high[0]

breakHigher() =>
    padding = timeframe.isintraday ? .02 : .1
    high >= high[1] + padding

breakLower() =>
    padding = timeframe.isintraday ? .02 : .1
    low <= low[1] - padding

lh3 = threeLowerHighs() and lh3On
lh3bh = lh3[1] and breakHigher() and lh3On

hl3 = threeHigherLows() and hl3On
hl3bl = hl3[1] and breakLower() and hl3On

ema8 = ta.ema(close, 8)
ema21 = ta.ema(close, 21)

//VARS
var float longStop = na, var float longTp = na
var float shortStop = na, var float shortTp = na

//CONDS
isUptrend = ema8 >= ema21
isDowntrend = ema8 <= ema21
trendChanging = ta.cross(ema8, ema21)

buySignal = lh3bh and lh3[2] and lh3[3] and isUptrend and timeframe.isintraday
sellSignal = hl3bl and hl3[2] and hl3[3] and isDowntrend and timeframe.isintraday

goingDown = hl3 and isDowntrend and timeframe.isintraday
goingUp = lh3 and isUptrend and timeframe.isintraday

projectXBuy = trendChanging and isUptrend
projectXSell = trendChanging and isDowntrend

longCond = trendChanging and isUptrend and assistantOn
shortCond = trendChanging and isDowntrend and assistantOn

//STRATEGY
if shortCond and strategy.position_size > 0 and barstate.isconfirmed
    strategy.close('Long', comment='CLOSE LONG', alert_message=message_long_exit)

if longCond and strategy.position_size < 0 and barstate.isconfirmed
    strategy.close('Short', comment='CLOSE SHORT', alert_message=message_short_exit)

if longCond and strategy.position_size <= 0 and barstate.isconfirmed and inDateRange
    longStop := close * (1 - stopPerc)
    longTp := close * (1 + tpPerc)
    strategy.entry('Long', strategy.long, comment='LONG', alert_message=message_long_entry)
    strategy.exit('Long Exit', 'Long', comment_loss="SL LONG", comment_profit = "TP LONG", stop=longStop, limit=longTp, alert_message=message_long_exit)

if shortCond and strategy.position_size >= 0 and barstate.isconfirmed and inDateRange
    shortStop := close * (1 + stopPerc)
    shortTp := close * (1 - tpPerc)
    strategy.entry('Short', strategy.short, comment='SHORT', alert_message=message_short_entry)
    strategy.exit('Short Exit', 'Short', comment_loss="SL SHORT", comment_profit="TP SHORT", stop=shortStop, limit=shortTp, alert_message=message_short_exit)

//PLOTS
plotshape(longCond, style=shape.triangleup, location=location.belowbar, color=color.new(color.green, 0), size=size.small, text='Buy')
plotshape(shortCond, style=shape.triangledown, location=location.abovebar, color=color.new(color.red, 0), size=size.small, text='Sell')
plotchar(trendChanging and isUptrend and close < open and assistantOn, char='!', location=location.abovebar, color=color.new(color.green, 0), size=size.small)

aa = plot(ema8, linewidth=3, color=color.new(color.green, 0), editable=true)
bb = plot(ema21, linewidth=3, color=color.new(color.red, 0), editable=true)
fill(aa, bb, color=isUptrend ? color.new(color.green,90) : color.new(color.red,90))
buyZone = isUptrend and lh3 and high < ema21 and timeframe.isintraday
sellZone = isDowntrend and hl3 and low > ema21 and timeframe.isintraday

L1 = plot(showRiskReward and strategy.position_size > 0 ? strategy.position_avg_price : na, color=color.new(color.green, 0), linewidth=1, style=plot.style_linebr, title='Long Entry Price')
L2 = plot(showRiskReward and strategy.position_size > 0 ? longTp : na, color=color.new(color.green, 0), linewidth=1, style=plot.style_linebr, title='Long TP Price')
L3 = plot(showRiskReward and strategy.position_size > 0 ? longStop : na, color=color.new(color.red, 0), linewidth=1, style=plot.style_linebr, title='Long Stop Price')

S1 = plot(showRiskReward and strategy.position_size < 0 ? strategy.position_avg_price : na, color=color.new(color.teal, 0), linewidth=1, style=plot.style_linebr, title='Short Entry Price')
S2 = plot(showRiskReward and strategy.position_size < 0 ? shortTp : na, color=color.new(color.teal, 0), linewidth=1, style=plot.style_linebr, title='Short TP Price')
S3 = plot(showRiskReward and strategy.position_size < 0 ? shortStop : na, color=color.new(color.maroon, 0), linewidth=1, style=plot.style_linebr, title='Short Stop Price')

fill(L1, L2, color=color.new(color.green, 90))
fill(L1, L3, color=color.new(color.red, 90))
fill(S1, S2, color=color.new(color.teal, 90))
fill(S1, S3, color=color.new(color.maroon, 90))

bgcolor(inDateRange == false ? color.new(color.red,90) : na, title="Backtest Off-Range")
Detail
https://www.fmz.com/strategy/446763
Last Modified
2024-04-01 11:53:14